U.S. Quarterly Economic Forecast
Still in the Game
Date Published: June 18, 2026
Click here to jump to our forecast tables.
- The Iran-U.S. peace deal has sent oil prices down, but not to pre-war levels. Four months of supply backlogs will take time to normalize, and the impact of higher prices will still be felt in the global economy. Global growth has shifted into a lower gear, compounded by prospects for renewed central bank tightening.
- The U.S. economy is set for another solid year of growth, leaving inflation too high for the Fed’s comfort. Patience is expected to be the Fed’s gameplan this year, with rate cuts off the table.
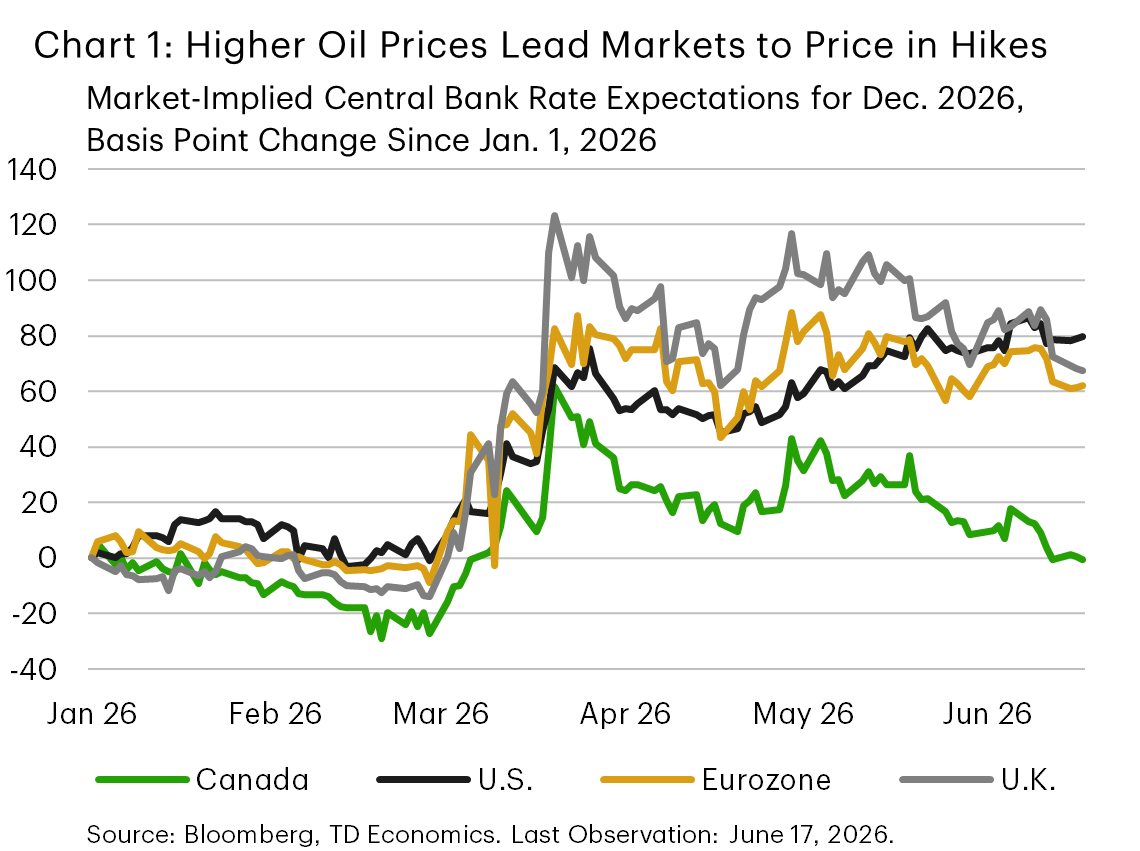
The Middle East conflict and ensuing energy shock lasted longer than we assumed in the early days of March. While it has not upended the global economy, it has shifted growth into a lower gear. Higher energy prices and the prospect of renewed central bank tightening are all contributing to a modestly weaker global outlook (Chart 1). Indeed, the ECB has already hiked its policy rate in response to inflation worries and may do so again later this year. They are likely to be joined by and other global central banks, notably Japan and Australia. We now see global growth expanding at around 3% in both 2026 and 2027, modestly below our March forecast. Downgrades are modest thanks to a few buffers; namely healthy oil inventories going into the conflict, targeted fiscal relief, and AI-related tailwinds.
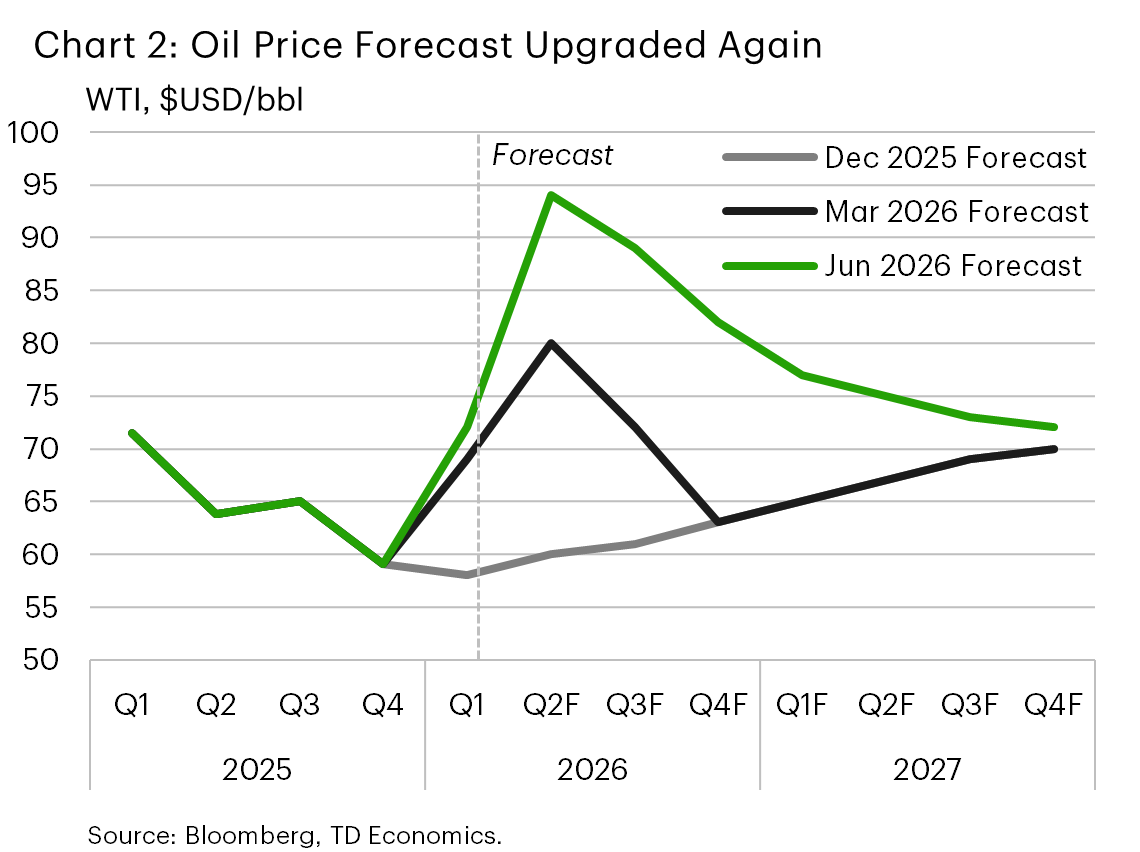
A 60-day peace deal has been reached to re-open the Strait of Hormuz (see commentary). This forecast assumes that shipping through the Strait gradually recovers in the coming weeks, while Gulf region oil production begins a slow normalization process in July. Oil markets are expected to remain physically tight over the coming months, making WTI oil prices prone to bouts of upward pressure and remain in the $80-90/bbl range (Chart 2). The easing of supply disruptions in the second half of the year should help ensure inflation pressures do not become more entrenched, and set the stage for a pull-back in global bond yields.
Globally, the U.S. has been the captain of team resilience, but there have been pockets of strength elsewhere. Japan and the UK saw small rebounds early this year, but we expect higher energy prices will weigh on growth more than policy can offset. More durably, China and other emerging market economies, including India and Brazil, kept solid momentum, and AI-related demand is supporting growth in several smaller emerging markets including South Korea and Taiwan. Europe, by contrast, disappointed in the first quarter of 2026, and tight energy supplies are expected to weigh on activity in the continent through year-end.
U.S. Resilience to See Fed Play a Game of Patience
The U.S. economy has remained resilient through the first three-and-a-half months of the energy shock. That hasn’t come as a surprise. We had noted at the onset of the U.S.-Iran war that due to substantial domestic energy production and lower energy intensity, the U.S. is far less exposed to sharp increases in energy prices. Beyond the structural factors, the AI buildout continues to provide a meaningful tailwind to growth and is also breathing renewed life into the manufacturing sector. At the same time, larger tax refunds and the recent strengthening in the labor market have provided much needed support to households. Economic growth is expected to expand by 2.2% Q4/Q4 in 2026 and 2.1% in 2027.
While households have, so far, weathered the impact of higher energy prices, we still expect the hit to consumers’ pockets to impart some drag on spending activity. Outlays are forecast to advance by about 2% in 2026, or roughly half a point below what we had expected prior to the conflict. Larger tax refunds are providing some near-term cushion, which will be particularly beneficial heading into the summer travel season. However, we estimate that the average household will have exhausted its tax refund by September. Once that’s gone, there’s little in the way of additional spending capacity, with today’s savings rate sitting at 2.6% - matching the lows of the 2022 energy shock. Prior to that, the savings rate had not had a two-handle since early-2008, when household leverage was at an all-time high.
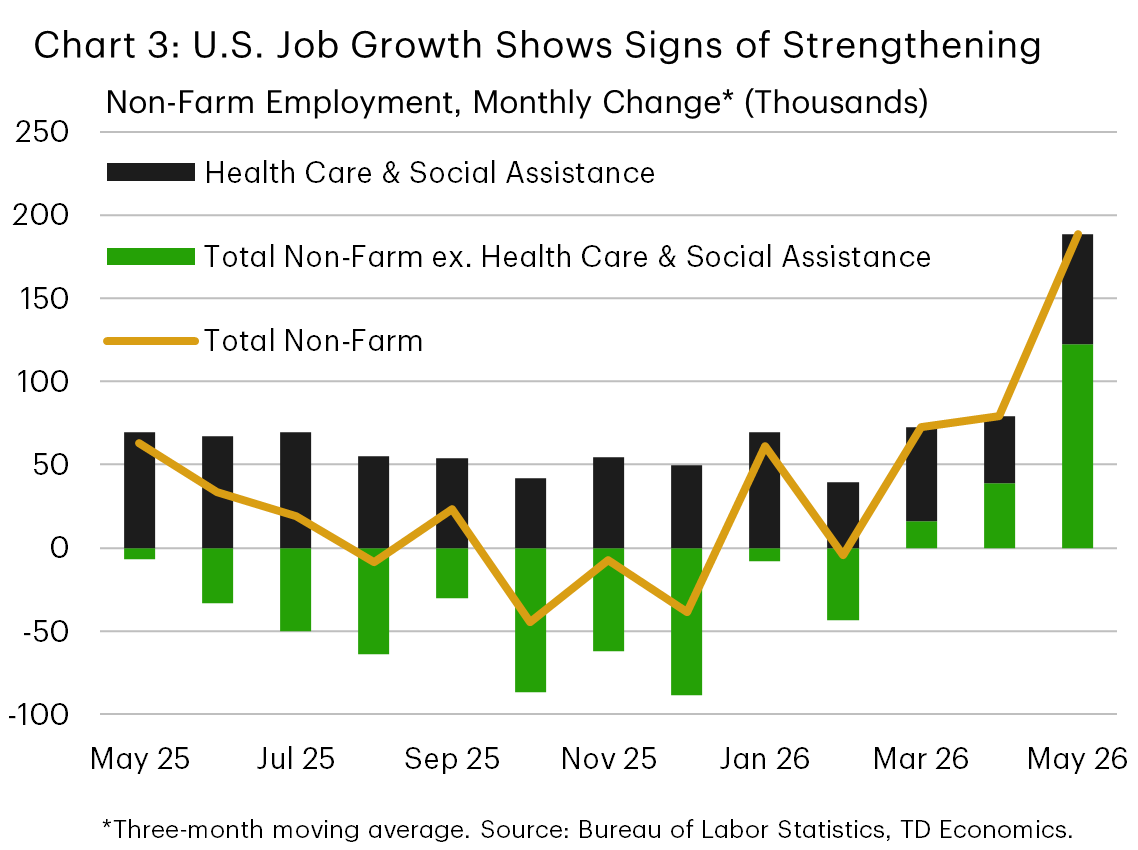
Fortunately, the labor market has been providing sturdier support for consumers. Job growth has averaged 188k per-month in the three months ending in May, well above the economy’s breakeven rate and three-times stronger than the pace measured over the same period the year-prior (Chart 3). Hiring has also broadened beyond healthcare & social services, with cyclical sectors like manufacturing, construction and leisure & hospitality all showing improvement relative to late-2025.
Interestingly, the pick-up in employment hasn’t occurred because of a sudden increase in labor demand, suggesting employers are playing catch-up after hitting pause last year. More certainty on the trade front has likely been a contributing factor, despite ongoing shifts in tariff policies. The administration recently announced new Section 301 tariffs on forced labor violations, which are set to come into effect in late July. These would apply to 60 countries and range from 10%-12.5% and would effectively replace the temporary Section 122 tariffs that replaced the IEEPA tariffs back in February. But what matters to businesses is that peak uncertainty is in the rear-view mirror and that the overall effective tariff rate will hold largely unchanged at around 10%.
From an inflation standpoint, the worst of the tariff effect on prices has already occurred. However, a new force related to the repricing of software, likely due to the incorporation of generative AI, is creating a fresh inflation impulse that’s helping to keep core goods prices elevated. At the same time, second round price effects from higher energy costs are already starting to surface in things like airfares and are likely to broaden to other categories in the months ahead. So, with inflation drifting further from target and the labor market no longer flashing yellow, the justification for additional rate cuts this year has evaporated.
At his first press conference as Fed Chair, Kevin Warsh did not mince words. He clearly signalled that the number one objective was to maintain stable prices, and that the last five years were not a model of success to that goal. The hawkish tone complimented the FOMC dot plot that removed an easing bias alongside a much shorter statement that provided no forward guidance other than the commitment to price stability. More difficult to answer is whether the current policy setting, at 3.75%, is the new neutral for the U.S. economy. We maintain our doubts. Rate cuts shouldn’t be completely off the table in 2027, but it requires leaping over a convincing bar that inflation has stabilized with a two-handle.
For any media enquiries please contact Oriana Kobelak at 416-982-8061
Disclaimer
This report is provided by TD Economics. It is for informational and educational purposes only as of the date of writing, and may not be appropriate for other purposes. The views and opinions expressed may change at any time based on market or other conditions and may not come to pass. This material is not intended to be relied upon as investment advice or recommendations, does not constitute a solicitation to buy or sell securities and should not be considered specific legal, investment or tax advice. The report does not provide material information about the business and affairs of TD Bank Group and the members of TD Economics are not spokespersons for TD Bank Group with respect to its business and affairs. The information contained in this report has been drawn from sources believed to be reliable, but is not guaranteed to be accurate or complete. This report contains economic analysis and views, including about future economic and financial markets performance. These are based on certain assumptions and other factors, and are subject to inherent risks and uncertainties. The actual outcome may be materially different. The Toronto-Dominion Bank and its affiliates and related entities that comprise the TD Bank Group are not liable for any errors or omissions in the information, analysis or views contained in this report, or for any loss or damage suffered.