Clipped Wings: Impact of Reduced Tourism on the U.S. Economy
Ksenia Bushmeneva, Economist | 416-308-7392
Date Published: May 12, 2025
- Category:
- U.S.
- Commodities & Industry
Highlights
- Policy shifts in Washington appear to be taking a toll on the U.S. travel industry. The industry enjoyed rapid growth during the post-pandemic recovery, but will face significant headwinds this year with both international and domestic travel showing signs of strain.
- International arrivals were down across the board in March, as trade tensions and stricter border policies prompted travelers to cancel or postpone travel to the U.S. A drop in international arrivals will be felt in states most popular with overseas visitors, such as New York, Florida, California, Nevada and Texas.
- Domestic tourism is also under pressure amid rising economic uncertainty. Business and government travel have also declined due to cost-cutting and increased uncertainty.
- The tourism sector may offer limited economic support in the near term. The ripple effects of reduced travel will be far-reaching threatening jobs across hospitality, retail, air travel, and education sectors (due to fewer international students), but also weighing on hotel and government revenues.
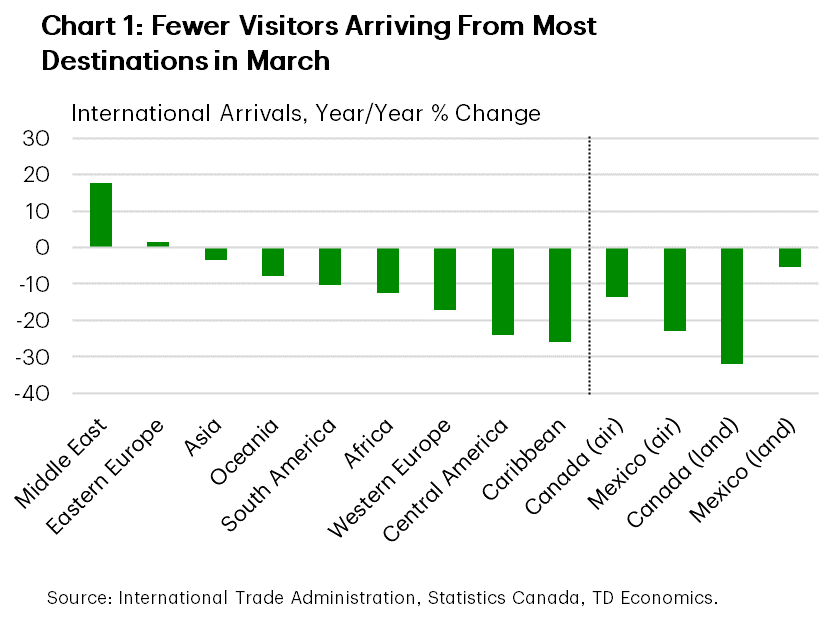
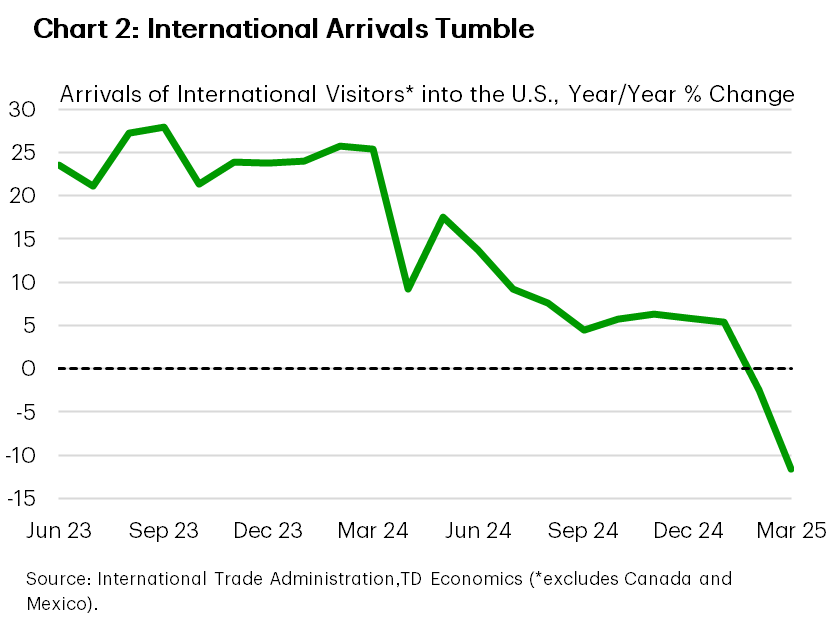
The dramatic policy shifts by the new adminsitration in Washington appear to be having a notable impact on travel. Both domestic and international travel are showing signs of strain. Evolving U.S. policies and stricter border security have prompted travelers to cancel or delay their trips, with overseas arrivals to the U.S. were down by about 12% year-over-year in March, with reductions observed across most regions (Charts 1-2).
This weakness comes just ahead of the busy summer travel season. While domestic travel has held up better, consumer intentions and spending are also beginning to soften, further darkening the outlook for the travel sector. This is likely to weigh on economic growth this year, as the travel and tourism industry contributes around 3% to GDP and accounts for roughly 4% of overall employment. As a labor-intensive sector, it is a powerful engine for job creation—last year alone, leisure and hospitality accounted for 16% of all private sector new jobs.
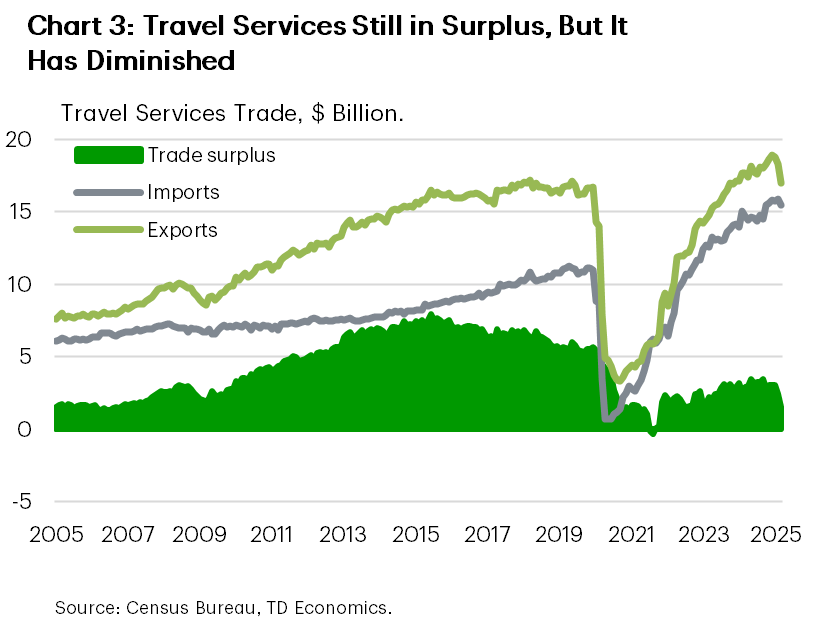
While domestic travel generates the bulk of economic activity, international tourism remains a vital component, especially for certain state and local economies. In 2024, international visitors spent $286 billion in the U.S.—about the same amount as Americans spent on used cars. International travel is classified as a services export, and travel services exports comprise 19% of total U.S. services exports, the second-largest category. Historically, travel has run a large trade surplus, with foreign visitors spending more in the U.S. than Americans spent abroad, providing a meaningful boost to the national trade balance (Chart 3).
Lasting Pandemic Scars and Geopolitics Reshape U.S. Travel Flows
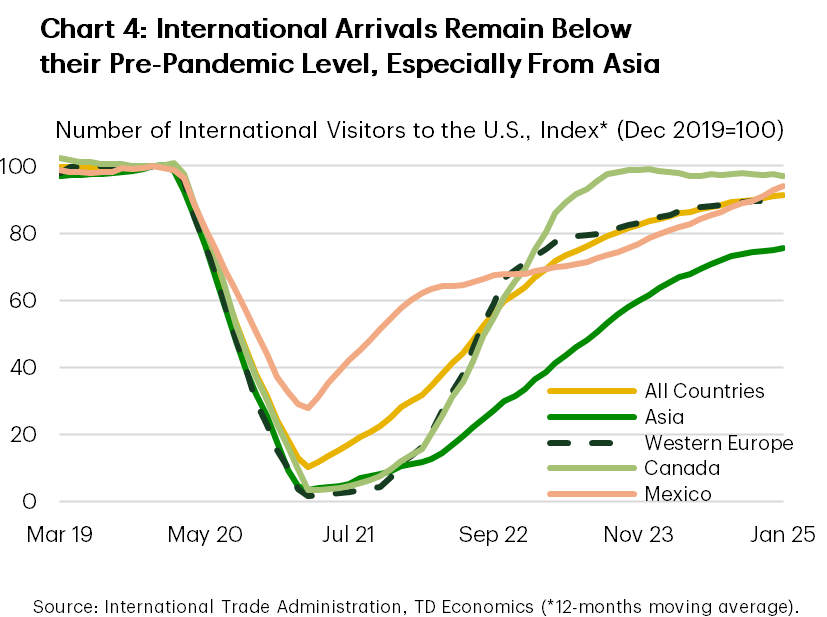
One reason the U.S. travel trade surplus remains below pre-pandemic levels is that inbound international travel – travel exports – has yet to fully recover. Despite notable gains, total international arrivals in 2024 were still about 9% below 2019 levels.
Excluding Canada, arrivals from the three other major regions—Western Europe, Asia, and Mexico—also remained below their pre-pandemic benchmarks. The recovery in visitors from Asia, who typically account for about 13% of all international visits to the U.S., has lagged significantly, with arrivals still roughly 25% below 2019 levels (Chart 4). The Covid-19 pandemic severely disrupted flights between the two countries, compounded by limited flight availability. The ongoing war in Ukraine has complicated trans-pacific routes, as China’s use of Russian airspace for U.S.-bound flights has been a contentious issue. While flight availability will improve this year, with Department of Transportation increasing the weekly flights from China to 50 from 35 previously, deterioration in the U.S.-China relationship will likely weight on inbound travel from the region.
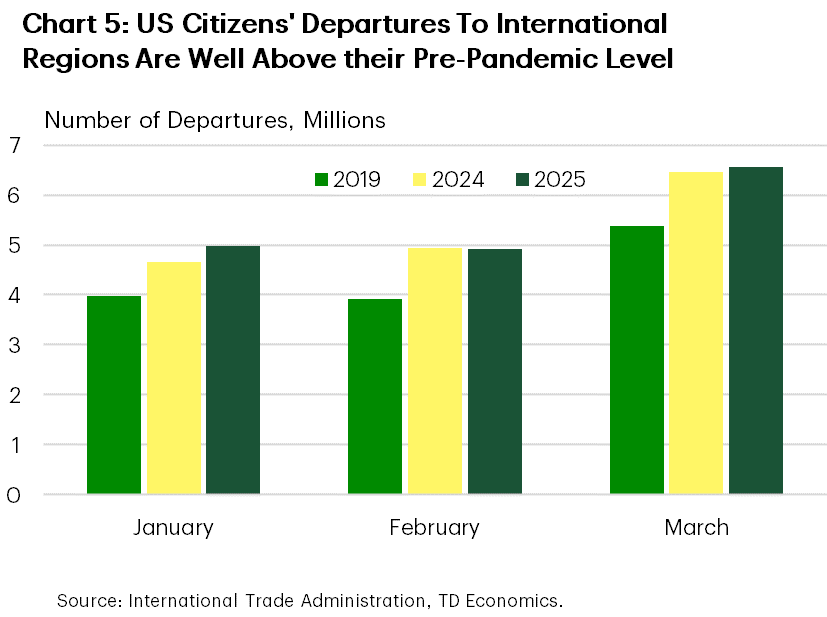
While travel exports have yet to recover, travel imports recovered strongly from the pandemic, with Americans increasingly willing to travel abroad, and boosted by a strong U.S. dollar. At the beginning of the year, departures of U.S. citizens to international destinations were running more than 20% above 2019 levels (Chart 5). Although Americans began to scale back international travel in February and March amid rising trade tensions and economic uncertainty, the decline in inbound travel has been considerably sharper. As a result, after trending lower in both January and February, the travel trade surplus is likely to narrow further in the coming months.
Tariffs Cast a Shadow on Tourism
Even prior to the recent escalation in trade tensions, growth in international arrivals to the U.S. had slowed rapidly last year. This slowdown reflected a broader stabilization in global travel demand following the initial post-pandemic surge, and late cycle dynamics marked by slower economic growth and a strong U.S. dollar. That said, prior to the latest policy developments, year-over-year growth remained positive, and the sector appeared to be on a trajectory to recover and potentially surpass its pre-pandemic levels—an expectation echoed by tourism operators and airline executives1 (Chart 2).
However, intensifying trade and policy frictions between the U.S. and other global partners have disrupted that recovery. Negative sentiment among potential travelers has risen, prompting boycotts and broader hesitancy to visit the U.S. These dynamics have dampened previously optimistic projections for 2025. Heightened border security measures and scrutiny have added to traveler concerns. In March, overseas arrivals were down by about 12% year-over-year, with reductions observed across most regions (Chart 1). A drop in international arrivals will be felt in states most popular with overseas visitors: New York, Florida, California, Nevada and Texas.
In percentage terms, air arrivals from the Caribbean and Central American countries led the declines, followed by Mexico, Western Europe, and Canada. Arrivals from Asia were less affected as of March, but flight cancellations intensified in April alongside rising trade tensions2. The most significant declines were from visitors from Western Europe, which account for about 18% of all international visitors to the U.S., with arrivals down by 190,000 visitors relative to the same period last year. Western Europe is the main source of overseas visitors for New York state.
Cross-Border Chill
Canada and Mexico remain critical sources of inbound travel, together accounting for approximately 50% of total international arrivals. However, both markets saw steep declines in March (Chart 1). Airport arrivals from Canada – the largest source of international travellers to the U.S. – were down 13.5% (a reduction of 112,000 visits). Arrivals from Mexico declined by approximately 69,000. Return trips by car from the U.S. to both countries declined even more dramatically—down by 32% (or 700,000) for trips from Canada and by 870,000 from Mexico. The drop in Canadian tourists will be felt acutely in states that are most frequently visited by Canadians by car – Florida, New York, Washington, California and Michigan. Looking ahead, a quick turnaround in Canadian arrivals in time for the summer travel season is unlikely. Future flight bookings from Canada have collapsed, declining by 70% for every month through September.
Cross-border travel is down broadly. Although the drop is more pronounced for inbound trips, outbound car travel by U.S. residents has also declined although to a lesser extent. In March, car trips by U.S. citizens into Canada were down 10.6% year-over-year, although air arrivals posted a modest 1.2% gain. This contraction in cross-border travel by vehicle represents a notable headwind for border communities, which rely heavily on economic activity generated by such flows.
International Visits Matter, but Domestic Travel Is King
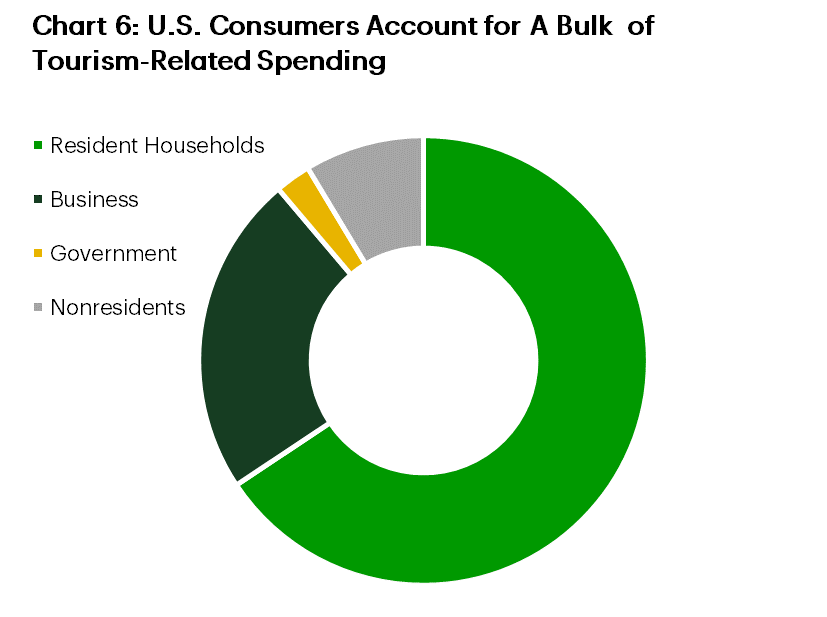

While international travel plays a vital role in supporting the U.S. services sector and sustaining jobs across transportation, retail, and hospitality, domestic travel remains the foundation of the tourism sector. Non-residents account for about 10% of tourism-related spending, while U.S. households make up roughly two-thirds (Chart 6). The remainder is composed of business and government-related travel.
On that front, recent developments have not been reassuring. Even as the labor market and incomes have so far held up, rising economic uncertainty, and increased financial market volatility have rattled consumer confidence. As a result, households have scaled back their vacation plans, including plans for domestic travel (Chart 7). Internal spending data from Bank of America is already showing a decline in travel-related expenditures —particularly lodging, attractions, and airline spending. The pullback is seen across all income groups, although less so for the high-income consumers, signaling a broader softening in discretionary tourism demand3. Some substitution between goods and services may also be taking place. The threat of tariff-driven price hikes on goods like vehicles is leading households to prioritize those goods purchases, with vehicle sales surging in both March and April. With more income going toward spending on large-ticket items, like electronics and cars, spending on expensive experiences, like travel, may be pushed to the wayside.
Business and government travel has also weakened recently. Airlines have reported about 50% drop in government travel due to DOGE cuts and non-essential travel restrictions, with cost cutting also impacting government contractors, while business travel has been scaled back due to tariff-related economic uncertainty4. All in all, while domestic travel may not be down as much as international, it has not escaped unscathed.
Bottom Line
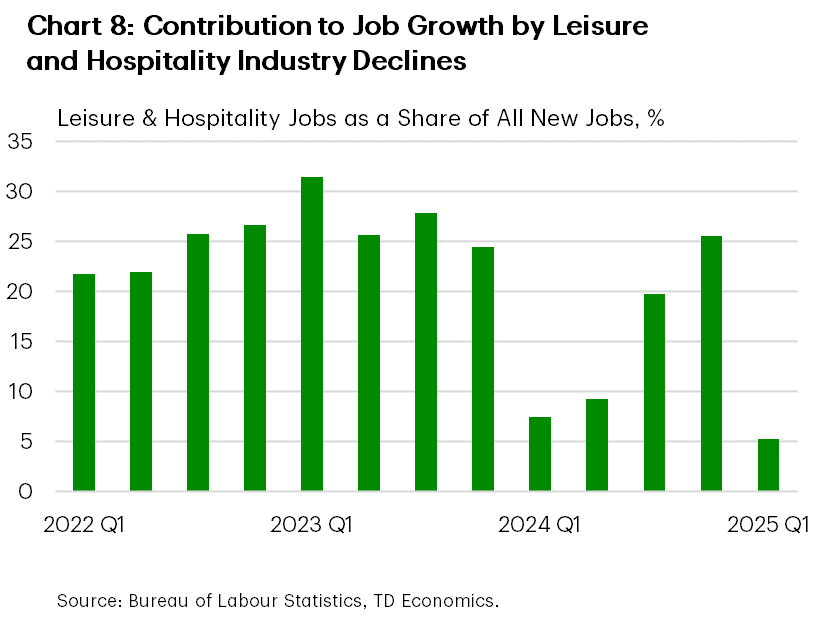
Absent a meaningful rebound in international arrivals or a pickup in domestic travel momentum, the tourism sector may offer limited economic support in the near term. The ripple effects of reduced travel are far-reaching. Fewer international visitors impact not only the trade balance and economic growth but also threaten jobs across hospitality, retail, air travel, and education (due to fewer international students). It also weighs on government revenues via sales taxes and commercial real estate—such as hotels and short-term rentals bookings. Already in the first quarter of this year, the leisure and hospitality sector’s contribution to overall job growth was the smallest since the post-pandemic recovery began (Chart 8), indicating a diminished role in job creation going forward. Forward looking indicators point to weakness ahead. Hotel bookings have fallen 7.8% relative to a year ago, with a 13% decline in New York City5.
The same trend applies to the sector’s impact on the trade balance and broader economic growth. So far, the decline in U.S.-bound international travel has been steeper than the drop in outbound travel by American households, suggesting a smaller travel services trade surplus than last year, and less support to the overall services surplus.
Nevertheless, domestic travelers remain vital to the health of the tourism sector. While travel spending has moderated, it hasn’t collapsed, supported by ongoing job growth and rising household incomes. Although consumer confidence has weakened due to concerns about the future, the present situation component—which is more closely linked to spending—has remained more stable. This suggests that while Americans are more pessimistic about future travel plans, they continue to spend, even if at a slower pace. Should trade tensions ease, international travel may rebound somewhat. However, much like the lingering effects of the pandemic, the scars from the trade war may take time to heal.
End Notes
- New York Times: https://www.nytimes.com/2025/01/11/business/airlines-delta-profits.html#:~:text=The%20positive%20outlook%20for%202025,better%20seats%20and%20international%20flights.
- https://www.scmp.com/economy/global-economy/article/3308530/chinese-flight-bookings-us-summer-decline-tariff-war-adds-fuel-fire
- https://institute.bankofamerica.com/content/dam/economic-insights/domestic-tourism.pdf
- https://www.businesstravelnews.com/Transportation/Air/Shift-in-Confidence-Contributes-to-Downgraded-Q1-Airline-Forecasts
- https://thebusinesstravelmag.com/data-shows-q1-decline-in-us-hotel-bookings/
Disclaimer
This report is provided by TD Economics. It is for informational and educational purposes only as of the date of writing, and may not be appropriate for other purposes. The views and opinions expressed may change at any time based on market or other conditions and may not come to pass. This material is not intended to be relied upon as investment advice or recommendations, does not constitute a solicitation to buy or sell securities and should not be considered specific legal, investment or tax advice. The report does not provide material information about the business and affairs of TD Bank Group and the members of TD Economics are not spokespersons for TD Bank Group with respect to its business and affairs. The information contained in this report has been drawn from sources believed to be reliable, but is not guaranteed to be accurate or complete. This report contains economic analysis and views, including about future economic and financial markets performance. These are based on certain assumptions and other factors, and are subject to inherent risks and uncertainties. The actual outcome may be materially different. The Toronto-Dominion Bank and its affiliates and related entities that comprise the TD Bank Group are not liable for any errors or omissions in the information, analysis or views contained in this report, or for any loss or damage suffered.
Download
Share: