The Weekly Bottom Line
Our summary of recent economic events and what to expect in the weeks ahead.
Date Published: July 17, 2026
- Category:
- U.S.
Highlights
- Tensions in the Middle East continued to escalate this week, pushing WTI prices back above $80 per-barrel.
- Inflation pressures cooled more than expected in June. Though the recent U-turn in oil prices raises concerns over the durability of the disinflationary dynamics.
- Retail sales remained decently strong in June, suggesting consumer spending regained some momentum in Q2 after stalling in Q1.
Cooler Inflation Quiets Calls for a July Hike
Despite a relatively busy week on the economic data calendar, market attention remained focused on renewed tensions in the Middle East. Earlier in the week, Iranian forces attacked multiple oil vessels transiting the Strait of Hormuz, prompting the U.S. to resume strikes on various military targets across Iran and reimpose its naval blockade. Tanker traffic through the vital passageway has again come to a halt, pushing WTI prices back above $80 per barrel.
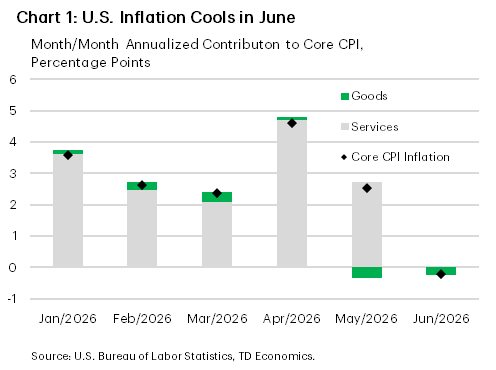
The renewed upward pressure on oil prices helped to temper the market response to an otherwise very encouraging inflation report. Headline CPI declined by 0.4% m/m in June – it’s first pullback since June 2024 and largest since April 2020 – pushing the 12-month change down to 3.5% (see commentary). A sharp drop in gasoline prices was largely responsible for last month’s decline, though even after removing these effects there were plenty of positive developments. Core inflation was flat for the month, as both goods and services were little changed (Chart 1). Importantly, many of the categories where tariffs had been adding to price pressures over the past year, including appliances, medical goods and apparel were all lower on the month – suggesting the worst of the tariff passthrough is now in the rearview mirror. Also encouraging was the fact that there was little evidence of higher energy prices bleeding into core inflation.

The disinflationary dynamics were further reinforced by a soft producer price index reading, which helped to remove speculation of a Fed rate hike later this month. That said, Fed futures are still priced for a little more than one rate hike by year-end, as the U-turn in oil prices is already raising concerns on the durability of the disinflationary dynamics.
Retail sales for the month of June provided further confirmation that households continue to shrug off the effects of higher energy prices (Chart 2). While the headline figure posted only a modest gain, that was partly related to a sharp drop in nominal sales at gasoline stations –owing to price effects (see commentary). Focusing on the control group, which removes volatile categories, it showed a much healthier gain in spending while revisions to the prior month were a bit higher. This reinforces the view that consumer spending regained some momentum in Q2, after sputtering in Q1. However, the spend dynamics remain K-shaped, with lower-and-middle income consumers increasingly price sensitive and hesitant to spend on discretionary items – something that was highlighted in this week’s Fed Beige Book.
Anyone hoping that Fed Chair Warsh would relent and provide some forward guidance during his first Congressional testimony this week was sorrily disappointed. Instead, Warsh restated the Committee’s unwavering commitment to return price stability, but provided no hints on the Fed’s next move. Several other policymakers spoke this week and perhaps the biggest takeaway is that while all were encouraged by last month’s softer inflation figures, one data point does not make a trend. Several more months of easing inflation will be required to convince officials that price pressures are moving in the right direction. If this were to occur, expectations for rate hikes should fade, leading to some downward pressure on yields.
Disclaimer
This report is provided by TD Economics. It is for informational and educational purposes only as of the date of writing, and may not be appropriate for other purposes. The views and opinions expressed may change at any time based on market or other conditions and may not come to pass. This material is not intended to be relied upon as investment advice or recommendations, does not constitute a solicitation to buy or sell securities and should not be considered specific legal, investment or tax advice. The report does not provide material information about the business and affairs of TD Bank Group and the members of TD Economics are not spokespersons for TD Bank Group with respect to its business and affairs. The information contained in this report has been drawn from sources believed to be reliable, but is not guaranteed to be accurate or complete. This report contains economic analysis and views, including about future economic and financial markets performance. These are based on certain assumptions and other factors, and are subject to inherent risks and uncertainties. The actual outcome may be materially different. The Toronto-Dominion Bank and its affiliates and related entities that comprise the TD Bank Group are not liable for any errors or omissions in the information, analysis or views contained in this report, or for any loss or damage suffered.
Download
Share: