Weathering the Storm – the Next Phase of America’s Cost of Housing Crisis
Francis Fong, Managing Director & Senior Economist | 416-983-9309
Mekdes Gebreselassie, Economic Analyst
Date Published: June 23, 2025
- Category:
- U.S.
- Future Ready Economy
Highlights
- A rise in extreme weather events places more Americans at risk of financial difficulty.
- 19% of U.S. counties, representing more than a quarter of the nation’s population, will have significant exposure to flood and wildfire risks by 2052 amidst already highly unaffordable housing.
- Adaptation measures and supports to those most in need are notable policy considerations. Immediate actions include increased supply of climate-resilient housing, adaptation-related infrastructure, and adjustments to the insurance landscape. Long term, success still requires mitigating future disasters.
- President Trump has made resolving the housing crisis a key priority of his administration, creating a joint task force to release federal lands for housing development. A small percentage of this land could create 3 million new homes. But success requires consideration of whether those new homes would also be vulnerable to extreme weather.
The past year was marked by some of the worst extreme weather events on record in U.S. history. Hurricane Helene was the seventh most costly Atlantic hurricane – with a death toll of over 219 people and a financial cost of $78.7 billion. It was followed within less than two weeks by Hurricane Milton, which resulted in the death of at least 32 people and costs totaling $34.3 billion.1 Two record wildfire events were also recorded last year. One is the Smokehouse Creek wildfire, largest fire recorded in Texas, which was in fact started by a downed powerline and fueled by dry weather conditions.2 This highlights the heightened importance of maintaining electricity infrastructure as the frequency and reach of dry weather increases. The other is the Park Fire in California, which is no stranger to wildfires, and was the fourth largest incident in the state’s history.3
Many already struggling with high housing costs are caught in the crosshairs of growing climate-related disasters. Based on 30-year data projections4, we find that 19% of U.S. counties, with over a quarter of the country’s population, are significantly exposed to flood and wildfire risks that will exacerbate the cost of housing crisis.
The rising trend of climate-related extreme weather events
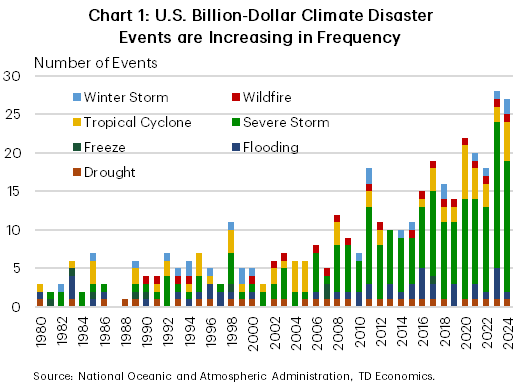
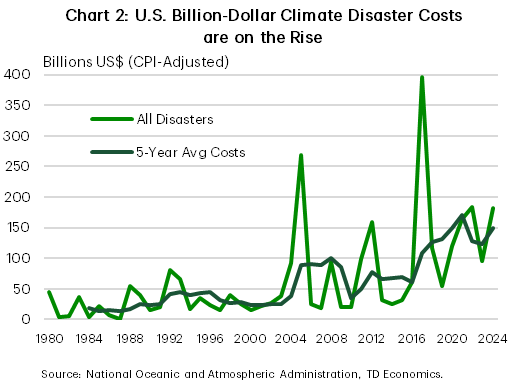
Last year’s disastrous events are part of a larger shift in extreme weather events over the last several decades. The National Oceanic and Atmospheric Administration (NOAA) recorded nearly a six-fold increase in both the frequency and the total billion-dollar cost from climate-related disasters over 2015-2024 relative to 1980-1989. In the last decade, there have been 190 disasters totaling $1.4 trillion in losses compared to 33 with $219.6 billion in losses between 1980-1989 (Charts 1 & 2). In addition to extreme weather, factors behind this rising trend of disastrous events include the increase in population and physical assets in mostly vulnerable regions such as coasts and the wildland-urban interface.5 Unfortunately, this trend is expected to continue rising, even under conservative scenarios.
Climate-related extreme weather events are intensifying and expanding their reach inland. Hurricane Helene is a recent example. After its landfall in northwestern Florida, it moved further to Tennessee, Georgia, and North Carolina and brought torrential rains to parts of South Carolina and Virginia. Many inland communities impacted by Helene were without flood insurance, perhaps due to a lack of awareness that the standard home insurance excludes flood coverage, while also discounting their flood risk. Indeed, several impacted properties lay outside the Federal Emergency Management Agency (FEMA) designated high flood risk areas and would not have been required to obtain flood insurance coverage prior to acquiring a mortgage – FEMA flood maps tend to focus on river and coastal floods over extreme rainfall.6
According to the First Street Foundation (FSF), FEMA flood maps underestimate the current extent of national flood risk. FEMA classifies 8.7 million properties within Special Flood Hazard Areas, with at least 1% annual flood risk, while FSF identifies 70% more. This leaves nearly 6 million households and property owners with underestimated risk, as of 2020, mainly due to outdated and unmapped areas by FEMA. Moreover, FSF’s flood risk model shows that the number of properties exposed to any level of flood risk across the contiguous United States in the next thirty years (from 2020) will increase by 7.8% to 23.5 million, or one-in-six properties. Meanwhile, those at substantial risk, a more stringent measure of 1% annual risk of flood, are projected to increase by 11% to 16.2 million or one-in-nine of all properties.7
A more recent FSF projection also finds exposure to wildfire risk is on the rise – 15.4 million properties, or one-in-nine, are projected to be at major risk of greater than 6%, cumulatively, over the next thirty years (2023-2053).8 And there is a roughly 11% growth in the number of properties exposed to some level of wildfire risk from 72 million in 2022 to 80 million in 2050.9 The expansion of dwellings close to forested areas and inadequate fire-resistance measures, compounded by long drought episodes, are highlighted factors in the rising trend of wildfire damages. The disastrous L.A. fires that marked the start of 2025 come to mind.
Housing affordability reaches historical lows
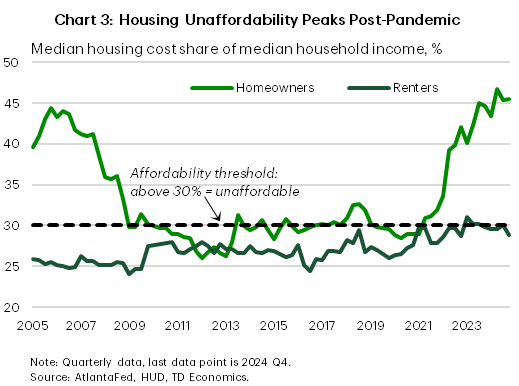
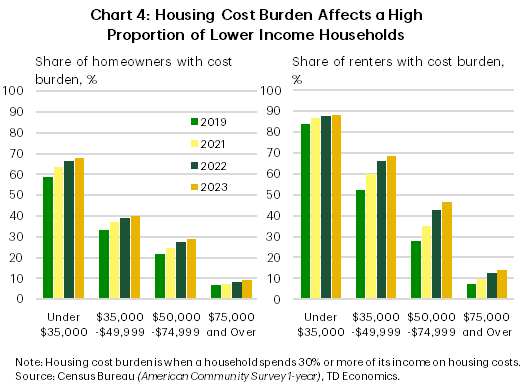
Natural disasters are a threat to all, but financially stressed households are generally more vulnerable. Housing unaffordability in the U.S. has trended upwards in the past decade and reached historical highs in the years after the COVID-19 pandemic (Chart 3). In 2023, 32 percent of households (42 million) spent 30 percent or more of their income on housing, which was up from 30 percent (36 million) in 2019.10 Most of these households, 84 percent in 2023, earned less than $75,000, and are especially strained by the housing crisis relative to higher income households (Chart 4).
The financial limitations of lower- and middle- income families restrict their ability to implement preventative measures such as retrofits, keep up with rising insurance premiums, and recover from disasters. Making a home disaster-resistant can be expensive. For example, costs for elevating homes in flood prone areas can range from $10,000 to $400,000, possibly reaching over $1 million for large houses.11,12 Retrofitting costs for wildfire resistance are relatively low in most cases, $2,000 to $15,000, though they could reach up to $100,000 in extensive cases.13 Insurance premiums have risen in tandem with extreme weather events, reflecting 7-8% of mortgage costs in 2013 to 20% in 2022.14 And private home insurance providers are limiting coverage in high-risk jurisdictions with some exiting states altogether, as in California and Florida.15 As for recovery, there is government support in the aftermath of disasters but rebuilding or relocating to low-risk areas often requires more funds. In short, lower- and middle- income households at risk of extreme weather have limited options to mitigate associated costs.
Where climate risk meets unaffordable housing
Often, jurisdictions facing relatively high risks of extreme weather are also the ones grappling with housing cost challenges. Based on our calculations, 19% of U.S. counties currently exposed to significant levels of unaffordable housing will be significantly exposed to flood and wildfire risks by 2052.
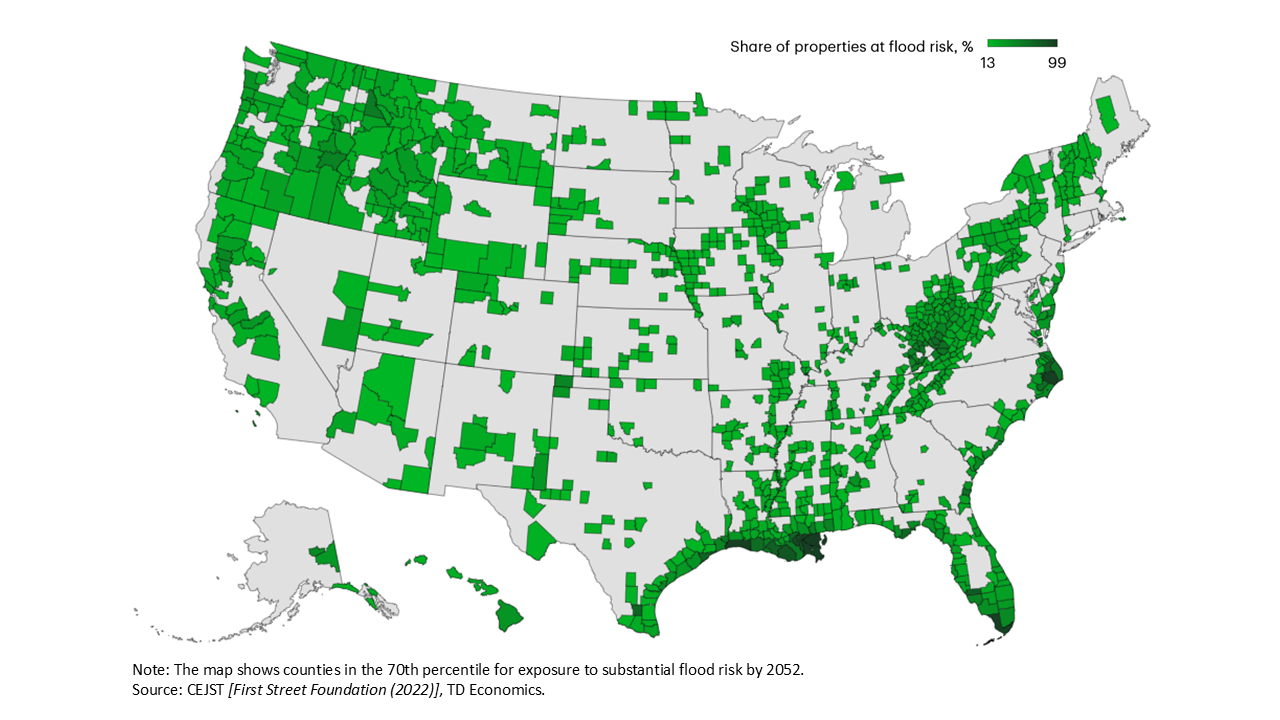
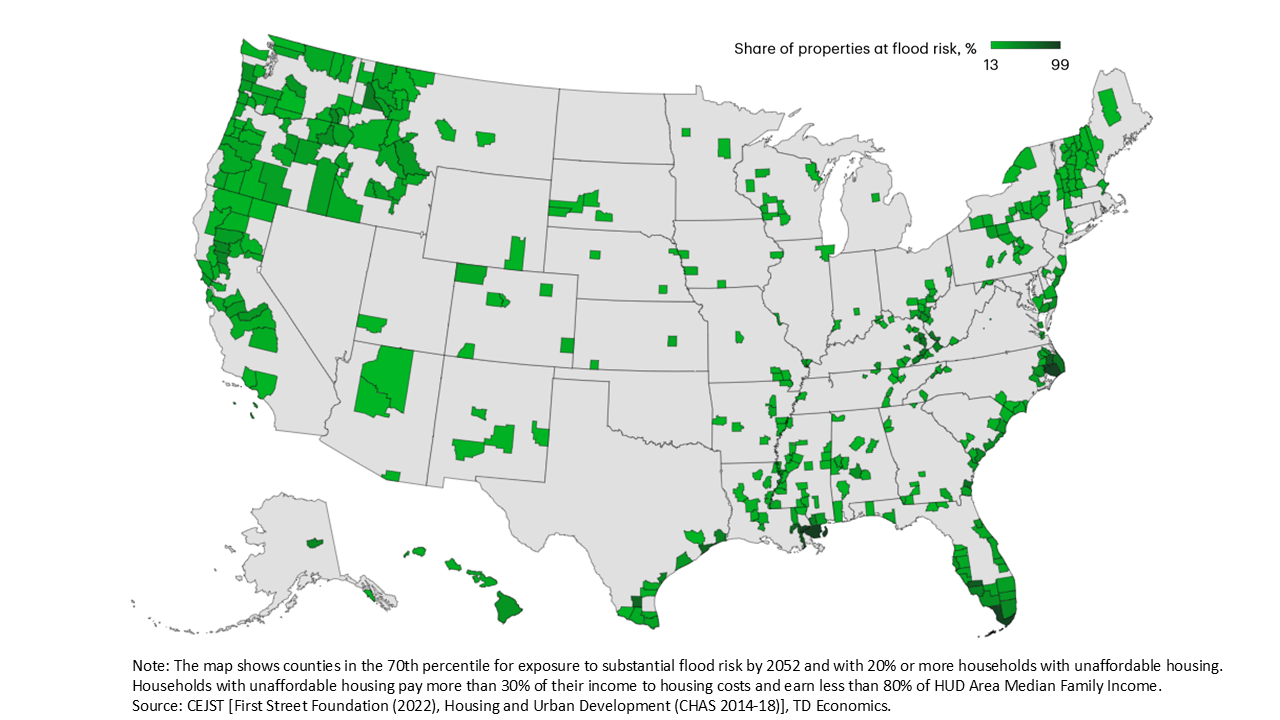
Our analysis takes the top thirty percent share of U.S. counties by flood exposure. These counties have 13% or more of properties at substantial flood risk over 2022-2052 and represent 26 percent of U.S. population. Geographically, flood prone counties are concentrated in the northwest and Appalachian regions with mountainous terrain as well as coastal regions (Map 1a). Out of the top thirty percent most exposed to projected flood risk, forty percent are currently exposed to significant levels of unaffordable housing (Map 1b). These counties where both projected flood risk and unaffordable housing are relatively high are home to roughly 7.0 million families with unaffordable housing.
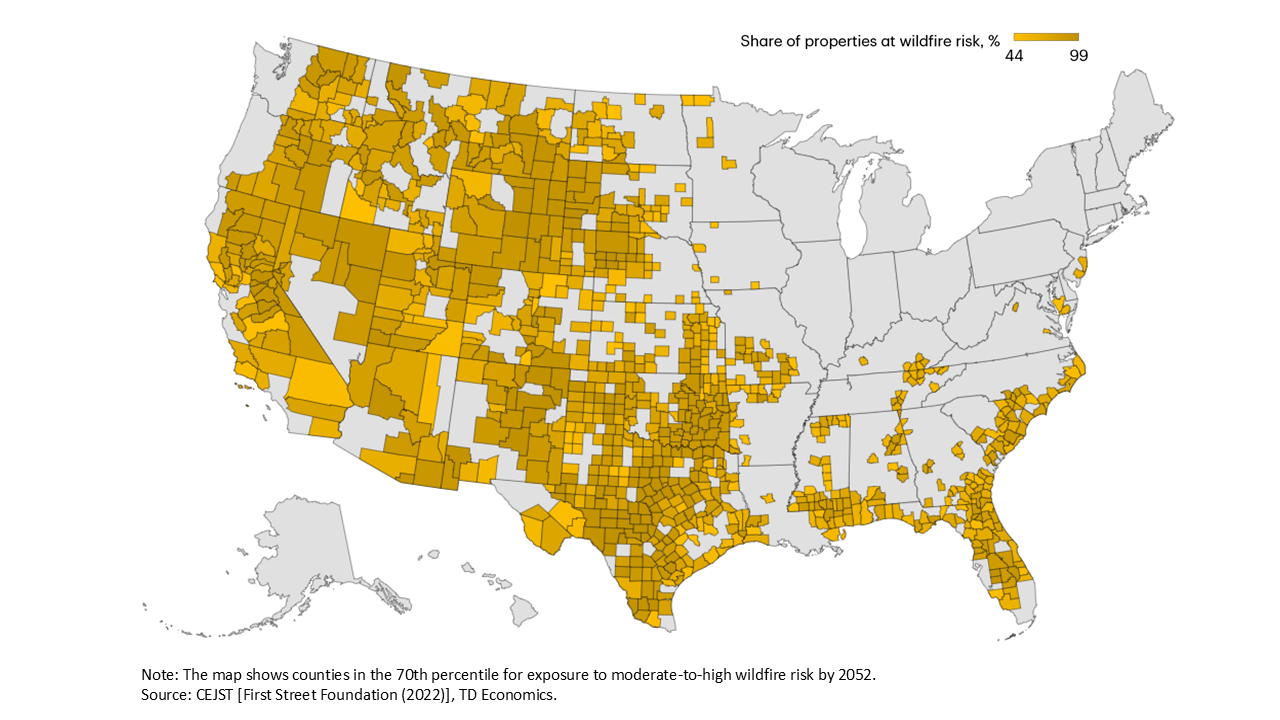
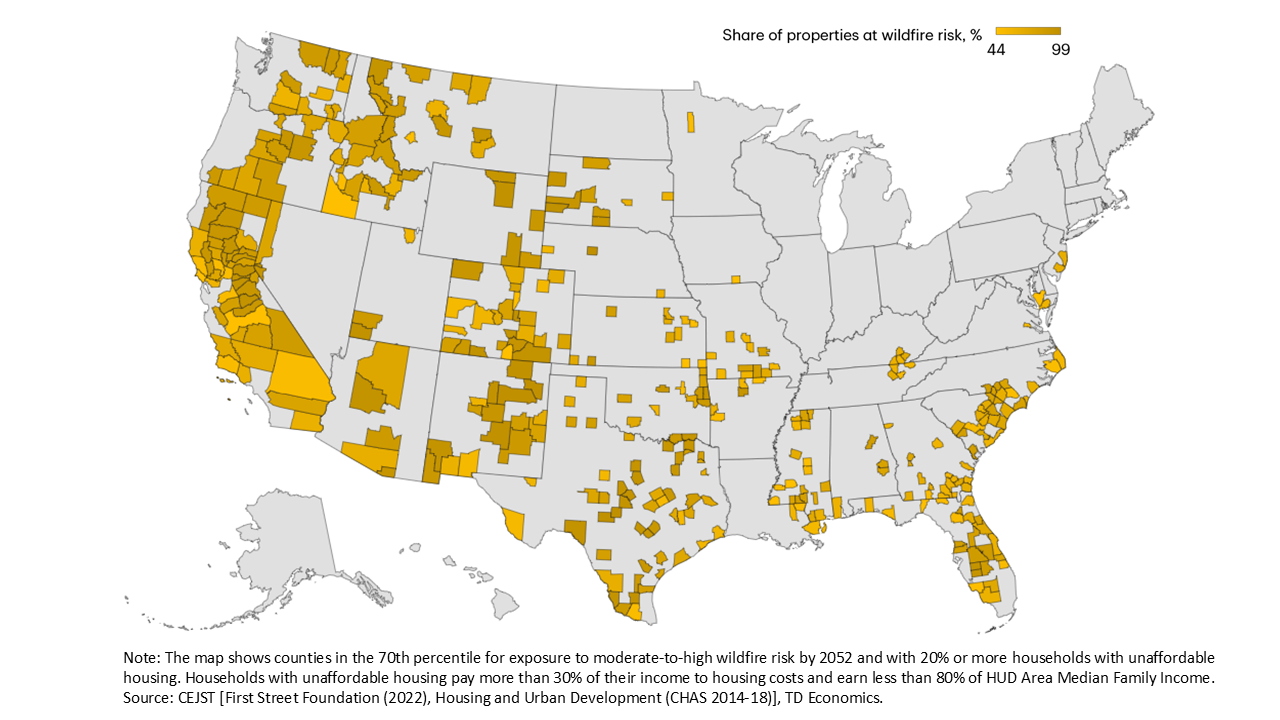
We repeat a similar exercise for U.S. counties by wildfire exposure. Out of counties in the top thirty percent by exposure to wildfire, thirty nine percent are exposed to significant levels of unaffordable housing (Map 2b). And an estimated 4.2 million families with unaffordable housing live in these counties at the intersection of projected wildfire risk and unaffordable housing. Most wildfire prone regions are arid areas in the western part of the country with some concentration in the southeast (Map 2a).
Included in the estimates above, ten percent of U.S counties, representing 7 percent of the population, are significantly exposed to both flood and wildfire projected risks and forty four percent of those are exposed to unaffordable housing.
All in all, 599 counties (out of a total 3,143) accounting for more than a quarter of the nation’s population are significantly exposed to either flood or wildfire or both within thirty-years, while facing significant levels of unaffordable housing. Around 9.6 million families coping with high housing costs reside in these counties. This goes to show the extensive reach extreme weather events are having on American families currently unequipped to deal with them. Rising home insurance premiums; lack of coverage in some areas; retrofit costs, such as raising homes in flood prone regions; and high restoration/relocation costs make situations worse for the financially constrained.
Trump Administration Looking to Public Lands to solve the Housing Crisis
As part of President Trump’s day-one executive order targeting the cost of living, the administration specifically cited the cost of housing and expanding supply as a key priority. Trump had also made housing a priority during his first administration when he issued several directives to eliminate red tape related to homebuilding.
This time around, the administration convened a joint task force between the Department of the Interior and the Department of Housing and Urban Development (HUD) to make federal lands available for housing development. The majority of public lands are national parks, protected wildlife refuges, and Native American land held in trust by the Federal government, with most in the western half of the U.S. However, a Wall Street Journal analysis identified that 7.3% of federal lands do fall within metro areas in need of more low-cost housing, particularly, land held by the Bureau of Land Management in high-demand states like Nevada, California, Utah and Arizona.16 According to the American Enterprise Institute (AEI), developing 0.3% of land held, or about 513,000 acres, across the contiguous states could yield 3 million new homes.17 Moreover, the joint task force will focus on expanding the housing supply in overlooked rural areas and tribal communities.18
In fact, this policy is very popular globally and across the political spectrum. Many advanced economies have similar initiatives in place, including Canada, Australia, New Zealand, the UK, the Netherlands, Belgium, and others, with even the Harris-Walz campaign committing to repurposing federal lands for new housing developments during the 2024 presidential election.
However, there are two key pillars to finding success with this policy:
- How the land is made available matters. The AEI suggests that selling federal lands at market value to private housing developers could raise as much as $100 billion over 10 years. However, this presents a challenge to affordability given that the price of land alone can often be sufficient to price out lower- and middle-income families. In countries such as the UK, the Netherlands and Belgium, governments instead sell surface rights, which are long-term, below-market leases that provide full land rights to a developer or owner, but the land remains public and is returned to the government after the lease ends.
- Federal lands are, unsurprisingly, located in the same areas that suffer from extreme weather risks, particularly wildfire risks. Building on public lands ought to be paired with significant adaptation measures to ensure that these communities are protected from the very issue that this report aims to highlight.
Bottom Line
There is growing evidence that extreme weather events are on the rise and becoming more costly to Americans. This calls for increased adaptation and mitigation efforts. Many financially constrained households in the U.S. are vulnerable to the rising risks of flood and wildfire. In addition to unaffordable housing, these households are now grappling with increasingly frequent severe weather. Moving forward, some notable policy considerations include increasing the supply of climate-resilient housing; adapting the insurance landscape to rising climate risks; and providing effective financial support to those that need it most. Designing models that capture the shifting environmental climate and utilizing them in natural disaster risk mapping is a step in the right direction. Such tools equip households, governments, and the private sector alike to better strategize.
Exhibits
Map 1a: Counties with significant flood risk over
|
Map 1b: Counties with significant flood risk over
|
 |
 |
Map 2a: Counties with significant wildfire risk over
|
Map 2b: Counties with significant wildfire risk over
|
 |
 |
Text Box: Information on the data used in our calculations
CEJST was published on November 22, 2022, and provides data at the consensus tract level which we weight by population to scale up to the country level.
- The population data is from CEJST which obtains it from the American Community Survey (ACS) 2015-2019.
- The climate risk data is from CEJST which obtains it from FSF in 2022. This includes:
- Projected flood exposure, provided as the share of properties exposed to 1% annualized or 26% cumulative flood risk over thirty years.
- Projected wildfire exposure, provided as the share of properties exposed to at least 0.03% annualized or 1% cumulative wildfire risk over thirty years.
- Housing cost data (unaffordable housing) is from CEJST which is provided as the share of households paying greater than 30% of their income to housing costs and earning less than 80% of HUD Area Median Family Income by country. This variable is derived from HUD’s Comprehensive Housing Affordability Strategy (CHAS) 2014-2018 data.
- HUD Area Median Family Income is calculated by HUD for each jurisdiction to determine Fair Market Rents and income limits for HUD programs. It will not necessarily be the same as other calculations of median incomes (such as simple Census number) due to a series of adjustments that are made.19
Household count is separately obtained from the Census Bureau’s ACS 2017-2015. We multiply this by the housing cost data from CEJST to estimate the number of households living in unaffordable housing.
End Notes
- NOAA National Centers for Environmental Information (NCEI), U.S. Billion-Dollar Weather and Climate Disasters (2025)
- NBC News, Broken power pole and downed wires caused largest fire in Texas history, investigator says (March 8, 2024)
- NOAA, Assessing the U.S. Climate in 2024 (January 10, 2025)
- From the 2022 Climate and Economic Justice Screening Tool (CEJST) prepared by the Council on Environmental Quality. CEJST takes flood and wildfire risk data from the First Street Foundation.
- NOAA, 2023: A historic year of U.S. billion-dollar weather and climate disasters (January 8, 2024)
- Bloomberg, Federal Flood Maps Are No Match for Florida’s Double Hurricane (October 9, 2024)
- First Street Foundation, The First National Flood Risk Assessment 2020
- First Street Foundation, First Street Foundation Wildfire Model 2023
- First Street Foundation, Fueling the Flames (May 15, 2022)
- Census Bureau, American Community Survey (ACS) 1-year 2019 and 2023 data
- CNBC, House lifting is big business following a record year of storms (April 19, 2021)
- The New York Times, Flood-Soaked Homeowners Face a Costly Choice: Raise or Raze (December 27, 2024)
- Headwaters Economics, The cost of retrofitting a home for wildfire resistance (June 26, 2024)
- First Street Foundation, Property Prices in Peril (February 3, 2025)
- CNBC, Insurance crisis that started in Florida, California is spreading. Your state could be next (July 2, 2024)
- The Wall Street Journal, Trump Wants to Build Homes on Federal Land. Here’s What That Would Look Like (March 17, 2025)
- AEI Housing Center, Homesteading 2.0: Making housing affordable again by focusing on the construction of starter homes (Mar 20, 2025)
- The Wall Street Journal, Federal Land Can Be Home Sweet Home (March 16, 2025)
- HUD User, Comprehensive Housing Affordability Strategy (CHAS) Background
Disclaimer
This report is provided by TD Economics. It is for informational and educational purposes only as of the date of writing, and may not be appropriate for other purposes. The views and opinions expressed may change at any time based on market or other conditions and may not come to pass. This material is not intended to be relied upon as investment advice or recommendations, does not constitute a solicitation to buy or sell securities and should not be considered specific legal, investment or tax advice. The report does not provide material information about the business and affairs of TD Bank Group and the members of TD Economics are not spokespersons for TD Bank Group with respect to its business and affairs. The information contained in this report has been drawn from sources believed to be reliable, but is not guaranteed to be accurate or complete. This report contains economic analysis and views, including about future economic and financial markets performance. These are based on certain assumptions and other factors, and are subject to inherent risks and uncertainties. The actual outcome may be materially different. The Toronto-Dominion Bank and its affiliates and related entities that comprise the TD Bank Group are not liable for any errors or omissions in the information, analysis or views contained in this report, or for any loss or damage suffered.
Download
Share: