Highlights
President Trump aims to bring manufacturing jobs back to America. To do this, he’s employing several tools, including the widespread use of tariffs. This strategic push raises several questions on the industry’s capacity to absorb more production and expand the labor market, which we explore in this report.Q1. Which industries dominate job growth and how does manufacturing compare?
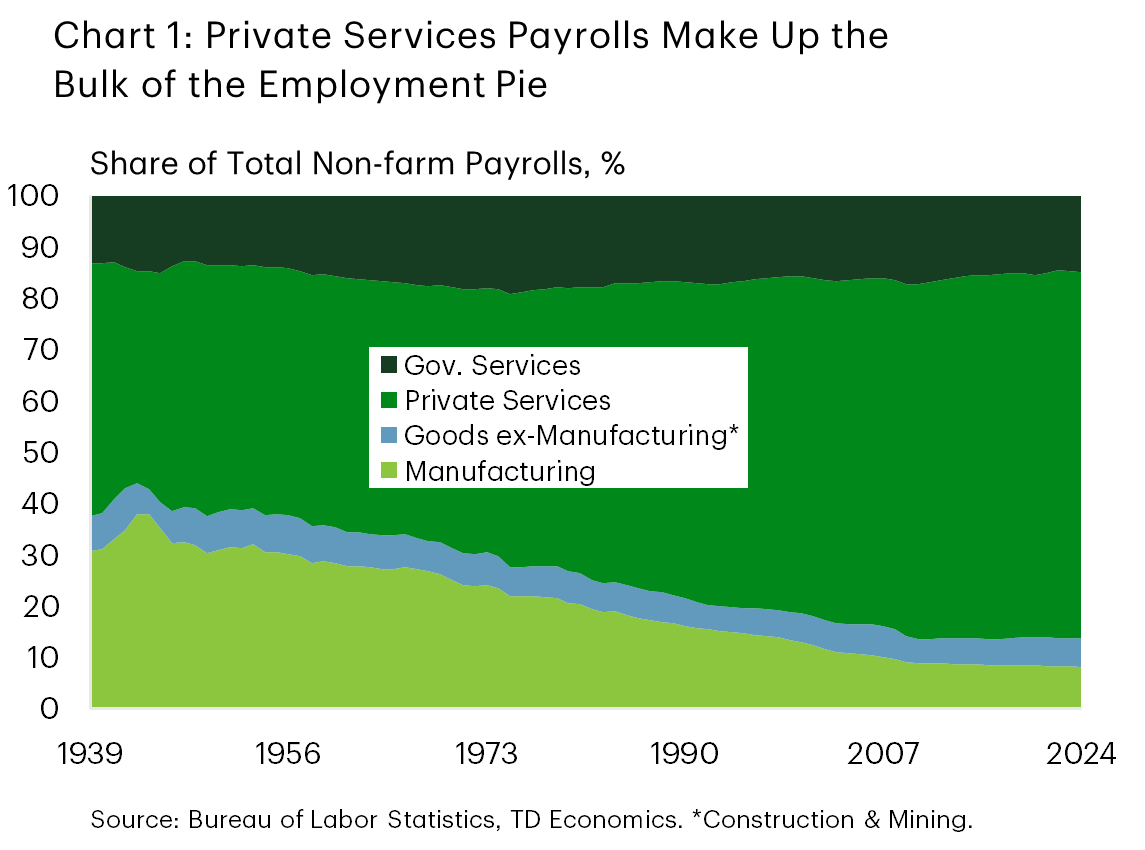
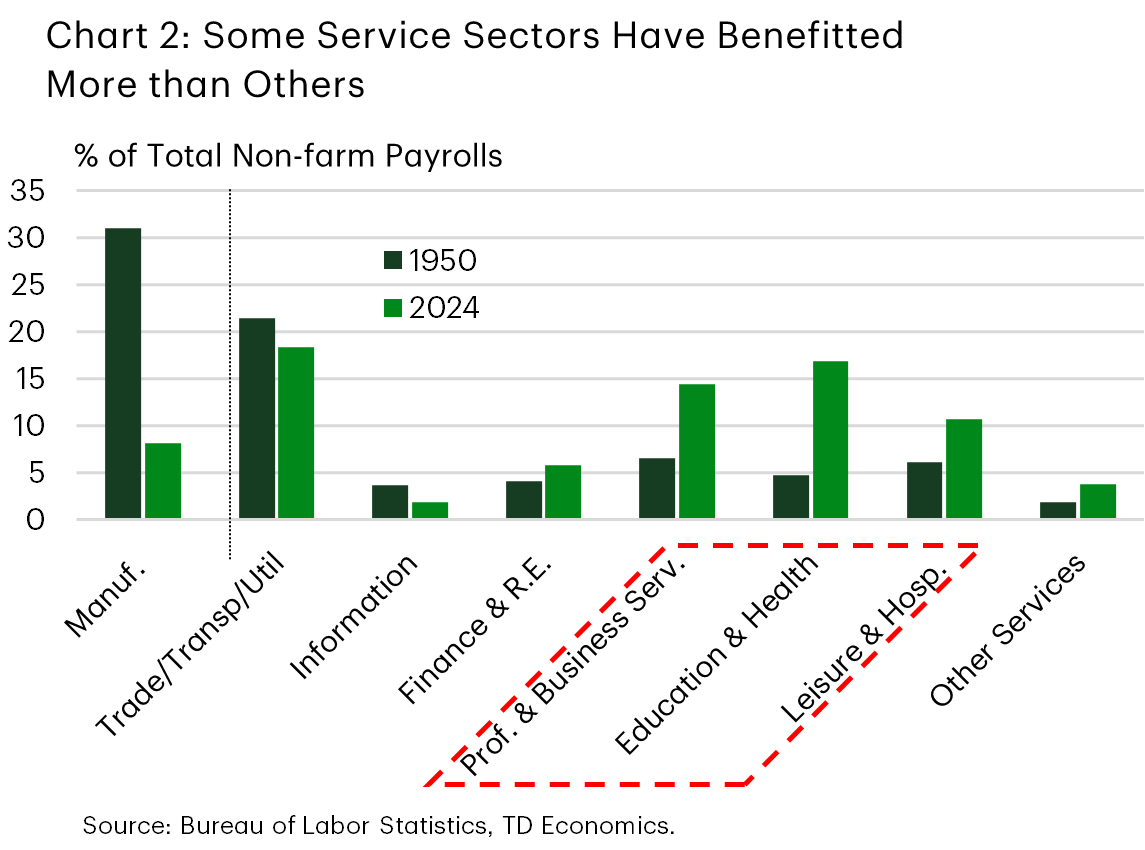
Manufacturing's share of total jobs peaked toward the end of the Second World War at 38% and has since fallen to around 8% over the past decade (Chart 1). The services sector has picked up the slack, growing its share of total jobs by a nearly commensurate 29 percentage points to a little over 86% of total payrolls. High growth areas include healthcare, educational services, professional & business services, along with leisure & hospitality (Chart 2). Zooming in on the last several years, these same industries stand out as having the strongest job gains in the post-GFC period. High employer demand for services-based skills spans the gamut on educational requirements and age. For instance, leisure and hospitality has stronger characteristics towards lower levels of education and younger workers, with a median age of a little over 32. But healthcare, educational services, professional & business services tilt toward higher levels of education, such as a college degree or higher. The bottom line, there's something for everyone within the faster growing service industry.
Q2. Where have manufacturing jobs grown the fastest in recent years?
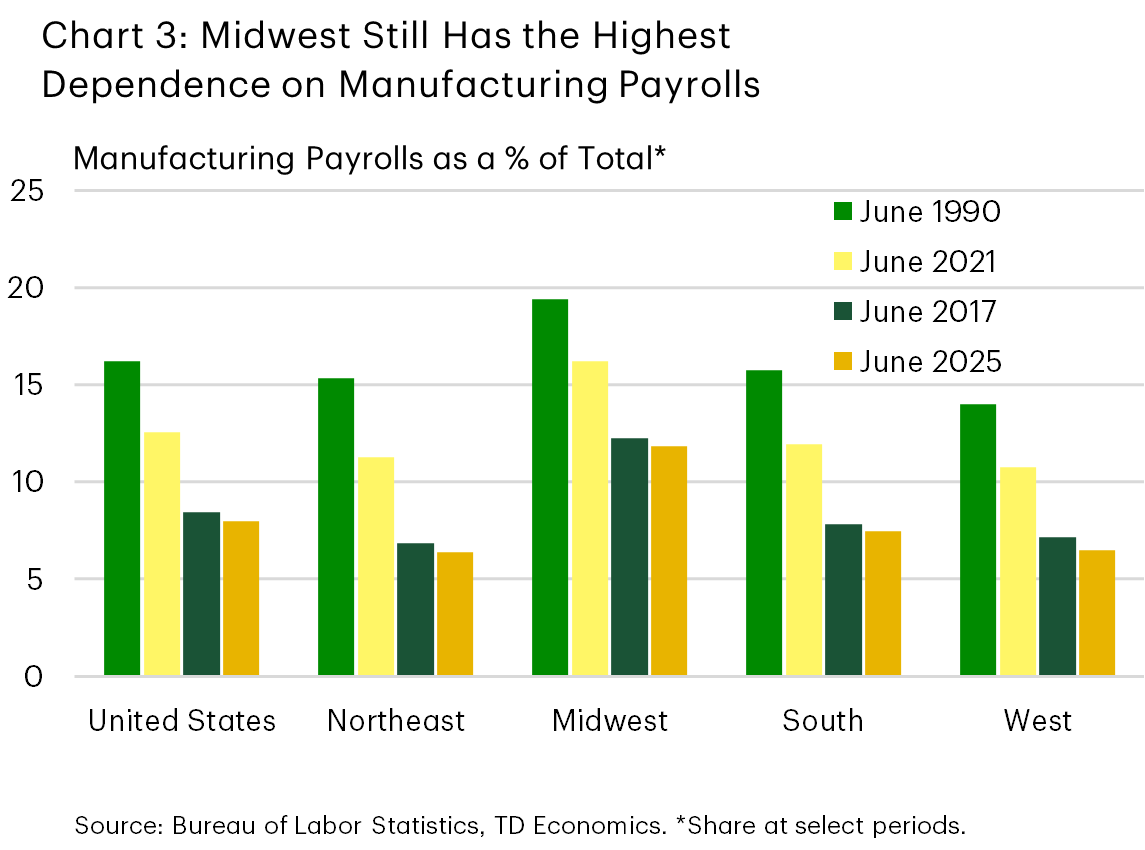
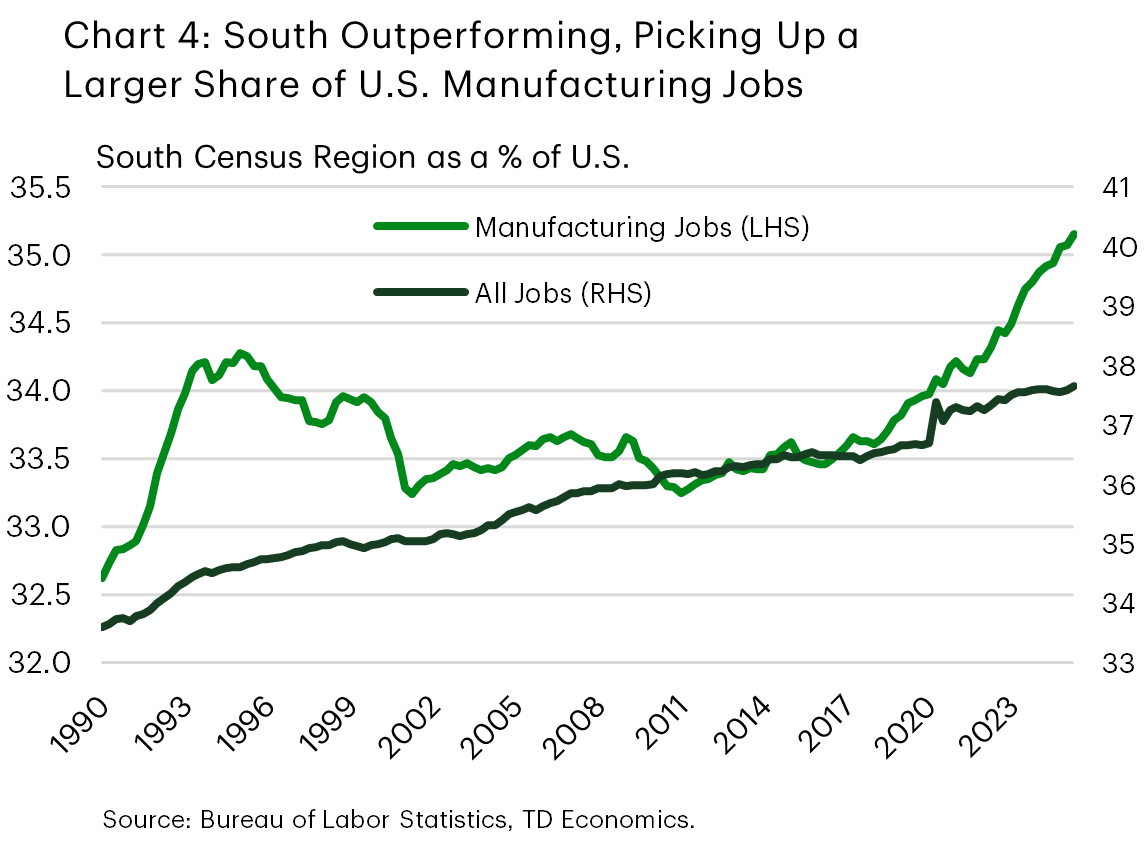
Manufacturing continues to command a larger share of jobs in the Midwest, but that share has dwindled over time (Chart 3). The most exposed states to manufacturing jobs are in Indiana (16% of total payrolls), Wisconsin (15%), Iowa (14%), and Michigan (13%). In contrast, states in the South have started to command a stronger presence in manufacturing job demand, with Louisiana, Florida and Texas leading that charge over the past three years. This has allowed the region to capture a larger share of the national pie of manufacturing jobs (Chart 4).
Q3. What does recent data tell us about the industry's direction?
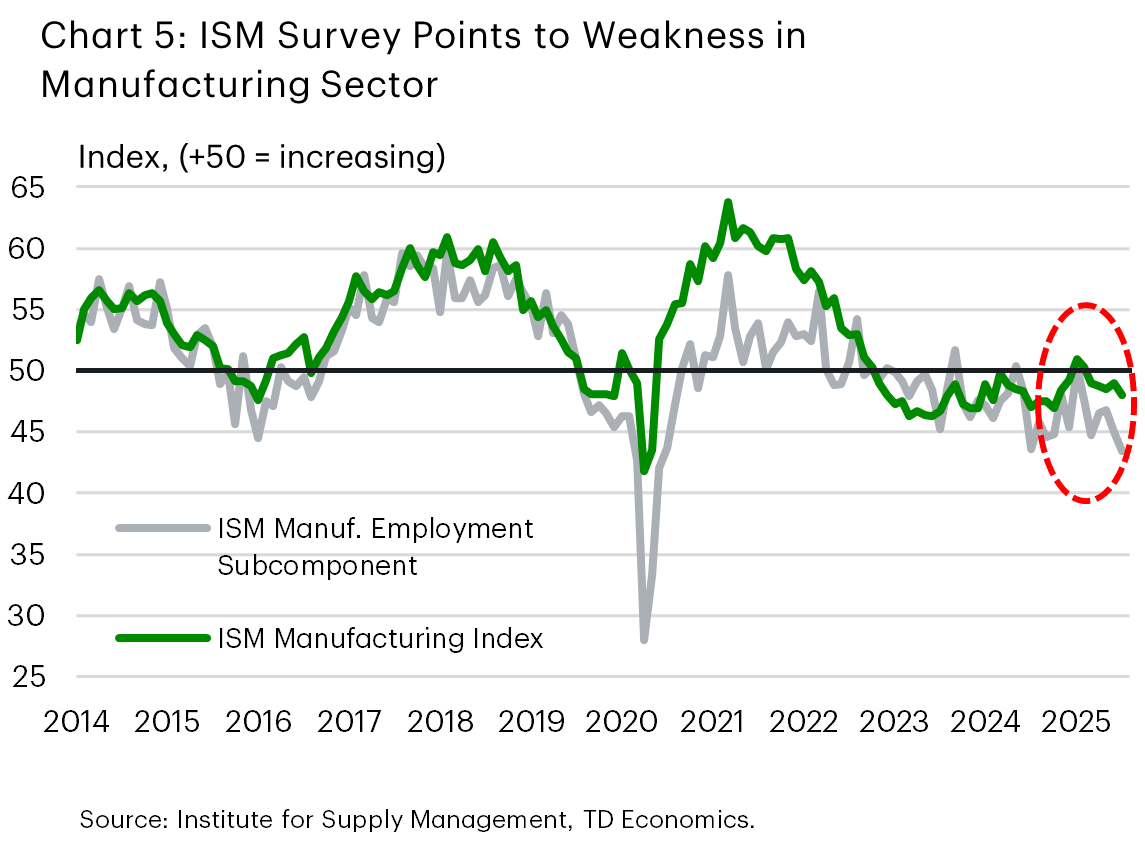
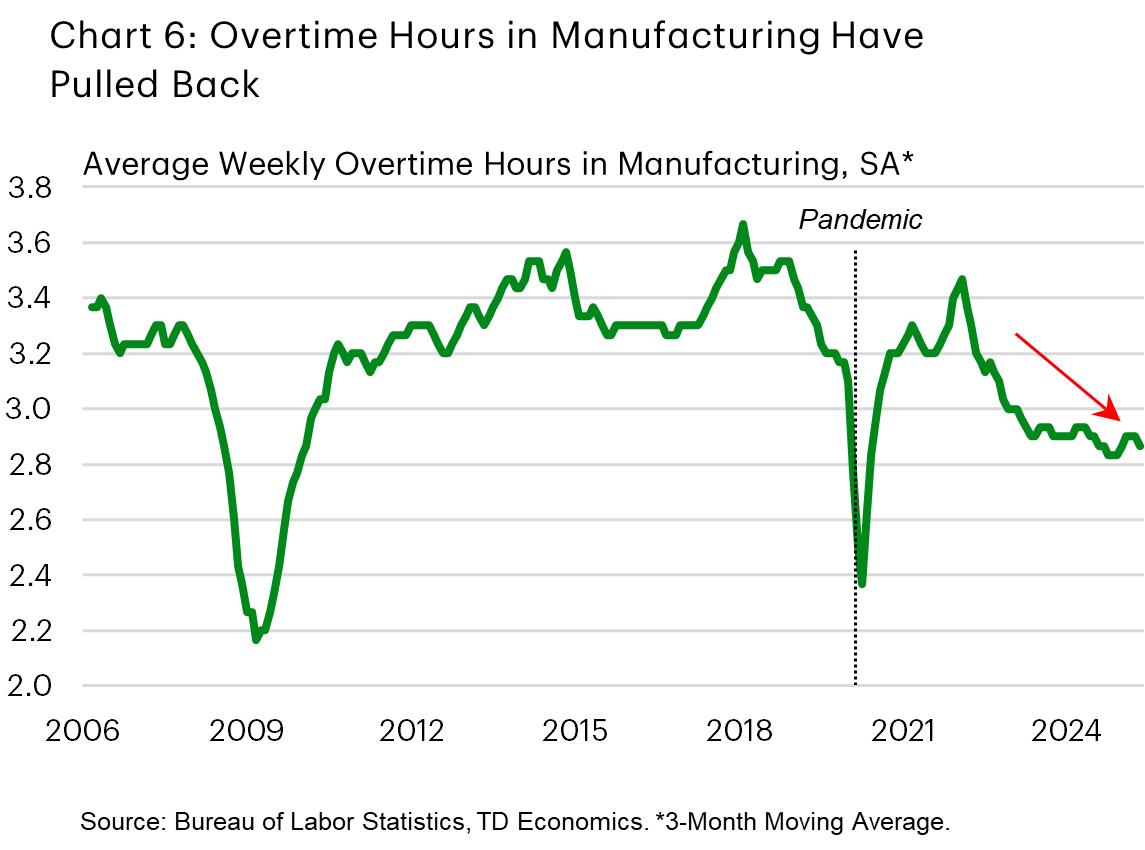
Manufacturing payrolls have trended lower over the last few months and are down 0.9% year-on-year (or 113k), with roughly two thirds of these losses concentrated in transportation equipment and computer & electronic product manufacturing. The ISM Manufacturing survey echoes the weak narrative, with both the overall index and its employment subcomponent remaining in contractionary territory for several months now (Chart 5). Additionally, overtime hours in the sector are down from historical norms (Chart 6). All in all, most indicators suggest that the manufacturing sector remains on soft footing, which can be partially tied to the combination of slowing global growth and elevated trade uncertainty of the recent months.
Q4. Can protectionist trade policy revive U.S. manufacturing?
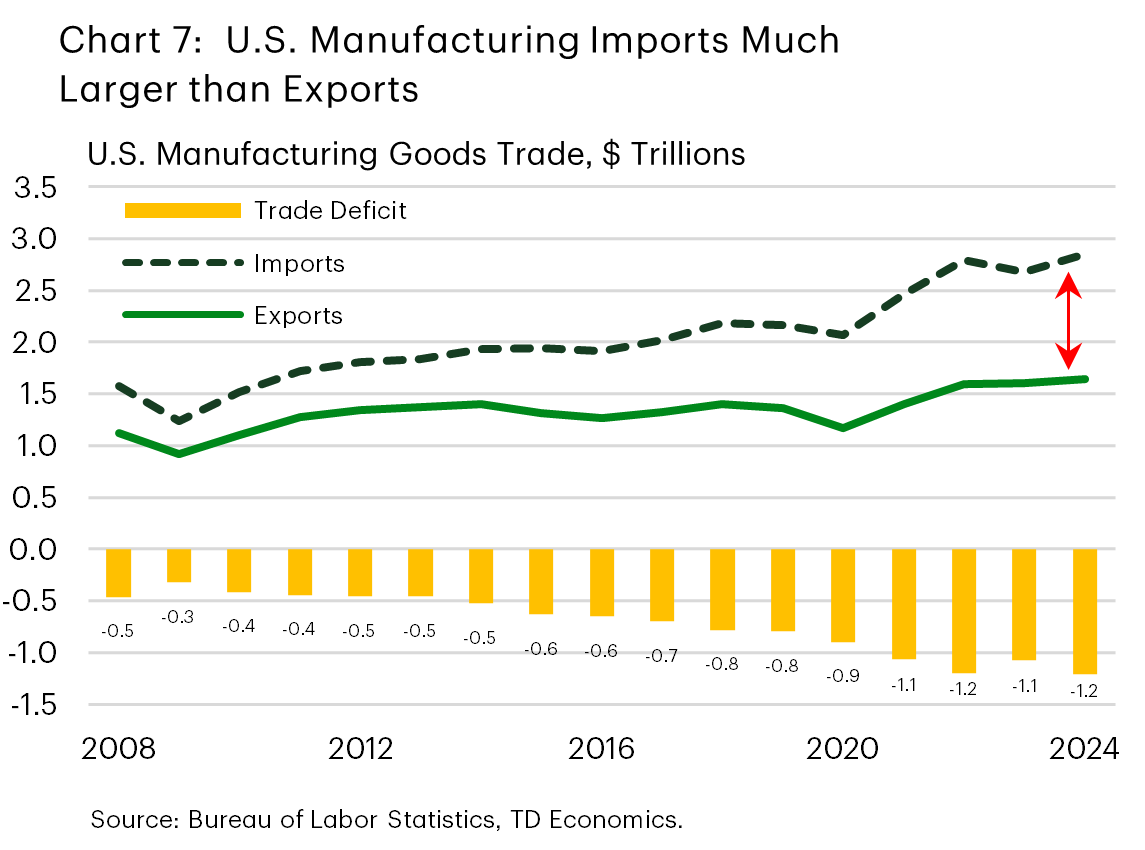
There is a long list of drawbacks typically associated with protectionist trade policy, such as higher product prices, reduced overall trade, and retaliatory measures. However, tariffs do have the potential to favor the U.S. manufacturing sector, even if over a limited period. The main reason is because the U.S. has a large trade deficit with the rest of the world. Manufactured goods account for close to 80% of exports and an even higher 87% of imports. Broadly speaking, the higher reliance on imports, as shown in Chart 7, can yield benefits when tariffs incent more production stateside. Even in a scenario where retaliatory tariffs weigh on U.S. goods exports and negatively impact their supporting domestic manufacturing structure, this can still lead to a substitution of some portion of imported goods towards American production. Often this starts with maximizing underutilized capacity within existing structures.
However, this dynamic can be stymied if tariffs are implemented unevenly across countries on products. Steep tariff rates on some countries and not others create an incentive for companies to substitute imports from the high-tariff regime to the lower one. Companies must consider many moving parts, such as the mix of tariffs, supply chain substitutability, tax and regulatory regimes, and the quality of labor and its overall costs.
Q5. Have companies been making efforts to bring manufacturing jobs to America
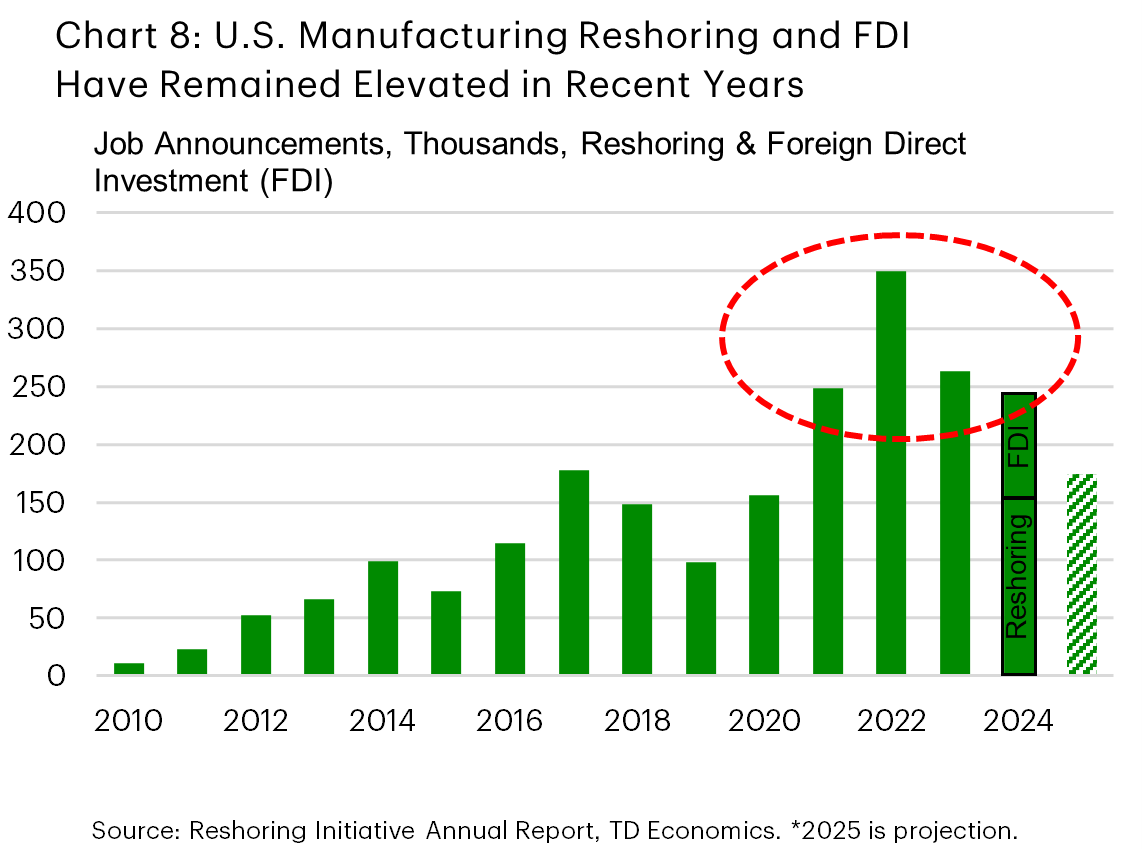
U.S. manufacturing 'reshoring' and foreign direct investment (FDI) job announcements have remained elevated in recent years, corroborating the view that companies have indeed been bring more jobs to America. This trend was accelerated by the pandemic, which wreaked havoc on supply chains and raised awareness for diversification and to bring some production back home closer to the end-consumer. While these types of job announcements eased last year, they remained elevated at roughly 245 thousand, with reshoring by U.S. headquartered companies (157k) outpacing FDI by foreign headquartered companies (88k) by the largest margin on record in 2024 (Chart 8)1.
As trade uncertainty and potential retaliatory tariffs weigh on investment decisions, data for this year suggest that related job announcements could ease to below 200 thousand.2 Asia remains the largest source of these jobs, while Texas, South Carolina, and Mississippi are poised to be the top states at the receiving end for 2025. What's more, tariffs have been a key motivator behind recent reshoring and FDI job decisions, with this factor being cited more frequently than last year. Meanwhile, government incentives are cited less than last year, in tune with the phase-out of previous subsidies.
Q6. How have manufacturing job openings fared in comparison to other industries
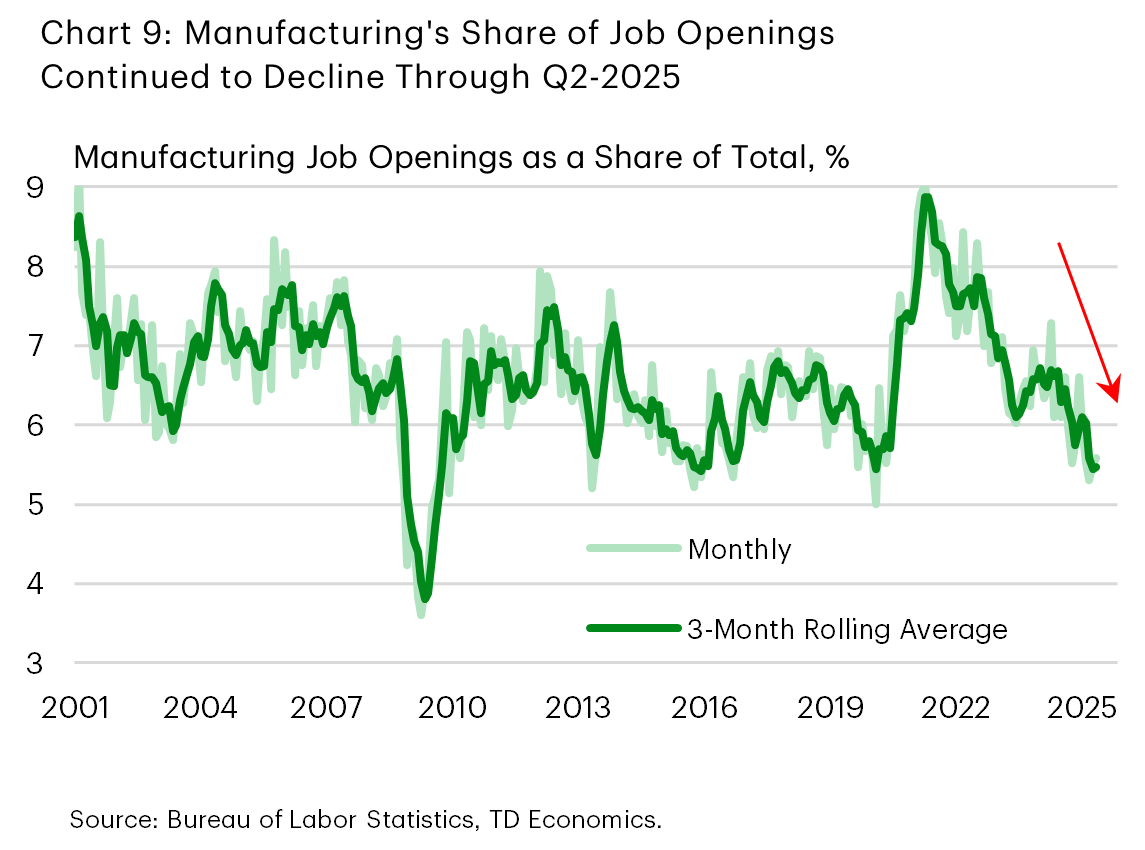
Employer demand is captured by the JOLTS survey in the number of jobs that are "open" or unfilled. For manufacturing, these have continued to head lower in recent months, to around 410 thousand. This is much lower than the pandemic peak of one million openings, but consistent with its pre-pandemic level. However, job openings by employers have eased at a faster rate in manufacturing than other industries, which means that the sector's total share of available jobs is just 5.5% versus almost 7% this time last year. (Chart 9).
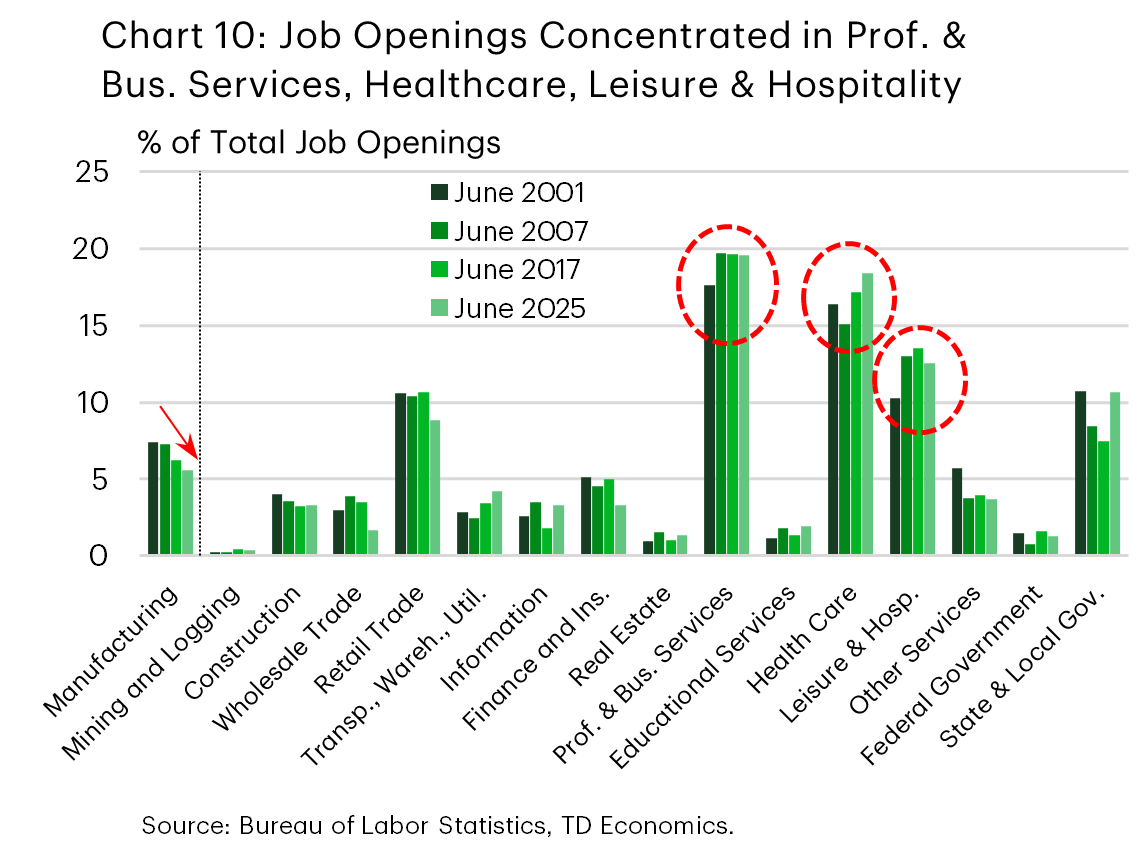
Elsewhere in the economy, job openings remain concentrated in the familiar sectors of professional & business services, healthcare, and leisure & hospitality – the same ones that have outperformed job growth over the years (Chart 10). Openings in sectors such as retail trade and state & local government also carry a decent weight.
Q7. What’s the scope for manufacturing to scale up jobs in the decade ahead?

A wave of construction in the manufacturing space bodes well for the sector's outlook over the medium-to-long term. While a large part of the construction investment that we've seen over the last several quarters has been in the "computer, electronics, and electrical" (i.e., semiconductor plants), investment in other areas of manufacturing has also trended up (Chart 11). As more and more of these newly constructed facilities come online, there will be scope to boost both sectoral output and employment. As mentioned previously, protectionist trade policy also has the potential to be a tailwind. Some corners of manufacturing will be better positioned to capitalize on growth efforts, such as those involved in the production of strategic and national security items (i.e., semiconductors, drones, weaponry, etc.), along with those in the production of high value-added items (i.e., EVs, batteries, etc.).
Yet, despite the expected upside for the industry, several obstacles lie in the way of boosting manufacturing employment in America. For starters, there exist labor force limitations related to a lack of (interested) workers and skills mismatches. Reports tracking the industry's progress suggest that workforce constraints loom large.3 A wave of retirements is expected to significantly add to the difficulty of boosting headcount in the years ahead (for more detail, see Q8 below). In addition, wages for manufacturing workers also tend to be significantly higher in the U.S. than in other countries, such as those in Asia. The same can be said for environmental regulations, which tend to be stricter in the U.S. and can raise production costs. Meanwhile, diminished local manufacturing supply chains over the years is also an obstacle. As manufactured products often require inputs from other suppliers, a faded U.S. supplier base would make sourcing inputs locally very difficult.
The many benefits of shifting production home – including avoiding tariffs, lower transportation costs, improved supply chain agility and reduced inventory costs, better quality control etc. – can still provide considerable offset. But, profit maximization efforts are nonetheless poised to encourage a greater use of technology and automation, which works to curtail demand for higher-paid workers stateside. The rise of AI-powered robotics has the potential to further exacerbate this trend. All factors considered, a supposed 1000 manufacturing jobs lost in China due to a company relocating production to the U.S. will not translate into 1000 jobs gained stateside.
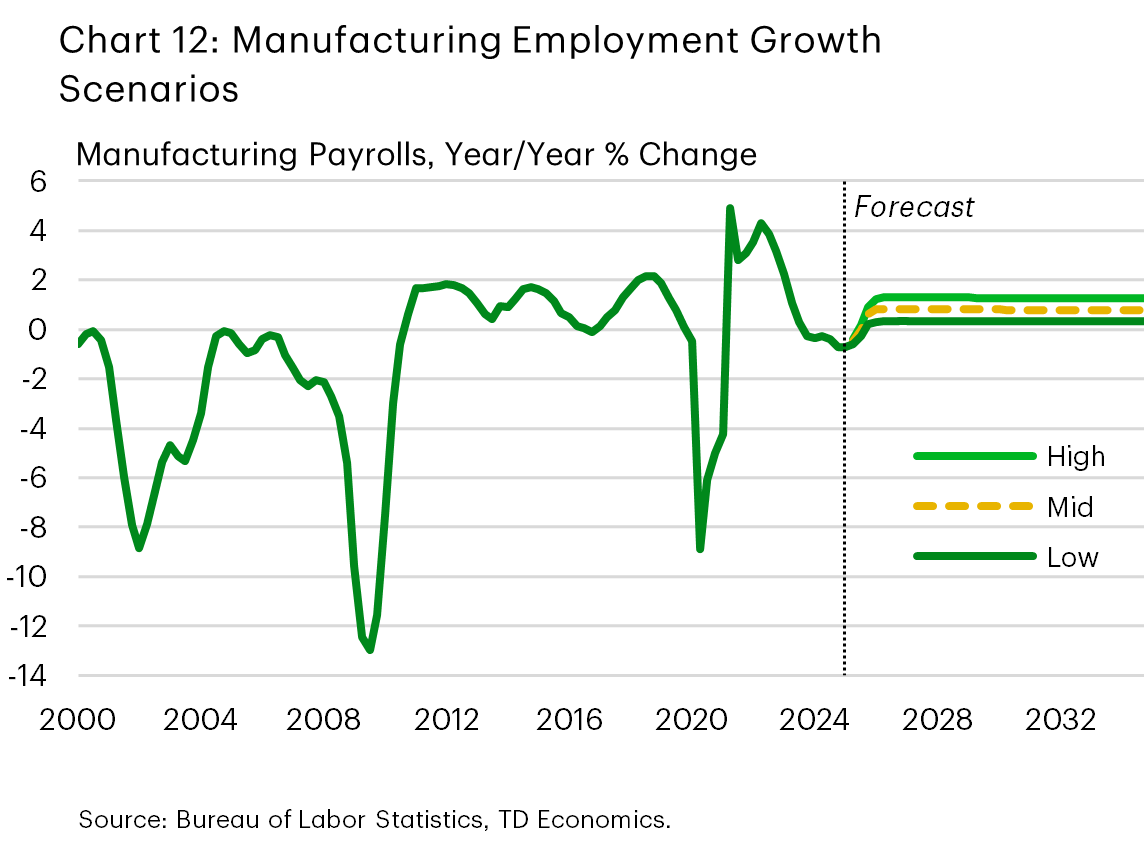
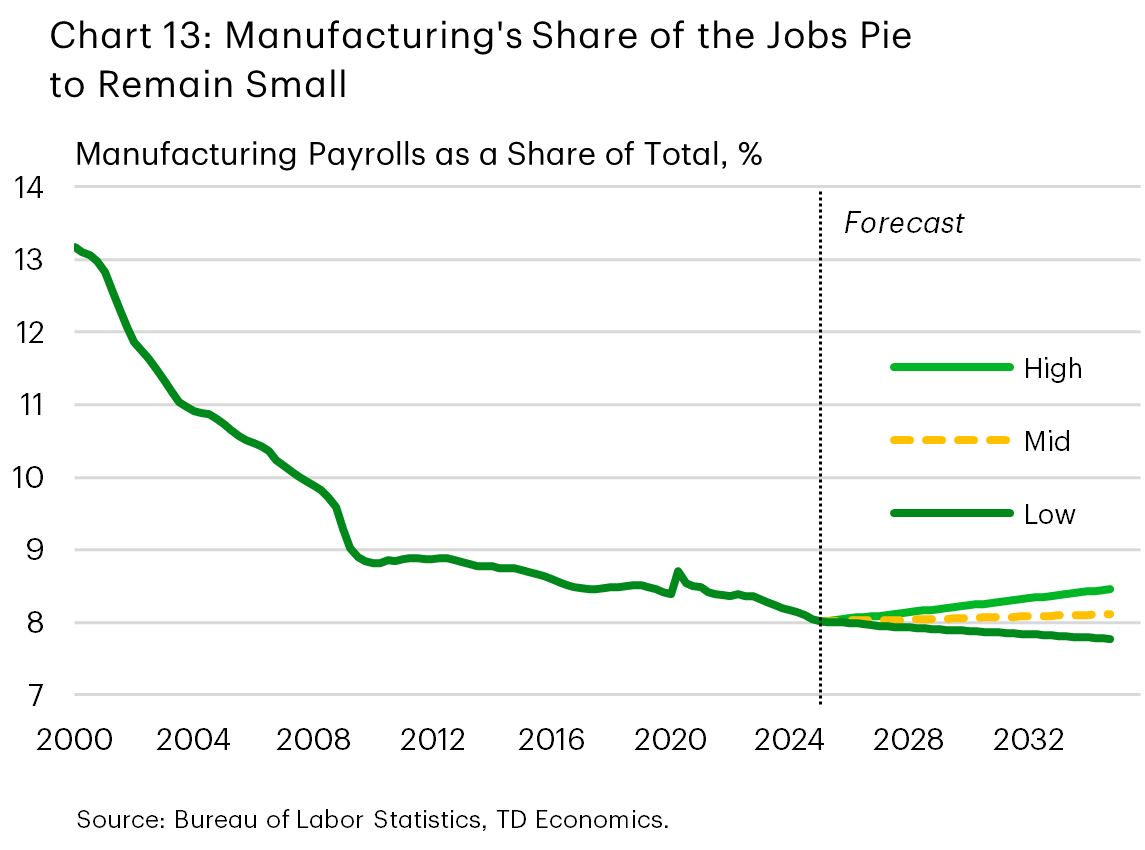
With the tariff puzzle yet to be completed, and manufacturing at such a pivotal point, it is difficult to estimate how fast sectoral payrolls will grow over the next decade. Given this, we have considered three different scenarios: low-growth (which generally aligns with the experience of the last several years), mid-growth (where manufacturing payrolls growth keeps pace with the overall rate of employment), and high-growth (an ambitious scenario which combines a positive outlook with the ability of manufacturing to source the needed workers, allowing sectoral jobs to grow at double the expected rate of overall employment) (Chart 12). Manufacturing payrolls would expand by respectively about 400 thousand, 1 million and 1.7 million under these three scenarios. As shown in Chart 13, in the low-growth scenario manufacturing's share of total employment will continue to grind lower, in the mid-growth scenario it would hold near its current share, and in the high-growth scenario it should grow moderately from roughly 8% of total payrolls to 8.5% in ten years' time.
Q8. As companies shift production and offices, what does the supply of workers look like?
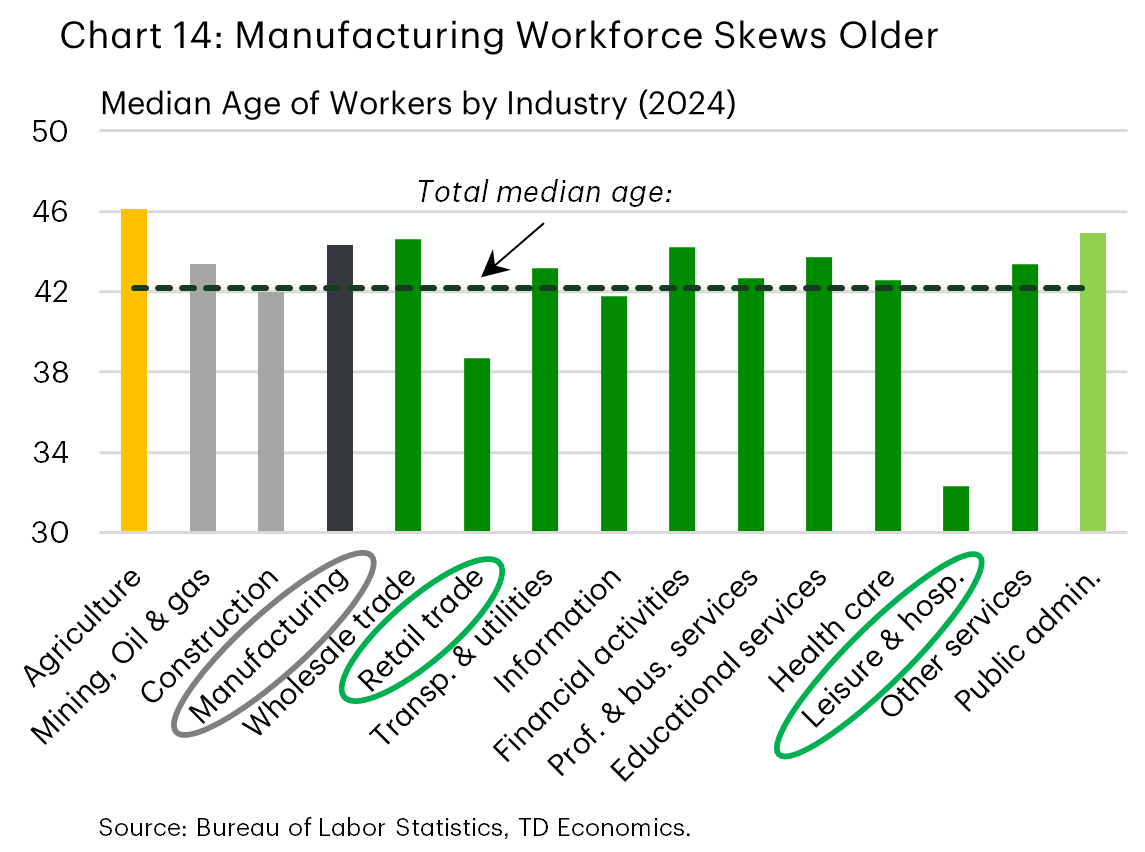
The potential job gains in the above scenarios only speak to "net gains" in personnel, which are only part of a much larger challenge when it comes to filling manufacturing job in the years ahead. The typical manufacturing worker is a couple of years older than the average worker economy-wide, and more than a quarter of manufacturing workers are above the age of 55 (Chart 14). Some corners of manufacturing have an even older workforce. For instance, in metalworking and fabric mills, roughly 40% of workers are 55 years or older. The fact that the industry's workforce skews older means that manufacturers will need to invest significant resources to replace those retiring. Not all industries face this headwind. For instance, leisure and hospitality, and retail tend to have a much younger workforce.
Of the roughly 3 million manufacturing workers aged 55-64, a large part will be up for retirement in the decade ahead. Meanwhile, the vast majority of the roughly 900 thousand workers aged 65+ will have left the industry in ten years' time.4 In this vein, an analysis last year, estimated that some 2.8 million manufacturing jobs that would need to be filled in the decade ahead would be due to retirements alone. Tacking on expected retirement figures to the net new gains in the scenarios above, shows that manufacturing will need to fill at least roughly 3.2 million jobs (an estimate that would rise to a much higher 4.5 million under the high-growth scenario). This again reaffirms the notion of a much taller order when it comes to attracting new workers to the industry, arguing that companies will be increasingly pushed to find technology solutions to replace workers.
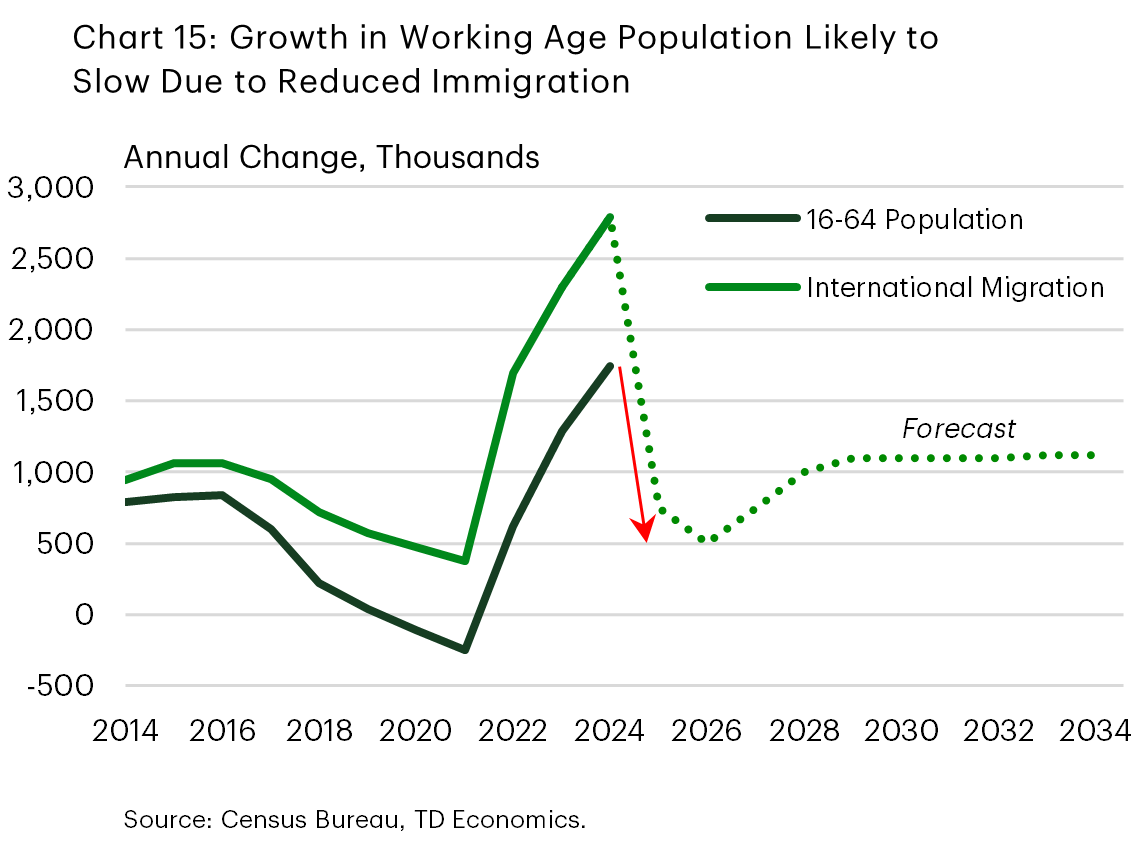
This is also due to a broader American reality. Our base-case forecast assumes that the entire U.S. labor force will expand by about 7 million workers between now and 2034 against a backdrop of aging population, tighter immigration and little movement in the labor force participation rate (Chart 15). This means that the manufacturing sector will need to compete with other sectors for a larger share of the pie of the future supply of workers.
This will be tough considering the industry also has a branding problem in attracting young workers. In a 2024 survey, while the majority of respondents agreed that the country would be better off if more people worked in manufacturing, only a quarter agreed that they would be personally better off if they worked in a factory instead of their current line of work.5 Another survey also confirms that outdated perceptions of manufacturing persist, even as the industry continues to modernize.6 In tune with all this, the same analysis mentioned earlier, estimated that close to 2 million manufacturing jobs may go unfilled if workforce challenges are not addressed. This obstacle may perpetuate a negative feedback loop with respect to manufacturing jobs. Employers struggling to fill open positions on account of missing workers invest more heavily in technology and automation. This causes them to run leaner and require fewer workers in the future.
Q9. What can be done to alleviate worker shortages?
The best way to ensure an adequate supply of labor is to make the industry more attractive to both existing and future workers. Manufacturers have long been aware of the challenges in retaining and attracting new talent, and have taken steps to try and alleviate these pressures over time. These include positive developments on the compensation front, collaborative efforts on education and training, and efforts to improve or rebrand the industry's image.
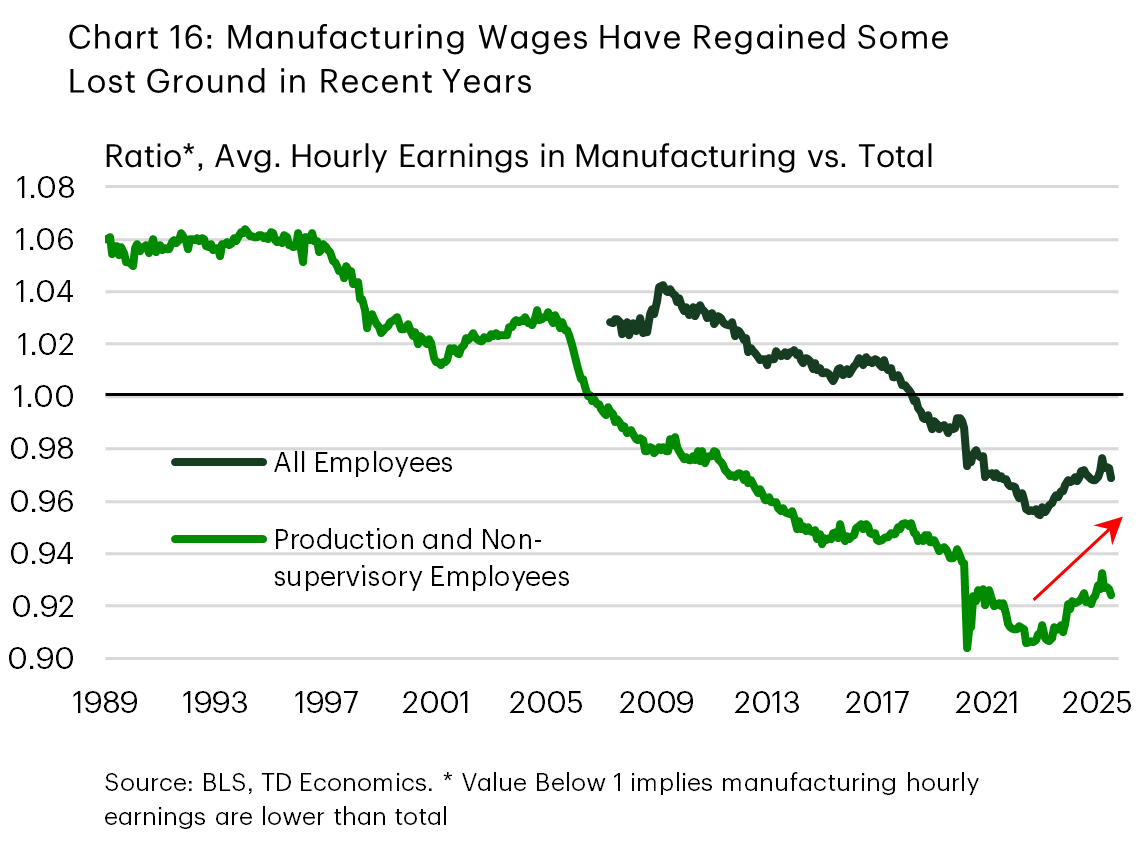
Manufacturing wages have been rising at an above average clip recently, which has allowed them to regain some lost ground vis-à-vis other sectors (Chart 16).
Meanwhile, the industry is also focusing more on apprenticeships, with the popular FAME (Federation for Advanced Manufacturing Education) model offering a successful blueprint. Manufacturers also continue to engage with students, such as showing up to high-school careers fairs or providing tours of workplaces and factories. These efforts not only help court the next wave of workers, but can also help dispel myths about the industry. Once students are on the factory floor, they can see first-hand the type of conditions offered and the technology being used. This is important, because while the wave of retirement among seasoned workers will lead to an experience vacuum, efforts to attract younger workers – which may be more tech-savvy – can carry significant benefits at a time when the industry becomes more tech-infused.
While several pieces seem to be coming together, quite a bit more needs to be done. A recent survey of workers in the field indicates that less than one in ten believed that enough was being done to reskill the workforce.7 Government measures can also help. The encouragement of apprenticeships by the federal government is one such measure. The U.S. administration is supporting the expansion of Registered Apprenticeship programs, with the goal to surpass 1 million new active apprentices.8 Revamping immigration policy to target entry within areas of manufacturing labor shortages can also play an important role in addressing the supply of workers, but this is not the current direction of policy.
Endnotes
- See https://reshorenow.org/june-9-2025/
- Ibid.
- See https://www.fcnews.net/2025/06/reshoring-u-s-manufacturing-jobs-grew-in-24/
- For breakdown by age, see https://www.bls.gov/cps/cpsaat18b.htm
- See https://www.cato.org/sites/cato.org/files/2024-08/Globalization%20Survey_2024.pdf
- See https://hexagon.com/company/newsroom/press-releases/2025/us-manufacturers-say-outdated-technology-is-hurting-hiring
- Ibid.
- Executive order to expand Registered Apprenticeships, see here. Note that the US Department of Labor recently announced nearly $84 million in grants to 50 states and territories to increase the capacity of Registered Apprenticeship programs. See https://www.dol.gov/newsroom/releases/eta/eta20250630
Disclaimer
This report is provided by TD Economics. It is for informational and educational purposes only as of the date of writing, and may not be appropriate for other purposes. The views and opinions expressed may change at any time based on market or other conditions and may not come to pass. This material is not intended to be relied upon as investment advice or recommendations, does not constitute a solicitation to buy or sell securities and should not be considered specific legal, investment or tax advice. The report does not provide material information about the business and affairs of TD Bank Group and the members of TD Economics are not spokespersons for TD Bank Group with respect to its business and affairs. The information contained in this report has been drawn from sources believed to be reliable, but is not guaranteed to be accurate or complete. This report contains economic analysis and views, including about future economic and financial markets performance. These are based on certain assumptions and other factors, and are subject to inherent risks and uncertainties. The actual outcome may be materially different. The Toronto-Dominion Bank and its affiliates and related entities that comprise the TD Bank Group are not liable for any errors or omissions in the information, analysis or views contained in this report, or for any loss or damage suffered.
Download
Share: