A Bit More Supply, Higher Rates to Cool
U.S. Housing Market This Year
Admir Kolaj, Economist | 416-944-6318
Date Published: March 8, 2022
- Category:
- US
- Real Estate
Highlights
- The median U.S. home price surged 30% between February 2020 and the start of this year. The strong showing is partially the result of exceptionally tight supply, with existing home inventories recently falling to the lowest level in more than two decades of recorded history.
- Some help is on the way on the supply front. Housing units under construction are now at the highest level in almost 50 years. Homebuilders remain in high spirits but continue to face challenges in securing labor and key materials, which will weigh on construction timelines. With this in mind, we estimate that builders will bring to market around 1.5 million new homes through the end of this year – an improvement from last year's 1.34 million tally, but hardly a panacea.
- Thirty-year fixed mortgage rates climbed to 4% in mid-February before easing a bit in recent weeks. With the Fed poised to hike multiple times this year, rates are poised to grind higher. This will weigh on already-strained affordability and take a bite out of demand.
- The combination of a bit more supply and leaner demand should help cool the U.S. housing market this year. We expect home prices to grow at around 10% over 2022 – a notable deceleration from last year's 15% pace (as per the CoreLogic index), but still a strong showing given that the supply imbalance will take more time to dissipate.
It has been a little over two years since the first cases of COVID-19 washed up on American shores, with the resulting health crisis posing a unique negative shock to the U.S. economy. Contrary to the struggling experience that has characterized most sectors, the housing market has generally had a solid ride during this two-year period, barring only some initial weakness at the onset of the pandemic.
The early lockdowns and the ebbing and flowing of restrictions that came with subsequent infection waves motivated Americans to reconsider their living arrangements and to put housing higher on their priority list. Backyards and home office space rose in popularity alongside an increase in remote work, together hastening the population shift to the suburbs (see here). Meanwhile, a gradually improving labor market backdrop, low interest rates and fiscal stimulus helped provide plenty of support for housing demand.
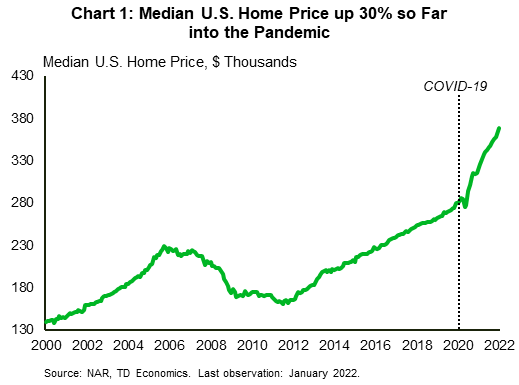
Over the course of the pandemic, median prices for existing homes rose by an astounding 30% (Chart 1). While unusually strong, the sharp increase in home prices is not that surprising considering an intensifying supply shortfall. With respect to the latter, multiple indicators point to tight conditions in virtually all corners of the housing market.
Tight all around
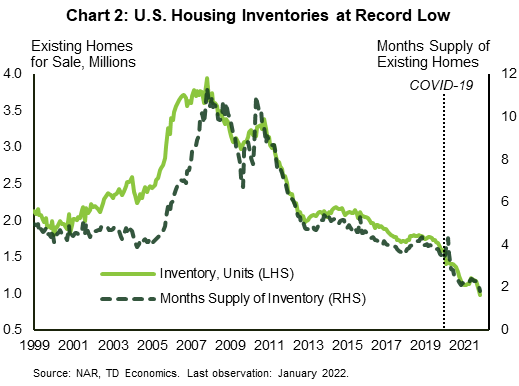
The U.S. housing market was fairly tight even before the onset of the pandemic. Scarring from the Great Recession caused homebuilders to move very cautiously during the 2010s, leaving the housing market undersupplied in relation to household formation. Just before the pandemic hit, there were roughly 1.6 million existing homes for sale across the country, the equivalent of 3.5 months supply at the existing sales pace – both indicators being at low levels relative to history. Supply shrank further over the course of the pandemic, falling to less than a million homes for sale (or under a 2-month supply at the current sales rate) – the lowest level in more than two decades of recorded history (Chart 2). It's worth noting that these inventory tallies also include properties that are already under contract to be sold. Excluding the latter points to an even more pronounced inventory shortage backdrop.
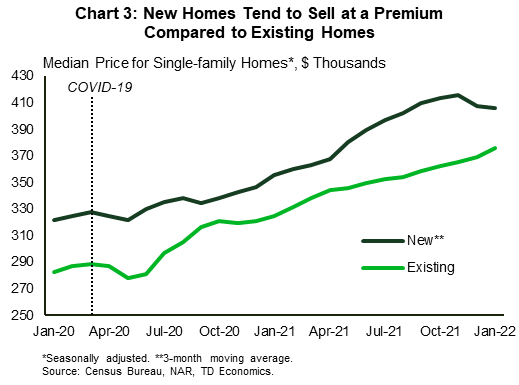
The supply of previously sold (existing) homes makes up the bulk of inventory that's available for sale in any given month. Newly-build homes, meanwhile, tend make up a much smaller share of the pie. As such, while the inventory for new single-family homes rose from 330 thousand at the start of the pandemic to around 400 thousand recently this has done little to ease overall supply pressures. The increase has also been heavily concentrated in the South Census region, with rest of the country recording more muted improvements. Moreover, the new inventory has been accompanied by heftier price tags, pointing to little respite from an affordability point of view. New homes are typically regarded as a better product over existing homes and tend to sell at a premium in relation to the latter. Prices for new homes have risen by a similar degree to existing homes and are up around 25% so far into the pandemic (Chart 3).
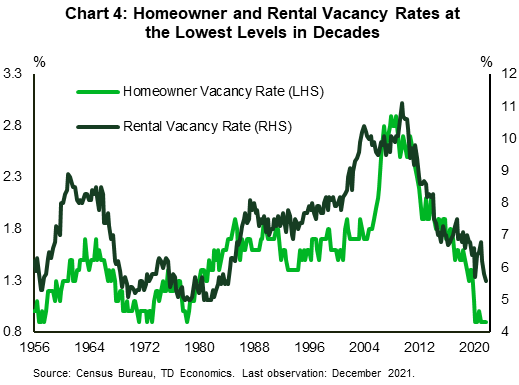
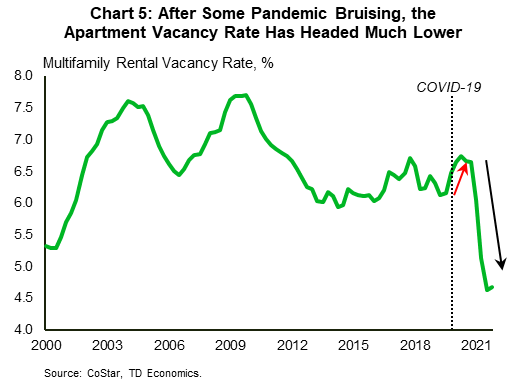
The tight housing conditions extend to the rental market. Census Bureau data reveal that while the homeownership vacancy rate has matched previous record lows with data stretching back to the 1950s, the rental vacancy is at the lowest level since the 1980s (Chart 4). Market-based data further reaffirm the theme of a tight rental apartment market. The pandemic did weigh on dense multifamily living in its early stages, nudging up the apartment vacancy rate during 2020. But over time, the combination of relaxed restrictions, learning to live with COVID-19, and the drying up of single-family inventory, helped channel more activity back toward denser living. This reduced the national apartment vacancy rate to well below its pre-pandemic level (Chart 5). The tight conditions in this corner of the housing market are also showcased through unusually brisk rent growth, which was up 11% year-on-year (y/y) in the final quarter of 2021 – the strongest showing in recorded history stretching back to year 2000.
A rich supply pipeline …
Focusing on the year ahead, plenty of indicators suggest that last year's red-hot housing market should gradually transition to a somewhat more balanced phase. Improved supply is poised to play a role into this theme.
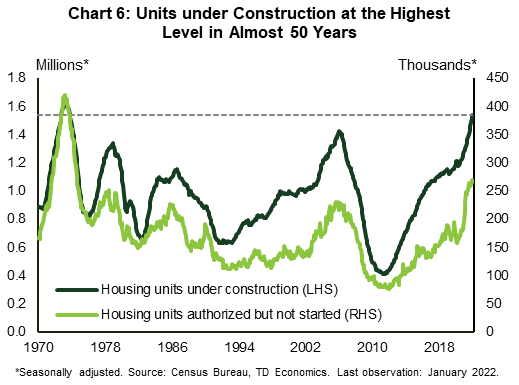
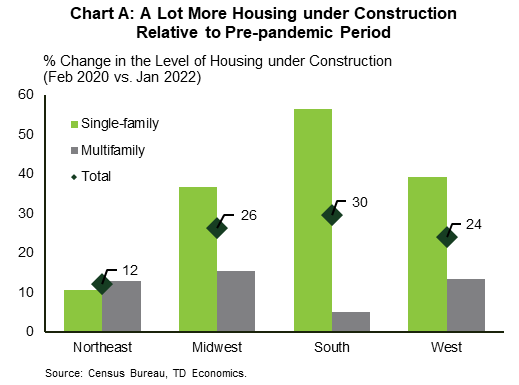
Strong rent and home price growth, while weighing on consumers' wallets, have attracted more investment to the housing market. Housing starts gathered speed in the aftermath of the first pandemic wave and averaged a healthy 1.6 million units (annualized) over the course of 2021 – the best clip since 2006. As a result, in nominal terms, the number of housing units under construction is presently at the highest level in almost half a century (Chart 6). Meanwhile, benchmarked against the level of housing stock, the current construction pipeline is at the highest level since (again) 2006 – the height of the pre-Great Recession housing boom. The pace of improvement varies throughout the country. The South region, which has the fastest growing population among the four Census regions, has seen the biggest increase in the level of housing under construction, with strength skewed toward single-family units. The latter are up more than 55% relative to their pre-pandemic level, whereas multifamily units in the region are up a more muted 5% (see Chart A in the Appendix).
While builders continue to chip away at existing projects, there are also some 280 thousand homes that have already been authorized but where construction has not yet begun. This is up close to 40% from a year ago and the highest level in the series since the early 1970s (Chart 6). The large backlog of "authorized but not yet started" units is a symptom of the multiple challenges that builders face in the current environment when trying to bring more product to market. The backlog, however, can also be interpreted as a positive signal, because once these hurdles ease, builders are poised to quickly begin work on already-authorized projects.
… but plenty of obstacles
Homebuilders are aware of the massive inventory shortfall, which will take time to be fully replenished to the point where it satiates the market. As such, they remain in relatively high spirits, with the National Association of Home Builders (NAHB) Housing Market sentiment index still near the highest level on record. Despite this, plenty of indicators also bring to light the numerous challenges that builders face in the current environment. These challenges can be broken down in three main categories concerning materials, land (developed lots) and labor.
-
Material shortages (and delays)

Supply chain disruptions as a result of the pandemic are featuring heavily in the construction industry, with builders pointing to material shortages and elevated material prices as top problems (Chart 7). Key homebuilding ingredients high in demand but short in supply include lumber and plywood, appliances, windows and doors, copper wiring, and gypsum, among others. Backorders and long lead times for many of these products play a role in delaying the completion of homes that are currently being worked on. At the same time, because of the shortages, builders are having to pay higher prices. Lumber, which currently has a price tag of around $1,400 per 1000 board feet, compared to the pre-pandemic level of less than $500, is but one example. The strong surge in the producer price index (PPI) for 'inputs to residential construction' over the past year, reaffirms the notion that price pressures are widespread.
-
A shortage of developed lots
Another thorn to the side regarding future construction activity is a shortage of developed lots. Not only is this singled out as another top problem (refer back to Chart 7), but in a recent NAHB survey, more than three quarters of homebuilders (76%) reported that the overall supply of developed lots was either 'low' or 'very low'. This marked an all-time high with data stretching back to the 1990s.
-
A shortage of labor
Given the strength in the housing market, the recovery of residential construction employment has moved at an above-average pace, with the sector recovering all jobs lost at the onset of the pandemic by early 2021. Sectoral payrolls have pushed higher since then, rising over 6% above their pre-pandemic level as at the start of this year. Similarly, payrolls of special trade contractors in the residential space are up more than 5% from their pre-pandemic level. Few corners of the labor market have been as successful.
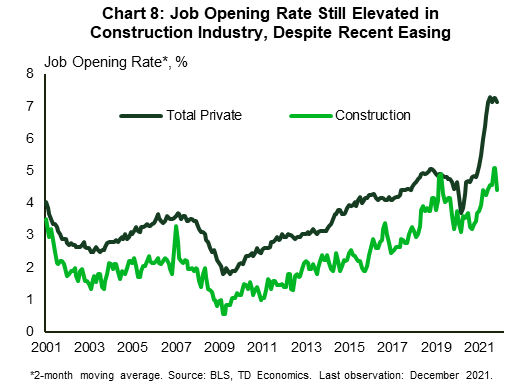
Data from the Job Opening and Labor Turnover survey (JOLTS) indicate that, despite some recent pullback, the construction industry still has an elevated job openings rate and some 340 thousand unfilled openings (Chart 8). Rising construction wages – up 5.1% y/y in February – are helping attract more workers to the industry. But, as the labor market strengthens and the unemployment rate heads lower, hiring in the sector is likely to continue to prove challenging. Some respite, however, may come through immigration. The level of immigration in the U.S. dropped from more than one million in 2015-2016 to about a quarter-million in 2021. Immigrants punch above their weight when it comes to participating in the construction industry.1 Therefore, as the pandemic fades, the resumption of more typical immigration inflows should help play a role in easing some of the industry's labor supply issues.
Supply of new homes to trek higher, leading to a slightly more balanced 2022
New homes
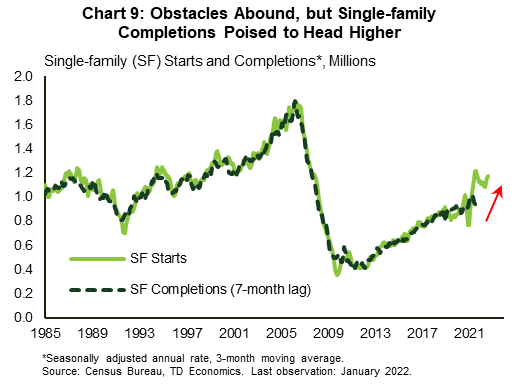
Typically, there's a pretty tight relationship between housing starts and the amount of inventory that's brought to market in subsequent months. This relationship is tied together by the length of time that it takes to complete a housing unit. In recent years, the length of time to complete a single-family home from start to finish has averaged around seven months, while that of multifamily units increased to more than fifteen months in the last two years. Using these timelines as a basis, the pace of housing starts over the past year helps provide a roadmap as to the number of new units that are likely to be completed in the months ahead (Chart 9 and 10). That said, the many difficulties that builders currently face, as outlined in the prior section (i.e., delays in securing key materials and the difficultly in filling job openings), are likely to lengthen delivery timelines for many projects. This adds a layer of uncertainty to the forecast.
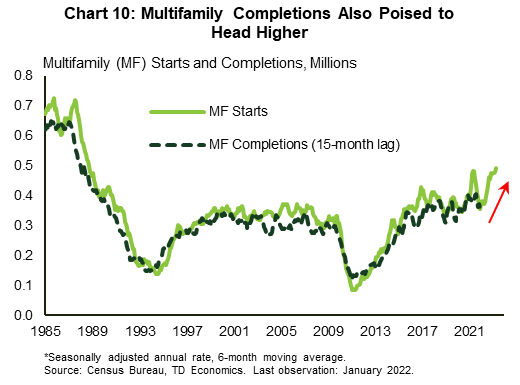
The fallout from the recent Russia-Ukraine conflict is likely to add to supply chain disruptions and will boost price pressures in the near-term, with upward pressure on fuel prices but one example. That said, the fading of the pandemic is likely to remain the overriding factor. We anticipate that many of the supply chain issues tied to the health crisis will ease gradually over time as the pandemic fades further in the rear-view mirror. With this in mind, we estimate that homebuilders are likely to bring to market around 1.5 million new homes through the end of this year, the vast majority (about seven in ten) being single-family homes. This will mark an improvement from last year's 1.34 million tally and will help lead to a slightly more balanced market, but will hardly be a panacea. While our outlook is cautiously optimistic, we note that the potential for the emergence of additional supply chain issues, whether related to the pandemic (i.e., the emergence of new problematic virus variants) or other factors (i.e., further escalation of geopolitical conflicts), remains a key downside risk.
Existing home inventory
The increase in the supply of new homes has a cascading effect in the existing home market. In a nutshell, some homeowners will be prone to taking the equity in their existing homes to upgrade to a newly-built home. As their existing home is put on the market, resale inventory increases. Done at a large scale, this could help ease some of the gridlock in the housing market as it allows existing owners to trade up the property ladder and improves the choices for buyers along the housing chain. While we certainly see some of this happening in the year ahead, the prospect of higher interest rates going forward is likely to blunt some of the impact. Many current owners have, in fact, refinanced at the ultra-low mortgage rates that became available earlier in the pandemic, and thus may be more reluctant to move when faced much higher mortgage rates for a new purchase.
Other factors likely to help at the margin
There are other ways in which the inventory of existing homes can increase. These include the listing of homes that are likely to be foreclosed on and the moving of seniors into retirement communities. We expect some additional support from both of these areas in the year ahead. The easing of the pandemic should gradually encourage a growing senior population to enroll into retirement communities, while the end of forbearance agreements for struggling mortgage holders is likely to force some owners to sell. With respect to the latter, U.S. foreclosure activity recorded an uptick at the start of this year, following the December expiry of foreclosure restrictions that were placed on mortgage servicers by the Consumer Financial Protection Bureau (CFPB). Investor activity is an added important element worth considering (see Text Box 1).
Text Box 1: Investor activity has important implications for end users
Another interesting area worth keeping a very close eye on is investor activity. Residential real estate investors, both institutional and individual, have been snapping up more homes over the last few years, increasing competition in the market and contributing to stronger price growth. While estimates vary, recent research supports the notion that investors have accounted for a considerable share of recent home purchases. CoreLogic estimates that investors accounted for 26% of single-family purchases in the third quarter of 2021, while Redfin estimates that investors made up 18.4% of all home purchases in the fourth quarter of 2021 – a record high.2
Strong investor activity in residential real estate is in tune with the financialization of housing, particularly in the post-Great Recession period, where low returns motivated investors to chase the yield in risker assets, including in residential real estate. Higher interest rates ahead, coupled with expectations for slower home price growth over the medium term, should (theoretically) reduce the flow of investor capital into residential housing, likely easing some of the competitive pressures for end users. That said, the degree to which this may occur over the course of this year remains rather unclear. Real estate investments are typically highly leveraged, which means that in general so long as home prices continue to grow, an investor has scope to turn a profit if only though capital gains. Price declines, meanwhile, would work in the opposite direction, making yield-seeking investors more likely to unload homes on the market to limit potential losses. The same goes for end users, but the latter are much more likely to hold on to property than investors. Given the lack of widespread expectations for price declines at this point in the cycle, it would not be surprising for investor activity to continue largely unperturbed until interest rates are able to push much higher.
Higher interest rates will weigh on demand, cool price growth
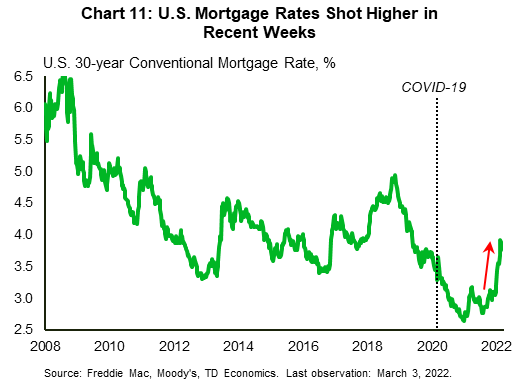
Higher interest rates are another crucial piece to the narrative of a more balanced housing market this year. Thirty-year fixed mortgage rates shot higher at the start of the year, climbing back to around 4% in mid-February (Chart 11). Despite easing a bit in recent weeks (a move partially tied to the Russia-Ukraine conflict), mortgage rates remain above their pre-pandemic level. With the Fed expected to hike rates multiple times over the course of 2022, mortgage rates are poised to grind higher (see here).
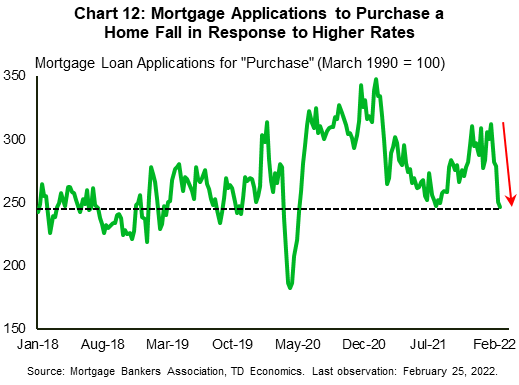
Higher rates will worsen already-strained affordability. This means that some would-be buyers will drop out of the homebuying process, leading to leaner demand. In this vein, we expect home sales to trend lower though the end of the year, but note that the sales pace is still likely to remain well above its pre-pandemic level. The conditions for leaner demand are already in the works. Recent analyses from NAHB confirm that the share of individuals actively trying to buy a home headed lower in the second half of 2021, with the inability to find a home within their price range cited as a top reason for being unsuccessful in this regard.3 High frequency data, such as mortgage loan applications, which have fallen sharply in recent weeks, reaffirm a similar narrative (Chart 12).
The combination of a moderate increase in the supply of homes, coupled with leaner demand, should help tilt the housing market toward more balanced territory. We expect U.S. home prices to grow at around 10% this year – a notable deceleration from last year's 15% pace (as per the CoreLogic index), but still a strong showing given that the supply imbalance will take more time to dissipate.
Bottom line
The U.S. housing market has been a surprising source of strength over the course of the pandemic. Strong demand has eaten into already-thin housing inventories, lowering them to record-lows. Meanwhile, the supply-demand imbalance has encouraged strong price gains. Over the next year, we expect the housing market to transition to a somewhat more balanced phase. Part of this will be due to elevated construction activity, which will gradually bring more new product to market.
Multiple hurdles, such as a shortage of labor and materials, as related to the reverberations of the pandemic through the economy, will weigh on the ability of homebuilders to quickly wrap up residential construction projects, likely stretching completion timelines in the near-term. However, some of these issues will dissipate as the pandemic moves further into the rear-view mirror. With this in mind, we anticipate homebuilders to bring around 1.5 million new homes to market through the end of this year. This won't be a panacea for an imbalance that took years to build (and will take years to unwind), but the additional completions will help soothe supply-side pressures. Higher interest rates are also poised to play a role in bringing about a more balanced market this year as they take some steam out of demand.
Appendix
Disclaimer
This report is provided by TD Economics. It is for informational and educational purposes only as of the date of writing, and may not be appropriate for other purposes. The views and opinions expressed may change at any time based on market or other conditions and may not come to pass. This material is not intended to be relied upon as investment advice or recommendations, does not constitute a solicitation to buy or sell securities and should not be considered specific legal, investment or tax advice. The report does not provide material information about the business and affairs of TD Bank Group and the members of TD Economics are not spokespersons for TD Bank Group with respect to its business and affairs. The information contained in this report has been drawn from sources believed to be reliable, but is not guaranteed to be accurate or complete. This report contains economic analysis and views, including about future economic and financial markets performance. These are based on certain assumptions and other factors, and are subject to inherent risks and uncertainties. The actual outcome may be materially different. The Toronto-Dominion Bank and its affiliates and related entities that comprise the TD Bank Group are not liable for any errors or omissions in the information, analysis or views contained in this report, or for any loss or damage suffered.
Download
Share: