Higher U.S. Real Borrowing Costs Signal Tighter Financial Conditions
Brett Saldarelli, Economist | 416-542-0072
Date Published: November 1, 2023
- Category:
- US
- Financial Markets
Highlights
- Federal Reserve officials often speak about monetary policy working through financial conditions – the broad cost and availability of credit to households and businesses.
- Various financial conditions indexes (FCIs) have given mixed signals on financial conditions, sometimes moving in the opposite direction of fed policy and longer-term bond yields.
- Focusing on real (inflation-adjusted) borrowing costs, there is little doubt that financial conditions have tightened over the past year.
- Higher interest rates are slowing activity in interest-rate sensitive segments of the economy, but overall economic activity has remained resilient. This may suggest that financial conditions have to tighten even further in order to bring inflation to target.
Over the past nineteen months, the Federal Reserve has raised the federal funds rate to its highest level in twenty two years. The Fed’s goal is to return inflation to its 2% target. By raising its policy rate, the Fed tightens financial conditions – raising the overall cost and availability of credit to households and businesses – in order to slow economic activity.
But how are financial conditions measured? Households and businesses face an array of borrowing costs. One way is to aggregate the information across a number of different indicators to come up with a summary measure. Financial conditions indexes (FCIs) do just that and can be a useful tool for observing changes in broad financial conditions. However, while FCIs are good at capturing the impact of increased risk aversion and periods of financial stress, they do not always capture more subtle movements in borrowing costs, especially in an otherwise resilient economic environment. Indeed, some aggregate measures of financial conditions have eased recently, creating confusing signals in an environment of ongoing increases in interest rates.
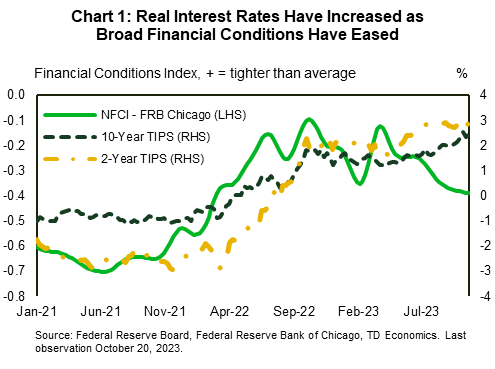
An alternative approach to measuring financial conditions is to look at changes in borrowing costs, adjusting for inflation. Looking at both real corporate and household borrowing rates, there is little doubt that financial conditions have tightened. These have had a notable impact on interest sensitive sectors of the economy, especially demand for housing. While the Fed's "higher for longer" rhetoric has pushed up real borrowing costs, the continued resilience in economic activity suggests that financial conditions may have to tighten even further (Chart 1).
Financial Conditions Indexes Reflect Financial Stress but Not Necessarily Borrowing Costs
FCIs, which encompass a vast number of financial and economic variables into a single metric, have become popular tools for economic forecasters and policy makers. FCIs capture activity from several different financial markets. They also provide a timely gauge of underlying stress in financial markets.
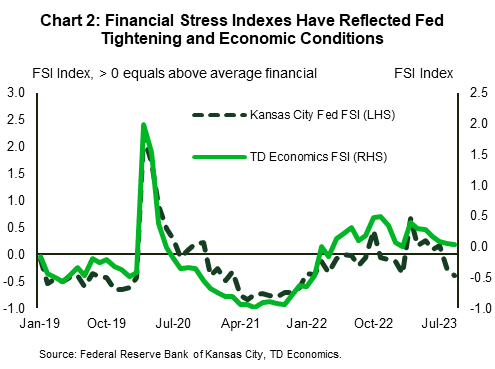
Financial conditions have been tightening over the past two years. The TD Economics U.S. Financial Stress Index and the Federal Reserve Bank of Kansas City's U.S. Financial Stress Index began showing signs of tightening in late 2021, as financial markets began anticipating the withdrawal of the Fed's pandemic-era monetary stimulus (Chart 2). Both indexes increased again in March 2023, in response to the stress in the banking sector, but have since subsided.
While FCIs have been useful for monitoring developments in financial markets and the broad economy, they may not adequately reflect the borrowing costs faced by businesses and households. This has been highlighted by the fact that borrowing costs have continued to increase, even as some FCIs have eased. With the Fed's policy actions aimed at slowing demand, a more detailed discussion of the costs faced by borrowers is helpful in gauging the appropriate path forward for the Fed.
Fed's Actions Are Reflected in Moderating Inflation and Inflation Expectations
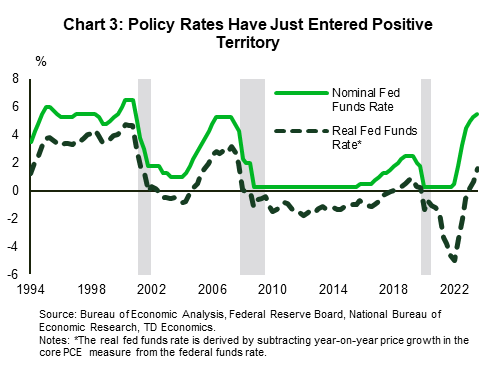
The Federal Reserve first began raising its policy rate in early 2022, but the real fed funds rate – adjusted for inflation – did not move into positive territory until the first quarter of 2023 (Chart 3).
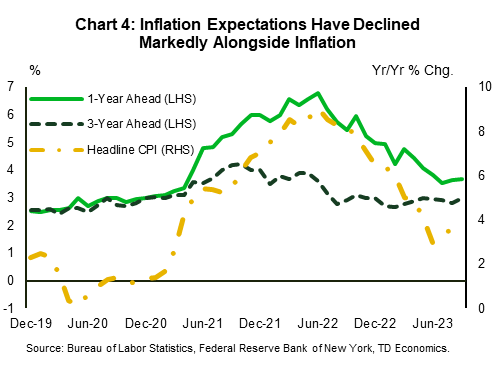
Fortunately, the aggressive actions of the Fed have coincided with a slowing in observed inflation. After peaking at 9.1% year-on-year (y/y) in June 2022, Consumer Price Index (CPI) inflation currently sits at 3.7% y/y. Just as important, inflation expectations, which increased in tandem with inflation, have declined markedly. According to the Federal Reserve Bank of New York's survey of consumer expectations, one-year ahead expectations currently sit at 3.7%, and are almost 1% above their long-run average. Three-year ahead expectations have fallen to 3.0% and are marginally above their long-run average (Chart 4).7
The decline in inflation expectations has also pushed up real borrowing costs. One way to see the increase is in Treasury Inflation Protected Securities (TIPS), securities whose principle and coupon payments are adjusted for inflation. TIPS have increased markedly since the end of 2021, with the 2-year and 10-year TIPS rising 533 bps and 354 bps, respectively. TIPS are currently hovering at levels last seen in 2009. With a slower pace of rate cuts now expected next year, and inflation expectations continuing to fall, real interest rates look to become more restrictive.
Text Box 1: A Primer on Financial Condition Indexes
Following the Global Financial Crisis (GFC) in 2008, FCIs were constructed by several Federal Reserve Banks. A summary and comparison are provided below.
The Federal Reserve Bank of Kansas City Financial Stress Index (KCFSI) encompasses eleven different interest rate spreads and equity market metrics to capture episodes of financial market instability.1 In addition to signaling financial stress, an increase in the index has been synonymous with tightening credit conditions. The index has proven to be a decent predictor of economic activity, moving in tandem with the Federal Reserve Bank of Chicago's National Activity Index.
The Federal Reserve Bank of St. Louis (STLFSI) is comprised of 18 variables including interest rates, interest rate spreads, and bond and equity market volatility measures.2 The STLFSI differs slightly from the KCFSI in that it contains a greater breadth of variables. Additionally, the STLFSI uses higher frequency data, allowing for a timelier assessment of developments in financial markets. The STLFSI signals financial market expectations for the path of the federal funds rate, and reflects timely changes in financial conditions by including a forward-looking 90-day SOFR rate.3
The Federal Reserve Bank of Chicago's National Financial Conditions Index (NFCI) is a leading indicator of stress in financial markets. The NFCI incorporates more than a hundred economic and financial metrics and is decomposed into three sub-indexes – a risk, credit, and leverage index - which allows policy makers to identify the origins of financial instability.4 One advantage of including leverage metrics is that they have a track record of predicting financial stress at horizons greater than a year.4 Since economic and financial conditions often move in tandem, the Chicago Fed has introduced the adjusted NFCI (ANFCI) to isolate the impact that economic activity and inflation have on financial conditions.5
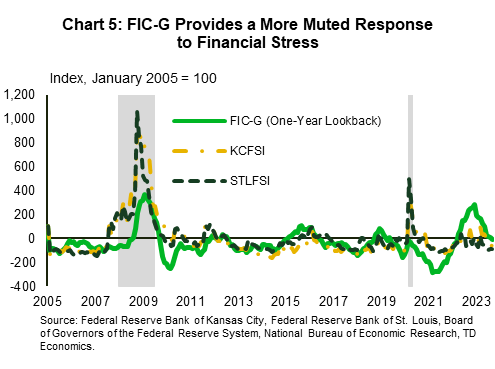
The Board of Governors of the Federal Reserve System's Financial Conditions Impulse on Growth index (FIC-G) builds on the work of previously constructed FCIs. While other indexes are designed to directly capture financial market stress, the FIC-G aims to provide an estimate of the impact that previous changes in financial variables should be expected to have on real GDP in the year ahead.6 The indexes sharp increase in late 2021, in anticipation of the Fed raising interest rates, showed that tightening financial conditions would exert drag on future economic growth (Chart 5). With the index focusing on economic growth, its response to recent episodes of financial market stress, including the GFC and global pandemic in 2020, has been more muted than other FCI's.
The TD Economics U.S. Financial Stress Index (TDFSI) provides an early warning signal for risks stemming from financial markets. The TDFSI incorporates twelve risk metrics that capture risks across markets ranging from equity and bond markets to inter-bank funding markets. In addition to signaling financial instability, the TDFSI tends to lead economic growth.
Higher Rates Have Slowed Activity in Interest Sensitive Areas
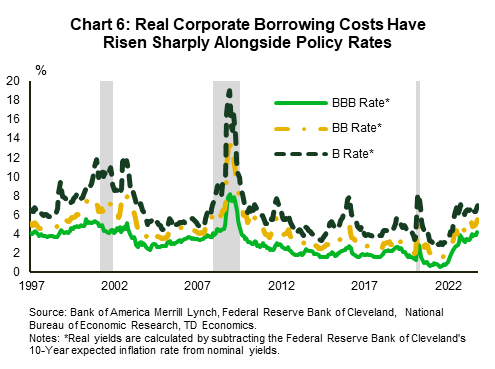
Real corporate yields have also increased markedly since the end of 2021, with the inflation-adjusted BBB yield rising by 336 bps. In the non-investment grade space, the inflation-adjusted double-B and single-B rates have increased by 374 bps and 391 bps, respectively (Chart 6).
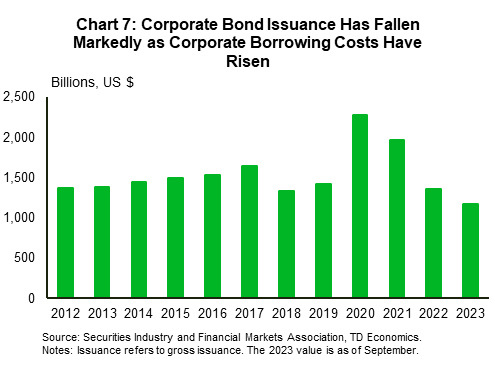
There is evidence that the Fed's actions are slowing activity. Corporate bond issuance has fallen sharply from its pandemic-era surge when firms locked into low borrowing costs (Chart 7). Moreover, business capital spending intentions, as indicated by the Federal Reserve Bank of Chicago's capital spending survey, have declined sharply beginning in the second half of 2021.
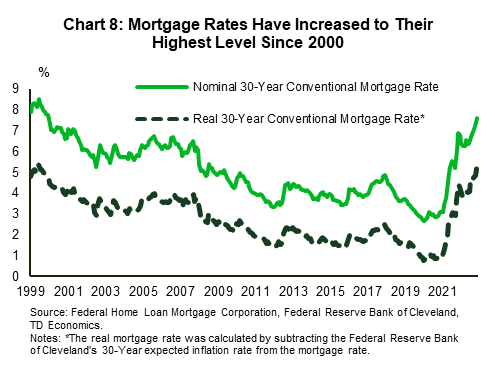
The impact of higher rates has been most pronounced in the housing sector. The 30-year conventional mortgage rate currently sits at 7.8% and is hovering at its highest level since 2000 (Chart 8). When adjusting mortgage rates for inflation – real mortgage rates are also at levels last seen in 2000. The swift increase in mortgage rates has eroded housing affordability, resulting in mortgage demand falling to its lowest level since 1995.8
Pockets of Strength Have Emerged Despite Rising Borrowing Costs
While housing demand has plummeted, a lack of inventory of homes for sale has limited home price declines. Still, with housing affordability continuing to deteriorate, home prices are likely to move lower over the next year (link).
Consumer spending, meanwhile, has been a pilar of strength for the economy, benefitting from savings accumulated over the pandemic. However, much of these savings have now been drawn down and spending is likely to slow (link) materially over the next year.
Business investment (link), on the other hand, will continue to be supported by fiscal policy, and is likely to maintain some strength over the next year. Should fiscal supports continue to give support to economic growth, the Fed may be forced to adjust its monetary policy stance to further tighten financial conditions.
Text Box 2: Measures of Market Stress are Often Precursors to Recession
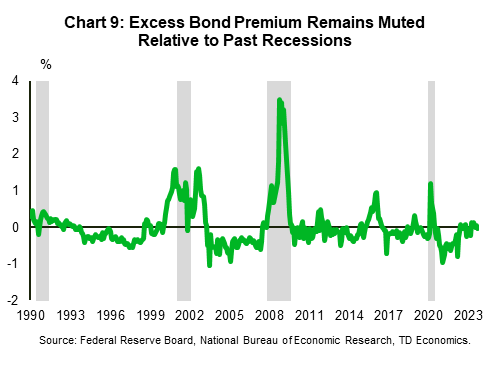
With the Fed unlikely to move from a restrictive position in the immediate future, risks in the financial system bear continued monitoring. One useful measure outside of traditional financial conditions indexes is the excess bond premium.
The excess bond premium is a closely watched metric of credit risk which signals changes in economic activity stemming from the supply of credit.9 Historically, it has risen swiftly during episodes of financial market stress, including the European Sovereign Debt Crisis, the oil price shock in 2015, and the trade war in 2018. In a sign that financial stresses are still relatively benign, the excess bond premium barely moved higher in response to the banking sector tumult in March of this year and has improved since, indicating that an economic downturn is not imminent (Chart 9).
The Fed Still Pondering Lags and Neutral Rates
Incoming economic data will continue to be central to the Fed's calculus in deliberating its next policy move, but policymakers are also focused on the "long and variable" lags of monetary policy. Econometric models have estimated that this lag could range from 12-24 months. However, shifts in policy tools in the post-GFC era, including the use of forward guidance, may have shortened these lags.10 One implication of shorter lags is that the Fed's previous rate hikes would have already fed through to economic activity at this point, which given ongoing demand strength, suggests additional tightening would be required.
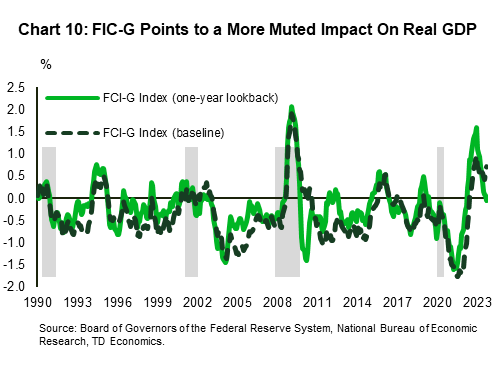
Another important consideration is the neutral rate of interest – the interest rate that neither stimulates nor slows economic activity. As we discussed in a recent piece (link), structural factors such as climate change and deglobalization have likely pushed the neutral rate higher. A higher neutral rate means the Fed has to do more to slow the economy. This may be reflected in the Federal Reserve’s FIC-G index, which has fallen from its peak at the end of 2022, signaling that previous changes in financial conditions could have a more muted impact on real GDP than those earlier in the cycle (Chart 10).
Bottom Line
Financial conditions are closely monitored by the Fed as they transmit monetary policy to the real economy. While some measures of financial conditions have eased in recent months, the rise in real borrowing costs is undeniable and a sign that the medicine is working. Higher borrowing costs have, in turn, reduced demand in interest rate-sensitive sectors of the economy.
At the same time, the resilience in overall economic activity suggests that the dosage may yet have to be tweaked. Fiscal supports are counteracting some of the impact and structural changes to investment demand may require higher interest rates than previously thought. While the Fed's actions to date have tightened financial conditions, they may have to go just a bit further in order to ensure inflation continues to move toward its 2% target.
End Notes
- "Financial Stress: What Is It, How Can It Be Measured, and Why Does It Matter?", Craig S. Hakkio and William R. Keeton. Federal Reserve Bank of Kansas City, Economic Review, Second Quarter, 2009.
- "Measuring Financial Market Stress", Douglas C. Smith and Kevin L. Kliesen. Federal Reserve Bank of St. Louis. Economic SYNOPSES, 2010, No. 2.
- "The St. Louis Fed's Financial Stress Index, version 4", November 10, 2022.
- "Monitoring Financial Stability: A Financial Conditions Index Approach", Scott A. Brave and R. Andrew Butters. Federal Reserve Bank of Chicago, Economic Perspectives, Vol. 35, No. 1, 2011.
- "Introducing the Chicago Fed’s New Adjusted National Financial Conditions Index", By Scott A. Brave and David Kelley. Federal Reserve Bank of Chicago, Chicago Fed Letter, No. 386, 2017.
- Ajello, Andrea, Michele Cavallo, Giovanni Favara, William B. Peterman, John Schindler, and Nitish R. Sinha (2023). "A New Index to Measure U.S. Financial Conditions," FEDS Notes. Washington: Board of Governors of the Federal Reserve System, June 30, 2023, https://doi.org/10.17016/2380-7172.3281
- While consumer-based expectations have shown meaningful signs of abating, there exists multiple measures of inflation expectations including model-based projections. One such measure is provided by the Federal Reserve Bank of Cleveland, which point to a modest uptick in inflation expectations. Another model-based measure is the Federal Reserve's DKW model which points to inflation expectations remaining sticky.
- "Mortgage Demand Falls to the Lowest Level Since 1995 as Interest Rates Near 8%", CNBC. October 18, 2023.
- "Credit Spreads and Business Cycle Fluctuations", Simon Gilchrist, Egon Zakrajsek, National Bureau of Economic Research, Working Paper 17021, May 2011.
- "Big Shocks Travel Fast: Why Policy Lags May Be Shorter Than You Think", Christopher J. Waller, At the Money Marketeers of New York University, July 13, 2023.
Disclaimer
This report is provided by TD Economics. It is for informational and educational purposes only as of the date of writing, and may not be appropriate for other purposes. The views and opinions expressed may change at any time based on market or other conditions and may not come to pass. This material is not intended to be relied upon as investment advice or recommendations, does not constitute a solicitation to buy or sell securities and should not be considered specific legal, investment or tax advice. The report does not provide material information about the business and affairs of TD Bank Group and the members of TD Economics are not spokespersons for TD Bank Group with respect to its business and affairs. The information contained in this report has been drawn from sources believed to be reliable, but is not guaranteed to be accurate or complete. This report contains economic analysis and views, including about future economic and financial markets performance. These are based on certain assumptions and other factors, and are subject to inherent risks and uncertainties. The actual outcome may be materially different. The Toronto-Dominion Bank and its affiliates and related entities that comprise the TD Bank Group are not liable for any errors or omissions in the information, analysis or views contained in this report, or for any loss or damage suffered.
Download
Share: