State of U.S. Housing – Yet Another Hurdle
Admir Kolaj, Economist | 416-944-6318
Date Published: October 16, 2023
- Category:
- US
- Real Estate
Highlights
- Mortgage rates have continued to creep higher in recent weeks, rising to the highest level in 23 years. We expect the move to put further pressure on affordability and spur another leg down in existing home sales.
- High interest rates will also continue to discourage existing owners from listing their homes as per the mortgage rate lock-in effect. But, with demand taking a hit and the labor market expected to loosen somewhat over time, motivated sellers may need to recalibrate their price expectations.
- The lack of supply in the existing home market had, until recently, provided some support for the “new” home market. However, this sector too won’t escape unscathed, with early indications showing it is also feeling the sting of higher rates.
Rates Increase Sharply, Shrinking Pool of Prospective Homebuyers
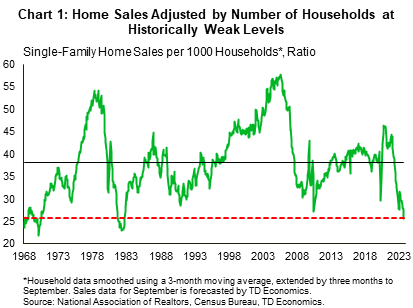
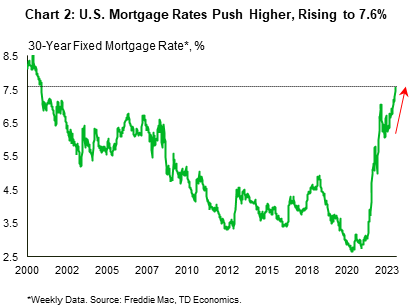
Existing home sales have fallen a whopping 36% since the start of 2022 and currently sit at 4.0 million units, a level not seen since the depths of the Global Financial Crisis (GFC). After adjusting for the number of households, today’s sales look even worse, having fallen to a near 40-year low (Chart 1). At this point, there is little in the way of recovery on the horizon. After a brief reprieve late last year and into early-2023, mortgage rates have again shot higher, and now sit at an eye-catching 7.6% as per the Freddie Mac weekly measure (Chart 2).
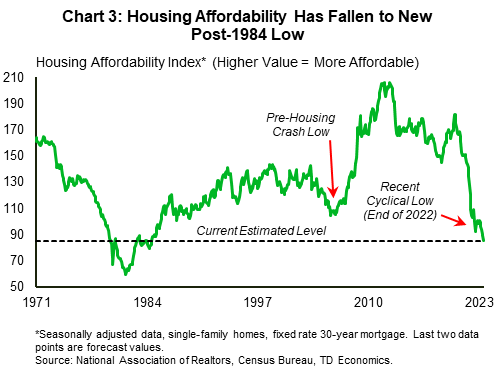
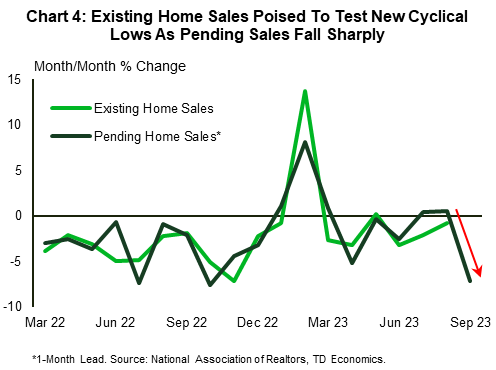
At these rates, housing affordability will take another major leg down, and is likely to hit a new post-1984 low (Chart 3). This will further diminish on an already limited pool of buyers and keep market inventory drum tight as would-be sellers are likely to remain on the sidelines until there’s some reprieve on the rate front. Home sales activity will take a hit. Recent readings on leading indicators corroborate this view. Pending home sales fell 7.1% month-over-month (m/m) in August – bringing the index to a new all-time low – while mortgage purchase applications have fallen to the lowest level since 1995. This suggests that existing home sales are likely to soon dip below the 4.0 million threshold and test new post-2010 lows over the coming months (Chart 4). Note that even prior to the latest backup in rates, we had seen evidence of buyers pulling out of the market, with the share of deals falling through increasing to almost 16% in August – the highest level in nearly a year (see Redfin data).
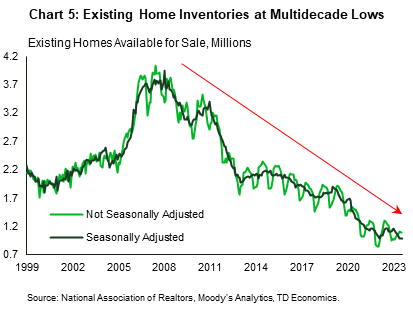
It’s worth noting that the dynamics between the 2010 trough in sales and the current low are very different. Back then, mortgage rates were well off pre-GFC levels (from a little over 6% to 4.5%), while the number of existing homes for sale sat at a more abundant 3.5 million (or 11 months’ worth of inventory). This time around, the resale market has been hit with dual headwinds of a sharp increase in mortgage rates and very thin inventories (around 1 million or just 3 months of inventory), keeping sales at multiyear lows (Chart 5).
The dearth of inventory in the resale market has also been a factor in keeping sustained upward pressure on prices, which has been the other element pressuring affordability. Looking ahead, high interest rates will continue to discourage homeowners from listing properties given that they would face a much higher mortgage rate on their subsequent home purchase. But, with demand taking a hit and the labor market expected to loosen somewhat over time, motivated sellers specifically will likely need to recalibrate their price expectations. All in all, we anticipate a more sluggish price environment may soon follow. Though it’s still early days, the share of listings that have seen a reduction in their asking price has increased to 6.6% over the past month – providing some support to this narrative. Note that this time last year – a period when home prices were falling – the share of listings that had a price drop was slightly lower at 6.4%.
New Home Market Also Feeling the Sting of Higher Rates
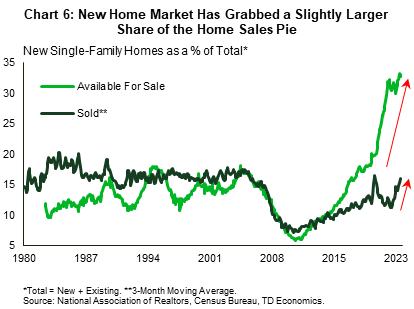
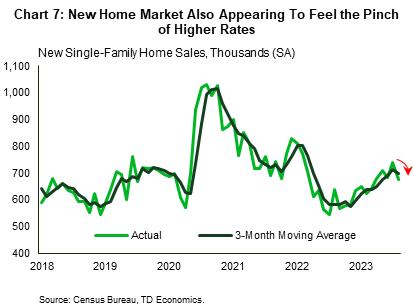
Until recently, increasingly more homebuyers appeared to be moving into the new home market, aided by healthier inventories and builder incentives (Chart 6). But, with mortgage rates pushing significantly higher, the new home sector is also feeling the sting of higher interest rates. Homebuilder confidence has been trending down recently, with builders reporting a pullback in prospective homebuyer traffic and anticipating fewer sales in the months ahead. Additionally, new home sales fell 8.7% in August, more than wiping out the 8% gain in the month prior. This data is inherently volatile, but the moderate pullback on a 3-month moving average (3-mma) basis, signals a potential turning point for the series (Chart 7). Meanwhile, the increase in mortgage rates through early October, suggests this trend is poised to worsen over the near-term.
Digging deeper into the new home market, the previously hot South region appears to be behind the recent softness in sales. Note that while activity has also weakened in the Northeast, this region makes up only around 5% of total new single-family home sales, compared to 56% for the South. Meanwhile, new home inventories have been trending higher, driven (again) by an increase in the South. The latter had much stronger construction activity compared to the rest of the country during the pandemic, thanks in part to an increase in domestic migrants. Population figures for 2023 aren’t due until later this year. However, alternative data sources indicate that while the region continues to attract people from other parts of the country, that inflow may be waning. Apart from the run-up in interest rates, this may be an added factor contributing to less supply being absorbed compared to what builders in the region may have anticipated.
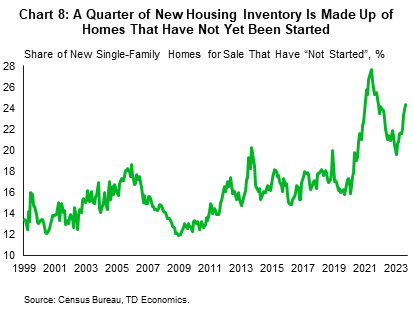
Having been burnt in the last housing crash, U.S. homebuilders appear to be managing their inventory more carefully in this rising rate environment. This as a growing share of the for-sale inventory is made up of homes where construction has not yet started (Chart 8). In other words, builders appear to be reducing speculative construction, something that would help limit sunk costs if there’s no uptake for inventory that’s already been completed or is under construction.
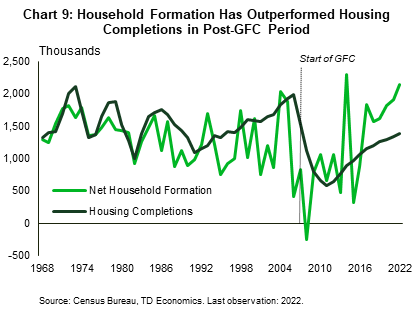
The downbeat sentiment among builders is reflected in construction activity, with housing starts taking a step back over the last few months. The decline has been especially sharp in the multifamily segment. The latter is mostly tied to the rental market and already has a very rich supply pipeline, with the number of multifamily units under construction sitting at a record high of one million. Single-family construction has pulled back too, though at a more moderate clip. An increase in housing permits in August pointed to some underlying resilience, but considering how far rates have come recently, this resilience may prove short lived. This brings us to another point. It is important to take stock of the tug of war between cyclical and structural forces at play in residential construction. Cyclically, there’s room for starts to push lower, especially if the latest increase in rates is sustained for some time, or if rates rise further – something that would further crimp affordability and increase the risk of a recession. Structurally, the picture is more positive. Since the GFC, the rate of household formations has generally outperformed the number of new homes coming to market (Chart 9).
Getting back to the here and now, new home prices are down roughly 7% from their peak at the end of 2022 (on a smoothed, seasonally adjusted basis), and homebuilders have been ebbing and flowing the incentives at their disposal to push inventory along. With conditions in the new home market softening too, builders are expected to make greater use of these incentives over the near-term.
Bottom Line
With mortgage rates creeping higher and hovering around 7.6% recently, housing affordability will take a hit and likely fall to a new post-1984 low. This will further reduce the pool of qualified homebuyers and result in another leg down in existing home sales, which we anticipate will soon test new post-2010 lows. The new home market – which, until recently, benefited from the shortage in the existing home market – won’t escape unscathed, with early data showing that it too is beginning to feel the impact of higher rates.
Disclaimer
This report is provided by TD Economics. It is for informational and educational purposes only as of the date of writing, and may not be appropriate for other purposes. The views and opinions expressed may change at any time based on market or other conditions and may not come to pass. This material is not intended to be relied upon as investment advice or recommendations, does not constitute a solicitation to buy or sell securities and should not be considered specific legal, investment or tax advice. The report does not provide material information about the business and affairs of TD Bank Group and the members of TD Economics are not spokespersons for TD Bank Group with respect to its business and affairs. The information contained in this report has been drawn from sources believed to be reliable, but is not guaranteed to be accurate or complete. This report contains economic analysis and views, including about future economic and financial markets performance. These are based on certain assumptions and other factors, and are subject to inherent risks and uncertainties. The actual outcome may be materially different. The Toronto-Dominion Bank and its affiliates and related entities that comprise the TD Bank Group are not liable for any errors or omissions in the information, analysis or views contained in this report, or for any loss or damage suffered.
Download
Share: