Rise of the Machines:
U.S. Business Investment Resists High Rates
Beata Caranci, SVP & Chief Economist | 416-982-8067
Thomas Feltmate, Director & Senior Economist | 416-944-5730
Andrew Foran, Economist | 416-350-8927
Date Published: September 20, 2023
- Category:
- US
- Business Investment
Highlights
- Despite interest rates rising to a 22-year high and credit conditions tightening to levels consistent with an economic downturn, business investment continues to display incredible resilience.
- Bipartisan legislation, including the CHIPS & Science Act and the Inflation Reduction Act, aimed at greening the economy and reshoring semiconductor production are partly to credit, alongside state and local government incentives.
- Legacy effects from the pandemic are also maintaining a tailwind in the investment for transportation equipment.
- The countercyclical push on business investment is poised to extend into 2024. This resilience is one more factor that could force the Federal Reserve to push a bit harder on rates and/or hold rates higher for longer.
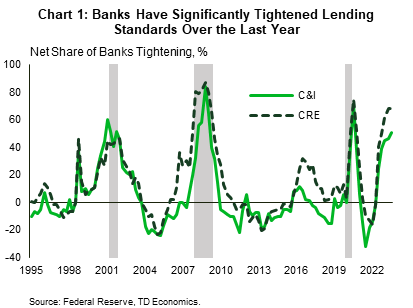
In a world where AI technology dominates boardroom discussions, it’s old-school investment in manufacturing facilities and transportation equipment that’s making a comeback. This not only runs counter to its historical relationship to high interest rates, now at a 22-year high, but also defies the tightening in bank lending standards that should already have pushed these sectors into recession territory (Chart 1).
What’s behind the resilience? The shift towards green technology, efforts to reshore manufacturing and the ongoing pandemic legacy within the transportation sector. The creation of this countercyclical thrust on business investment should persist into 2024 (Chart 2). Although many analysts have cited the consumer dynamics of excess savings and elevated job vacancies as blunting the transmission of higher interest rates on the economy, now it’s time to turn the lens on the investment cycle. Of the two, this one may prove to have more stamina next year relative to its historical relationship and could be yet another factor for the Federal Reserve to consider within the interest rate cycle.
Trade Tensions + Pandemic + Climate Transition = 1-2-3 Punch on Policy Pivot

Trade tensions between the U.S. and China had been growing since 2018 when the Trump administration first began implementing tariffs on trading partners in an effort to lower its trade deficit, while shifting policy from multilateral agreements to bilateral deals. Semiconductors quickly became an area of focus in 2019 when U.S. concerns over national security and intellectual property caused a restriction in shipments to Chinese electronic manufacturers. Then along came the pandemic, that laid bare America’s reliance on semiconductor supply chains when demand soared for household and electronic products that required their use for production. As shortages started to surface, Chinese electronic manufacturers, previously restricted from the U.S. market, began stockpiling from non-U.S. producers, further exacerbating the already dire supply shortage.
With semiconductors quickly elevated to a key national security threat, bipartisan legislation was struck in 2022 via the CHIPS & Science Act -- thus, formally shifting towards industrial policy to reshape the market. The bill offers a combination of subsidies, grants, loans, guarantees and other programs to bolster America’s domestic semiconductor supply chain and promote research & development of advanced technologies. Specifically, the CHIPS & Science Act puts on offer $52.7 billion for semiconductor incentives over five years, provides $170 billion authorization for research & development, as well as a generous 25 percent investment tax credit (ITC) for investments in domestic semiconductor manufacturing. To put this into perspective, past ITCs have only been on equipment, and not structures. And, the prior largest general ITC has been only 10%. So, the size and scope of the current credit for semiconductor facilities marks a huge financial incentive.
Just days after the CHIPS & Science Act was enacted, success was struck with a separate legislation known as the Inflation Reduction Act (IRA). The IRA contains nearly $500 billion in new spending and tax breaks, with nearly 85% of that directed towards climate initiatives. The lion’s share of the climate spending (~270 billion) comes in the form of tax credits, grants, and loans focusing on reshoring clean energy manufacturing, decarbonizing the power sector, and building a clean energy supply chain.
Businesses Step Up to the Plate
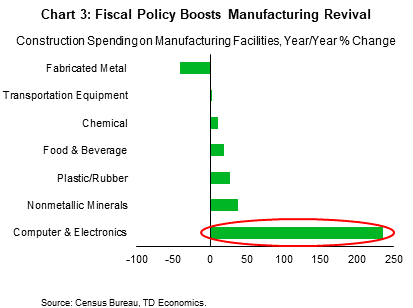
In a short period, the two bills have already catalyzed hundreds of billions of dollars in new investment activity into the construction of new manufacturing facilities for semiconductors, electric vehicles (EVs) and their sub-components, and clean energy production (Charts 3). The majority of these investments are captured by the computer & electronics subcategory, which was launched into exponential growth.
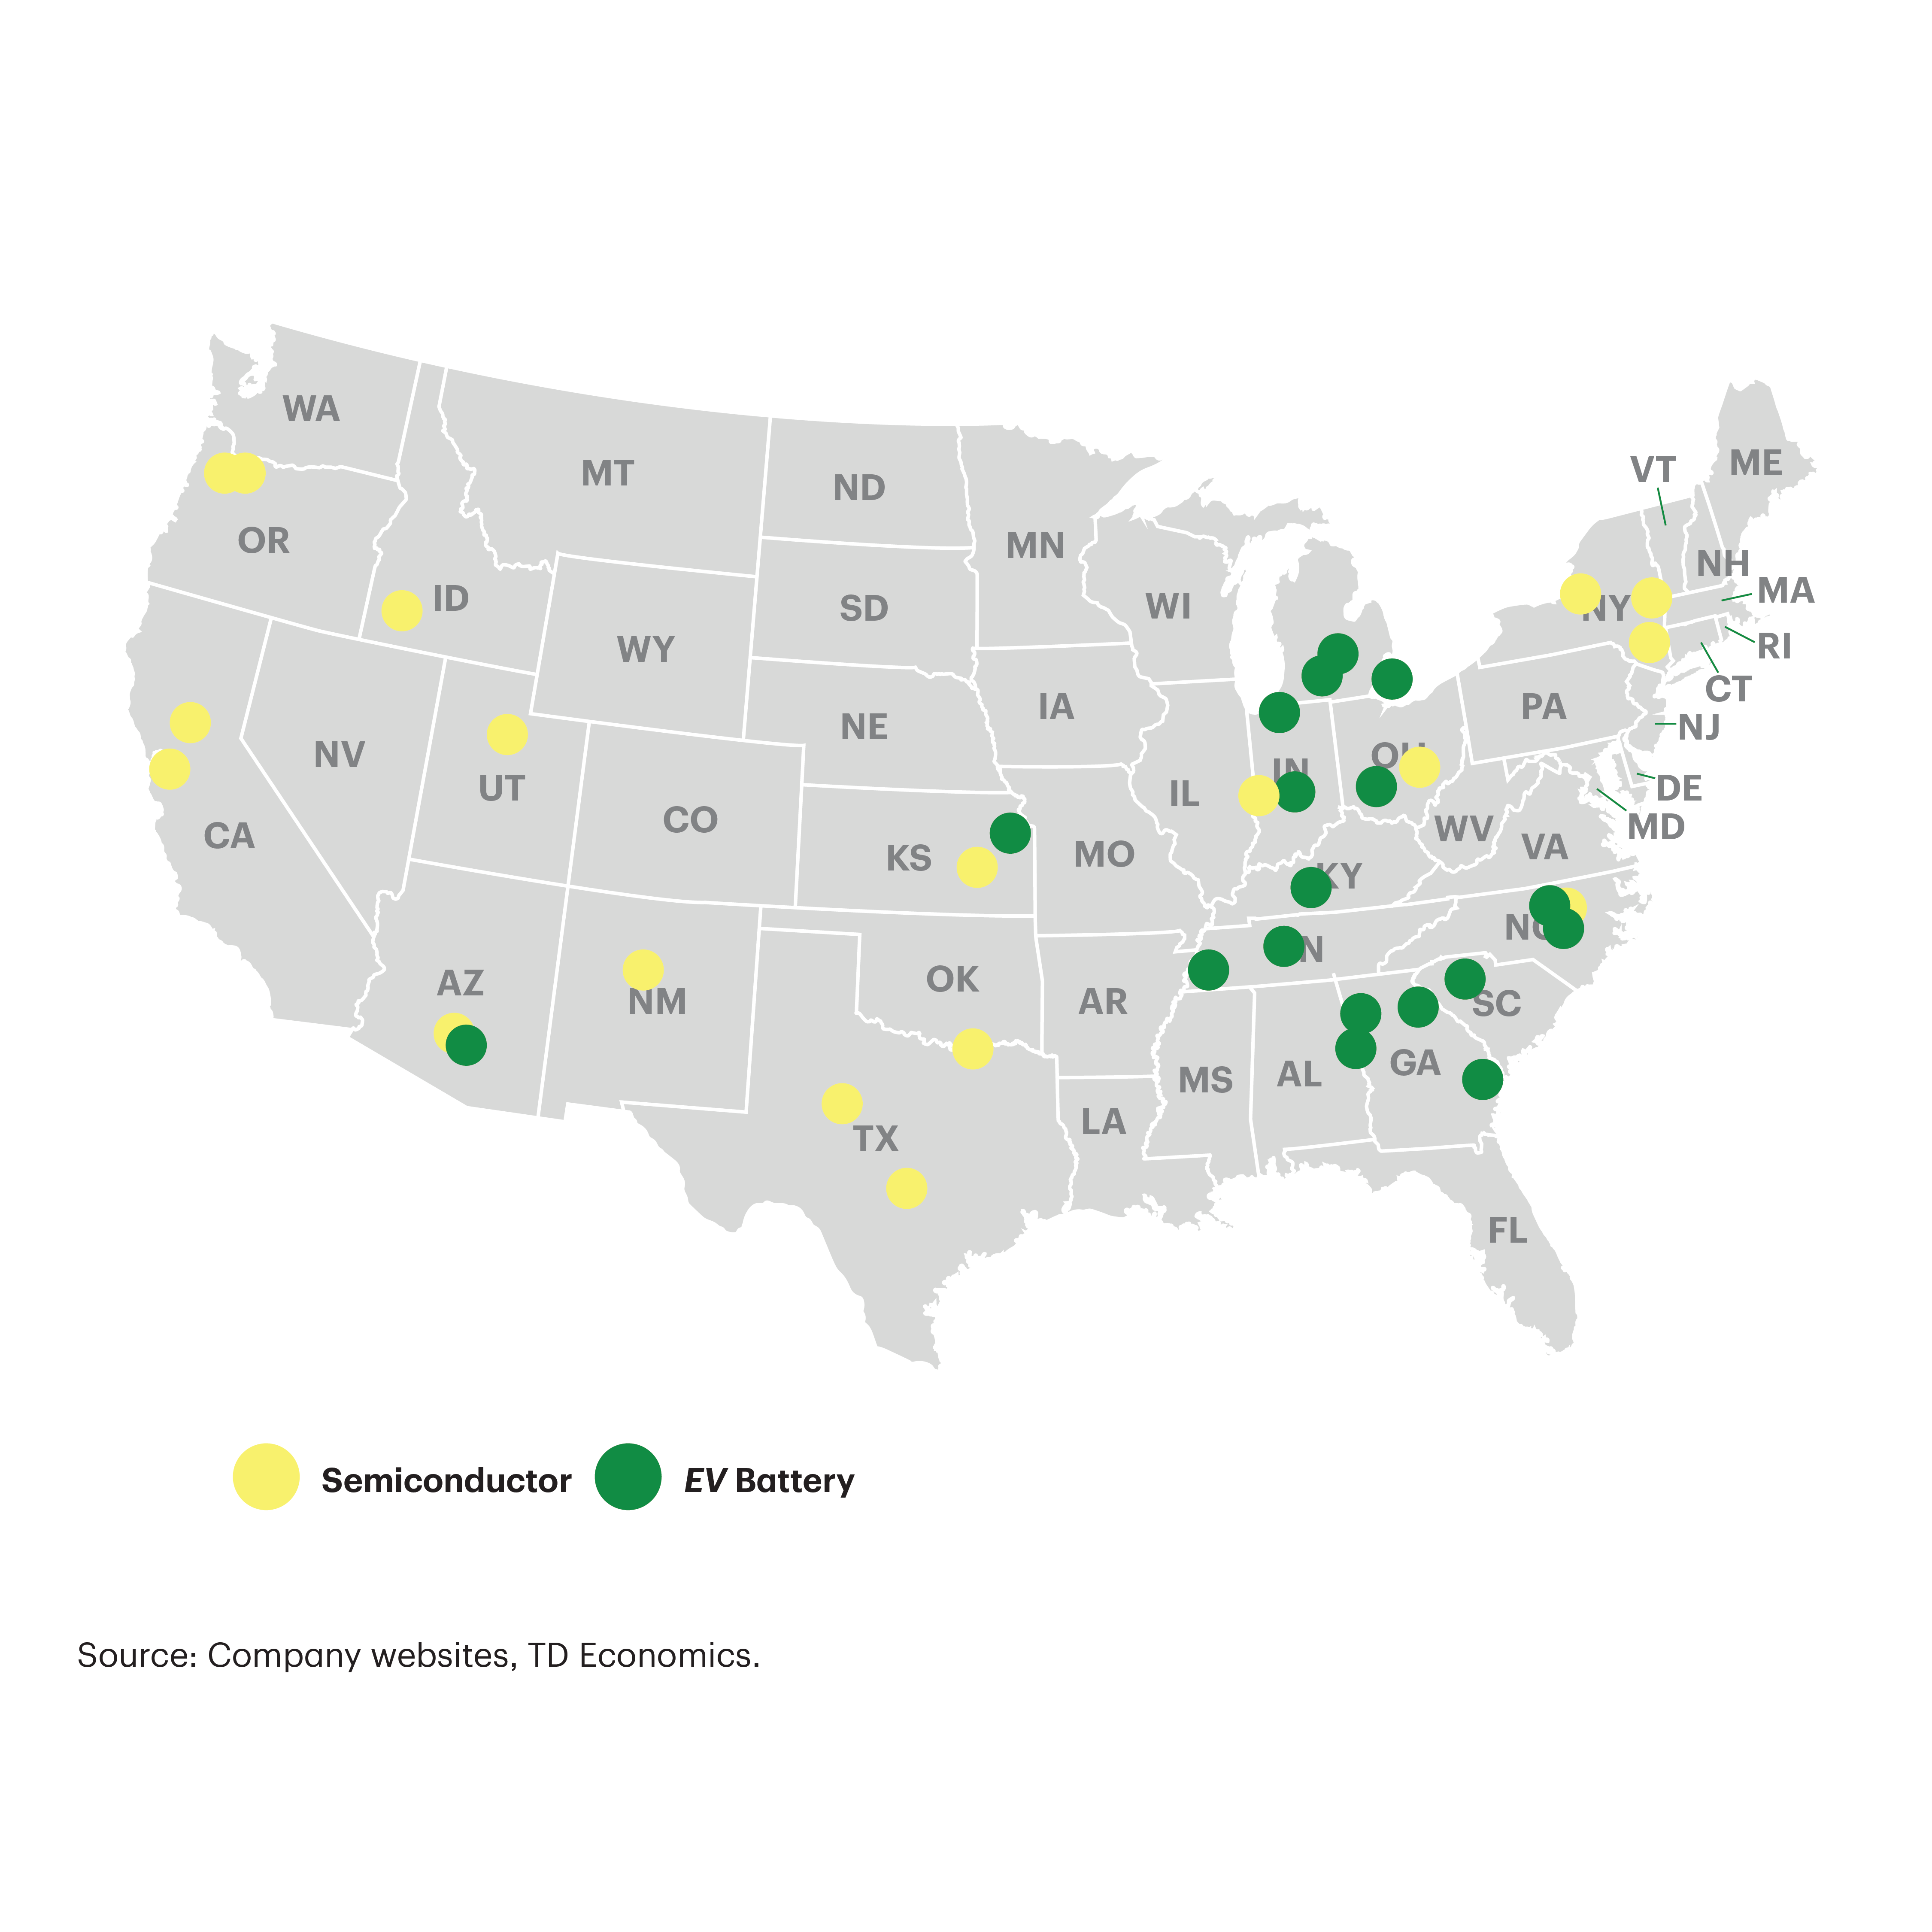
Looking under the hood, the new investments have a broad reach across America, with semiconductor facilities popping up from Oregon to New York, and new EV battery facilities making a presence from Michigan to Georgia (See Map). Most of the EV battery plants are primarily located along the north-south stretch, nicknamed ‘auto alley’ for its historical importance to automobile production. This is no coincidence, as automakers are strategically locating their new EV battery plants within proximity to their current operations. However, this trend is also now reaching into the west coast, where relatively higher EV adoption rates are attracting investments.
The motivation for domestic production of EV batteries created by the IRA is twofold. The first is related to the $10 billion expansion of the Qualifying Advanced Energy Project Credit (also known as 48C). This provides a 30% ITC for qualified investments related to clean energy. During the first window for applications, up to $4 billion was provisionally allocated according to the Treasury, which means that over half of the IRA allocation is still available. The second motivating factor stems from consumer tax credits of up to $7,500 per EV, if certain domestic content requirements are satisfied. Since these requirements become progressively more stringent in the coming years, it has further incented a surge in investment activity.
Geographically, new semiconductor facility investments have shown a wider footprint across America, although the traditional research hubs in the Northeast and California have still benefited from a few new facility announcements (see Map). Proximity to a water source is a key consideration of semiconductor facilities due to production needs, causing new facilities to be proximate to a lake, river, or ocean. Given the light weight of semiconductor chips, shipping costs are less of a priority compared to EV battery production locations.
Ambiguous Project Timelines Increase Forecast Uncertainty

According to the White House, $166 billion of investments related to semiconductor manufacturing and electronics have already been announced since the CHIPS & Science Act was signed into law last year. However, that number underestimates the ‘true’ investment dollar commitment, as it only captures those eligible for the federally allocated tax credit. Total private sector investments are estimated to be closer to $210 billion, with another $50 billion of potential projects currently under consideration. Of the over 60 projects announced, nearly three-quarters of them have an expected production start date of 2025 or sooner (Chart 4). From that perspective, most, if not all, of these projects have likely already broken ground. However, there is still another dozen – totaling over 73 billion of investments – that don’t have production start dates until 2026 or later. This means another wave of structures investment could be unleashed over the coming year. Importantly, without knowing the exact timing of each individual project and capital spend per quarter, the odds rise that forecasters will serially under-predict business investment in the coming years. This is further enhanced as more new project announcements continue to roll out at later dates.
The calculus is even more complicated considering the flow-through to other aspects of business investment, such as equipment spending. Building the manufacturing facility is just the first step of investment. Once the structure is completed, it needs to be outfitted with highly specialized machinery before it becomes operational. And then finally long-term workers enter the picture. History suggests that there is a 4-5 quarter lag between when a manufacturing facility is first started to when demand rises for equipment spending. These historical relationships could get challenged by the global skills shortage in the semiconductor industry that might extend equipment spending and production timelines. However, this doesn’t change the message that lucrative government policy incentives are proving highly effective in returning manufacturing back onto American shores and creating upside risk to investment spending and economic activity in those targeted areas.
Post-Pandemic Recovery Still Muting High Rates
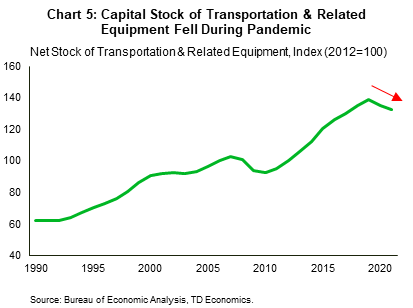
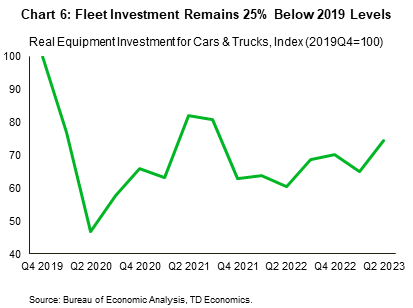
This “fiscal dividend” on investment isn’t the only influence creating economic resilience in a high interest rate environment. The legacy of the pandemic has not fully faded from the transportation landscape. Because of supply-chain issues, the recovery in auto production has been far slower than other sectors. This is maintaining a longer tail on pent-up demand with companies that have been unable to replace aging fleets – as evidenced by the flattening in capital stock (Chart 5). Fast forward to 2023, now that auto production has normalized to pre-pandemic levels, this still leaves manufacturers fulfilling multiple years of backlogged orders. In the second quarter alone, investments in fleet (i.e., large & small trucks and passenger vehicles) increased by 70% (annualized). Despite this, fleet investments remain 25% below pre-pandemic levels, leaving more ground to cover over the coming quarters (Chart 6).
A similar story is playing out within the aircraft space, where pandemic lockdowns disrupted travel and injected considerable uncertainty on the long-term outlook for the industry. However, the tide has shifted and 2023 travel demand has returned to pre-pandemic levels. Aircraft investments subsequently soared by 104% in the second quarter, accounting for nearly half of the 6.2% quarter-over-quarter gain in total business investment.
Implications for the Federal Reserve
From the Federal Reserve’s perspective, the countercyclical push on business investment complicates its immediate fight against inflation. Business investment has historically been quick to respond to higher interest rates and tighter credit conditions. But not this time. The federal funding that companies are receiving through the IRA and CHIPS & Science Act are just the tip of the iceberg. States and municipalities are competing for every dollar of new investment by offering additional incentives to be the destination of choice for new facilities. In most instances, this takes the form of direct grants, infrastructure investments (site preparation, roads, etc.), tax rebates, and workforce training funding. On average, these subnational subsidies make up roughly 30% of the total funding package provided to companies.
In some cases, the combined federal and state & local funding packages are offsetting most, if not all, of the rise in financing costs over the past 18 months. In other words, the Federal Reserve’s dramatic 5.25 percentage point hike has been no match for government incentives that allow the economics of these projects to work. Even under lesser subsidies, companies would likely have maintained an eye to the future in carving out a global competitive position. This is why there appears to be an atypical correlation between interest rates and business fixed investment.
From that perspective, the Federal Reserve may still have to raise interest rates further in order to achieve a sufficient degree of monetary restriction to cool the economy and return inflation to 2%. Alternatively, the slower transmission of interest rates may compel the central bank to leave rates higher for longer within 2024. Whichever the path, one thing is certain: the economy is still running too hot to cool inflation. Economic growth is tracking nearly 4% (annualized) for the third quarter, and even if activity were to completely stall in the following quarter, this year will still perform better than last year, despite interest rates being significantly higher.
We know that monetary policy acts with long and variable lags. This cycle is certainly testing that paradigm. A confluence of forces ranging from stimulative fiscal policy, unprecedented levels of household excess savings and persistent labor shortages have all helped blunt the speed at which higher interest rates can cool the economy. However, with excess savings nearly depleted and the labor market already showing signs of coming back into better balance, the consumer sector is likely to reflect the hangover from higher interest rates more acutely over the coming quarters. It’s not certain the same can be said on this segment of business investment.
However, it’s important to remember that most other investment areas are not privy to the hefty subsidy benefits and will be absorbing the full-frontal impact of higher rates. This lends some confidence that the Fed rate hike cycle is nearing a peak, even if we cannot have strong conviction that 5.50% marks the end of that road. Should the Fed embark on more interest rate hikes, the main message is that it would be doing so in the face of economic resilience, and not on the back foot of an economy that lacks a solid foundation.
Disclaimer
This report is provided by TD Economics. It is for informational and educational purposes only as of the date of writing, and may not be appropriate for other purposes. The views and opinions expressed may change at any time based on market or other conditions and may not come to pass. This material is not intended to be relied upon as investment advice or recommendations, does not constitute a solicitation to buy or sell securities and should not be considered specific legal, investment or tax advice. The report does not provide material information about the business and affairs of TD Bank Group and the members of TD Economics are not spokespersons for TD Bank Group with respect to its business and affairs. The information contained in this report has been drawn from sources believed to be reliable, but is not guaranteed to be accurate or complete. This report contains economic analysis and views, including about future economic and financial markets performance. These are based on certain assumptions and other factors, and are subject to inherent risks and uncertainties. The actual outcome may be materially different. The Toronto-Dominion Bank and its affiliates and related entities that comprise the TD Bank Group are not liable for any errors or omissions in the information, analysis or views contained in this report, or for any loss or damage suffered.
Download
Share: