Highlights
- The resilience of the U.S. consumer has so far helped the U.S. to avert continuing calls for a notable economic slowdown as the Federal Reserve has raised interest rates at a rapid pace.
- Consumers have come under increasing pressure. On the upside, they still have healthy balance sheets coming out of the pandemic and a robust labor market has lent support. However, headwinds such as growth in consumer debt, reduction in credit availability and resumption of student loan payments are blowing more strongly.
- After a strong third quarter, we expect consumer spending to slow notably in the fourth quarter, with weekly spending data pointing to a cooling in September. Spending is forecast to remain sub-par next year, decelerating from our projection of 2.5% this year to around 1.3% in 2024, before rebounding in 2025.
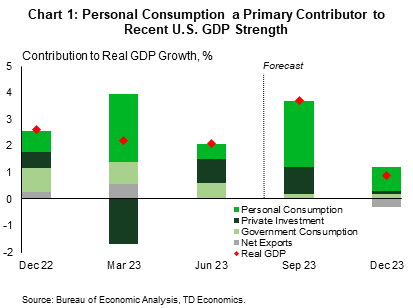
The consumer is the backbone of the US economy, with personal consumption expenditures accounting for over two-thirds of GDP. That has remained true in recent quarters, with consumer spending a major contributor to above-expectations economic growth (Chart 1). The economic environment however is changing quickly. Inflation is cooling but still above target, interest rates are high and expected to remain so for longer and lenders are tightening credit standards. So far, consumers have faced these challenges riding a high from healthy balance sheets and a tight labor market, but several forces are set to test them as we head into the fourth quarter.
Solid Balance Sheets and Hot Job Market Boost Consumers
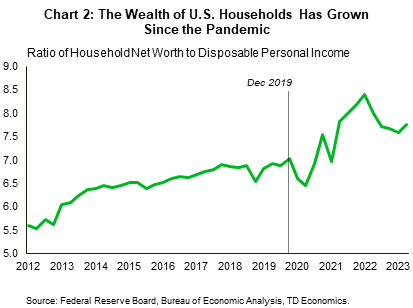
A main source of strength for consumer spending has been healthy gains in household wealth coming out of the pandemic. There are three intersecting elements that have provided support. First, relatively high net worth. Households have a net worth of approximately $148.8 trillion, just slightly below the all-time high of $152.6 trillion hit in early 2022, when households’ balance sheets benefitted from an influx of funds due to government stimulus payments and a supercharged stock market (Chart 2). It is also 27.5% higher than their balance in 2019 Q4, just prior to the most severe effects of the pandemic. With wealth still sharply higher compared to pre-pandemic, households continue to have a significant reserve to withstand mounting economic headwinds.
Part of the buildup in net worth has been the accumulation of “excess savings”. That is, the nest egg consumers accumulated during the pandemic as spending was constrained, and income bolstered by fiscal stimulus. We estimate that at its peak in 2021 Q3, consumers accumulated approximately $2.3 trillion in excess saving. That cushion has fallen to just over $1 trillion as of 2023 Q2. This is expected to continue bolstering household balance sheets even into 2024, providing greater resilience to negative economic shocks.
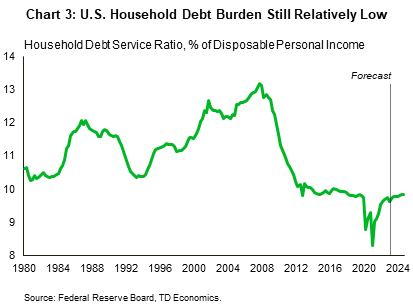
Finally, on the liabilities side of the balance sheet, a low debt burden has provided some protection against higher borrowing costs. Debt service payments for U.S. households as a percentage of disposable income – their debt service ratio – is at a historically low 9.6% (Chart 3). Put another way, consumers have never been less exposed to higher interest rates than in the current tightening cycle. Though the ratio is projected to rise marginally in the months ahead, it is expected to remain below its long-term average of around 11%. Many consumers locked in rates on longer-term debt when interest rates were low. As such, they have not been impacted by the substantial increase in interest rates over the past 18 months. This low debt service burden is likely to continue being a key factor in boosting consumers’ resilience in the near term.
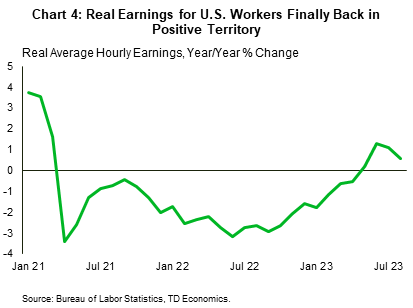
The resilience of the labor market has also been a key support to consumer spending. With inflation falling, real wages are rising again (Chart 4). Real average hourly earnings are up 0.5% in the 12 months ended in August. Real earnings turned slightly positive in May, but prior to that, had been negative for much of the last two years – the longest stretch of negative real earnings on record. With real wages now rising, consumers are less likely to need to supplement income with excess savings or additional debt.
But Cracks are Starting to Show in their Armor
While there are plenty of reasons for optimism about consumer spending for the remainder of 2023, the path forward does contain obstacles to a continued robust pace in spending. These obstacles include rising consumer debt levels, higher interest rates and credit standards, and the resumption of student loan repayments. Given these forces, it is perhaps not surprising consumers have also been losing confidence lately.
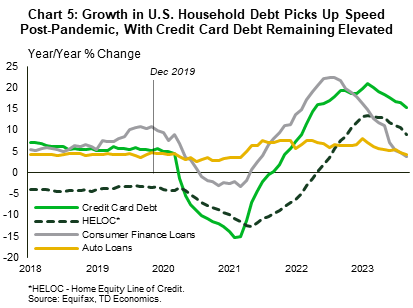

With high inflation over the past two years, some consumers have been turning to credit to fill the gap. This has resulted in a rise in consumer debt, particularly non-mortgage debt (Chart 5). Both auto loans and credit card balances have trended up in recent months, primarily reflecting higher transactional prices as opposed to increased volumes. The New York Fed reported that consumers’ credit card balances increased by $45 billion to reach a series high of $1.03 trillion in the second quarter of 2023 – this represents 5.2% of disposable income, just shy of the 5.9% the series attained in 2019 Q4. Auto loan balances rose by $20 billion in the same period, consistent with the upward trajectory seen since 2011. What’s interesting is that there has been a notable increase in auto loan originations for longer maturities (i.e., 76 months or greater) as consumers seek to lower monthly payments amid rising rates and vehicle prices (Chart 6). Nonetheless, despite the nominal rise, viewed as a share of disposable income, post-pandemic auto loan balances peaked at 8.1% in 2022 Q3 (the same figure as 2019 Q4) and have since been trending downwards to around 7.8% in the second quarter, suggesting higher rates are having a dampening impact. Mortgage related loan balances were largely unchanged from the previous quarter as mortgage rates hovered near a 21-year high in the quarter.
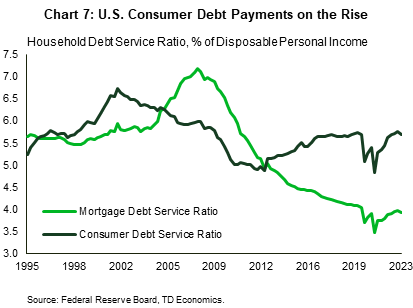
This underscores a divergence beneath the surface of the relatively low trajectory for the debt service ratio. While the debt service ratio (DSR) for mortgage loans (3.9%) is still below its pre-pandemic high of 4.04% reached in 2020 Q1, the consumer debt service ratio (5.7%) has surpassed its most recent high of 5.07% for the same period (Chart 7). This highlights a fundamental difference in the structure of the two loan markets. Mortgages are generally locked in on a fixed rate for a long period, whereas consumer loans more readily adjust to changes in market rates. The DSR for mortgages therefore is still benefitting from the period of low interest rates, whereas most consumer loans have already adjusted to the new higher rates resulting in higher debt service payments. The rise in consumer loan balances is likely to pose challenges for some consumers in the coming months as they attempt to fit higher repayments into their budgets.
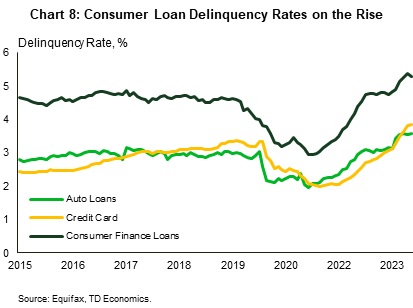
This is already starting to show as delinquency rates, which though still relatively low, are starting to trend upwards for several consumer loan categories (Chart 8). In line with rising loan balances, delinquency rates for credit cards and auto loans, have surpassed their level just prior to the pandemic. This gives greater cause for concern, since the current unemployment rate as of August 2023 (3.8%), is roughly in line with what it was in December 2019 (3.6%). With expectations for unemployment to rise in the future, there could be a further uptick in delinquencies on the horizon.
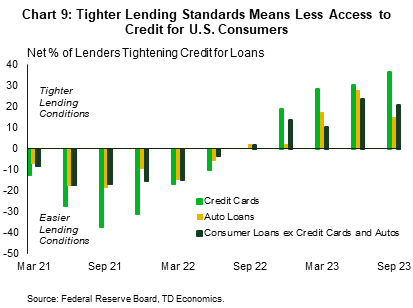
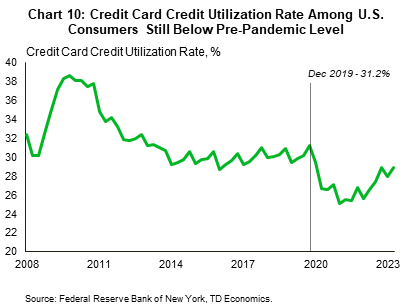
With delinquency rates rising, an uncertain economic environment, and recent bank stresses, lenders have seized the reins on credit expansion. The most recent Fed Senior Loan Officer Opinion Survey found that lenders had generally tightened credit standards on all consumer loan categories, with a net 36.4% (up 6 ppts from previous) reporting tighter credit standards for credit cards (Chart 9). Tighter credit standards have largely coincided with a pullback in demand from consumers as higher interest rate bite. However, for consumers who want or need access to credit, it presents an obstacle and poses a challenge to their ability to spend. Case in point, while banks reported that demand was weaker for auto loans and other consumer loans over the second quarter, demand for credit card loans remained basically unchanged. This combined with the sizeable increase in credit card balances observed over the quarter, suggests that consumers are still using credit cards to supplement spending. Restricting access to credit card loans could therefore result in a dip in consumer spending. One thing that may offset the effect of this on consumer spending is the still relatively low level of the credit utilization rate on credit cards. At 28.9%, this measure is still below its immediate pre-pandemic high of 31.2% (Chart 10). This suggests that there is room for consumers to access credit, which is already available to them, even as banks tighten credit standards and limit new credit issuance.
Another headwind set to blow consumer’s way is the resumption of student loan payments. The three-and-a-half-year pandemic-induced moratorium expired at the end of August, with repayments beginning in October 2023. This will affect approximately 27 million student loan borrowers. To the extent that these individuals were using diverted student loan payments to fund consumption or to take on other loan obligations as recent research has suggested1, then resuming payments is expected to tap the breaks on spending and increase budgetary strain. In a previous report we estimated that this is likely to shave up to 0.3 percentage points from consumption spending by the middle of next year.
Given all these challenges it is perhaps not surprising that consumer confidence has pulled back recently. While several surveys which seek to measure the mood of consumers turned upbeat in earlier months relative to more lackluster performance immediately post-pandemic, the most recent reading on these surveys have pared back much of those gains. The Conference Board consumer confidence index in July for example, rose to the highest level in over a year and a half. By September however, that boost reverted on signs that the job market is starting to cool and on concerns about the economic outlook. Similarly, the most recent New York Fed survey of consumer expectations found that households’ perceptions about their current and future financial situation deteriorated. The key takeaway is that consumers have recently become a bit more cautious about their economic prospects. This development could hinder spending as studies have shown that measures of confidence do contain information about and predictive power for the future path of consumer spending growth.2
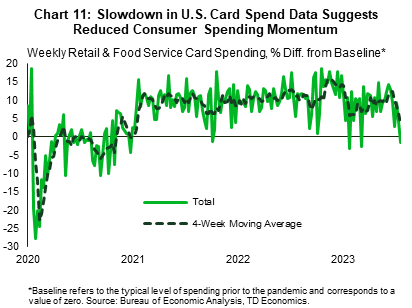
That more downbeat mood appears to be showing up in the American consumer’s use of cards (credit, debit, and gift cards) for retail spending. Weekly card spending data shows a loss of momentum through mid-September (Chart 11), setting up a soft start to fourth quarter consumer spending.
Putting it All Together
With both push and pull factors acting on consumers, the question is whether the strength of consumers’ balance sheets will hold up amid the Fed’s aggressive tightening cycle. This largely hinges on the labor market and whether it will remain strong enough to keep real wages positive as the Fed continues to fight inflation. The most recent evidence suggests that there may still be some steam left in the job market, countering previous evidence of gradual cooling. Trend job growth rebounded in September while labor force participation, wage growth and the unemployment rate all held steady. These developments suggest some support for future wage growth which could stoke inflationary pressures and increases the probability of further rate hikes. On the flipside, a strong labor market also bolsters consumers’ willingness and ability to spend. Thus, the outcome will depend on which the Fed’s rate hikes will cause to happen faster – falling inflation or a softening labor market.
We ultimately expect that slower employment growth, will result in a deceleration in income growth. The impact of this on spending for the remainder of 2023 however will be partially offset by consumers accumulated savings buffer. Already, recent data (August PCE report) is pointing to consumers ability to keep spending in the third quarter, even as risks to their budgets mount. However, more recent high frequency spending indicators (Chart 11) suggest spending is losing momentum, and we expect spending to slow to between 1-2% in the fourth quarter (see recent forecast).
Next year, spending is expected to slow even further as the effects of higher rates, tighter credit and the cooling job market outweigh consumers’ savings buffer. This is expected to have a pronounced effect on discretionary spending as consumers retrench to meet obligations, resulting in spending growth below 1% annualized for the first half of 2024. On an annual average basis real consumer expenditure should decelerate from our projection of 2.5% this year to around 1.3% next year, before rebounding in 2025.
End Notes
- See Dinerstein, Michael and Yannelis, Constantine and Chen, Ching-Tse, Debt Moratoria: Evidence from Student Loan Forbearance (May 8, 2023). University of Chicago, Becker Friedman Institute for Economics Working Paper No. 2023-62
- See Carroll, Christopher D., et al. “Does Consumer Sentiment Forecast Household Spending? If So, Why?” The American Economic Review, vol. 84, no. 5, 1994, pp. 1397–408. Also see: Ludvigson, Sydney, C. 2004. “Consumer Confidence and Consumer Spending.” Journal of Economic Perspectives, 18 (2): 29-50.
Disclaimer
This report is provided by TD Economics. It is for informational and educational purposes only as of the date of writing, and may not be appropriate for other purposes. The views and opinions expressed may change at any time based on market or other conditions and may not come to pass. This material is not intended to be relied upon as investment advice or recommendations, does not constitute a solicitation to buy or sell securities and should not be considered specific legal, investment or tax advice. The report does not provide material information about the business and affairs of TD Bank Group and the members of TD Economics are not spokespersons for TD Bank Group with respect to its business and affairs. The information contained in this report has been drawn from sources believed to be reliable, but is not guaranteed to be accurate or complete. This report contains economic analysis and views, including about future economic and financial markets performance. These are based on certain assumptions and other factors, and are subject to inherent risks and uncertainties. The actual outcome may be materially different. The Toronto-Dominion Bank and its affiliates and related entities that comprise the TD Bank Group are not liable for any errors or omissions in the information, analysis or views contained in this report, or for any loss or damage suffered.
Download
Share: