The Weekly Bottom Line
Our summary of recent economic events and what to expect in the weeks ahead.
Date Published: July 12, 2024
- Category:
- Canada
U.S. Highlights
- U.S. inflation eased by more than expected in the month of June, raising the likelihood of a September rate cut.
- Small business confidence continued to edge higher in June, though several forward-looking indicators suggests some softening in the months ahead.
- Eyes will be on Chair Powell’s appearance in DC next week for a reaction to this week’s CPI data.
Canadian Highlights
- Taking the lead from the U.S., Canadian yields took a dive this week as a softer-than-expected U.S. CPI report raised the odds of the Federal Reserve easing its policy rate earlier than previously expected.
- Home sales picked up in June, although benchmark home price growth remained subdued – a welcome sign for consumer inflation.
- CPI will be next week’s headliner. Core inflation likely eased, but not enough to fully support a July rate cut.
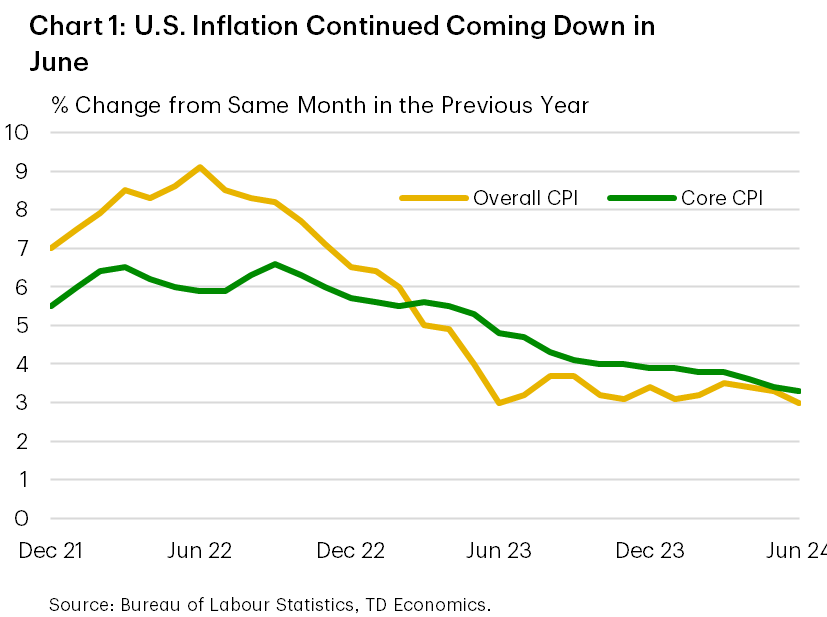
Federal Reserve Governor Lisa Cook said on Wednesday this week that the “soft landing” was starting to line up in U.S. data, a statement that, while intended to be backward-looking, may have been an unexpected act of prescience. A day later, the CPI report for June was released and as we wrote in our commentary yesterday, the report was exactly what the FOMC was looking for. The pace of inflation eased for both headline and core, as shown in Chart 1.
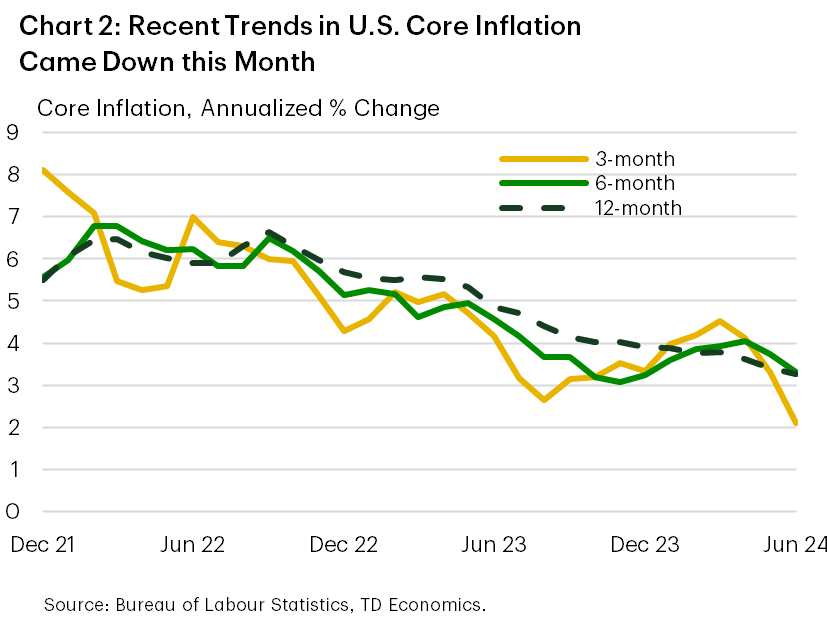
Defying expectations for modest gain of 0.1% from the previous month, headline CPI declined 0.1%. Core prices increased by a ‘soft’ 0.1%, compared to the 0.4% monthly gain averaged in the first 3 months of the year. By almost all measures, this is perhaps the most promising CPI report the FOMC has seen since it stopped raising interest rates just under a year ago. In Chart 2, we can see how how much this release brings down recent trends in CPI. The possibility of a September rate cut was already live, especially as concerns have been mounting over how quickly the labor market has been cooling– now we expect it to be at the forefront of the Fed’s decision-making.
Aside from the CPI report, it was a fairly light week for U.S. data. We did see the release of the NFIB Small Business Optimism Index, which generally painted a still upbeat picture for small businesses. However, there were hints of soft landing throughout the release, including a further easing in the share of firms planning to raise prices and further evidence that the labor market is cooling, with hiring intentions remaining handily below pre-pandemic levels.
We already mentioned Governor Lisa Cook’s speech which signaled, even before the last release of the CPI data, that prices, labor markets, and economic activity were evolving constructively in the eyes of the Fed. Chairman Powell offered a similar observation in his testimony to the Senate Committee on Banking, Housing, and Urban Affairs the day before. The Fed chairman made the point in his testimony that they see risks to the Fed’s dual mandate as more balanced than earlier this year when inflation had turned meaningfully higher. More balanced risks means the Federal Reserve will not delay rate cuts too long for fear of cooling the economy and the labor market too much.
Next week, attention will shift to the June readings of retail sales and housing starts as investors try and gauge to what extent domestic activity has slowed alongside the recent cooling in the labor market. We also look ahead to Chairman Powell’s appearance at the Economic Club of Washington on Monday, which is the first time we will hear from a voting FOMC member following this week’s inflation data. With the trend on inflation lower, and a number of employment metrics showing increasing slack building in the labor market, Powell will likely use next week’s appearance to start priming markets for a September cut.
Vikram Rai, Senior Economist | 416-923-1692
Even with no week-shortening holiday to blame it on, there was a paucity of major Canadian economic data this week. Instead, Canadian markets were left to take their cues from developments elsewhere. In oil markets, prices were flat, as an improved summer demand backdrop faced off with easing supply concerns. Elsewhere, the benchmark 10-year bond yield followed its U.S. counterpart lower, after a soft U.S. CPI inflation print raised the expectation that the Federal Reserve could be getting closer to cutting its policy rate. This same factor also helped propel a gain in the TSX this week. Meanwhile, the Canadian dollar was broadly unchanged during the week and has been range-bound for nearly 2 years.
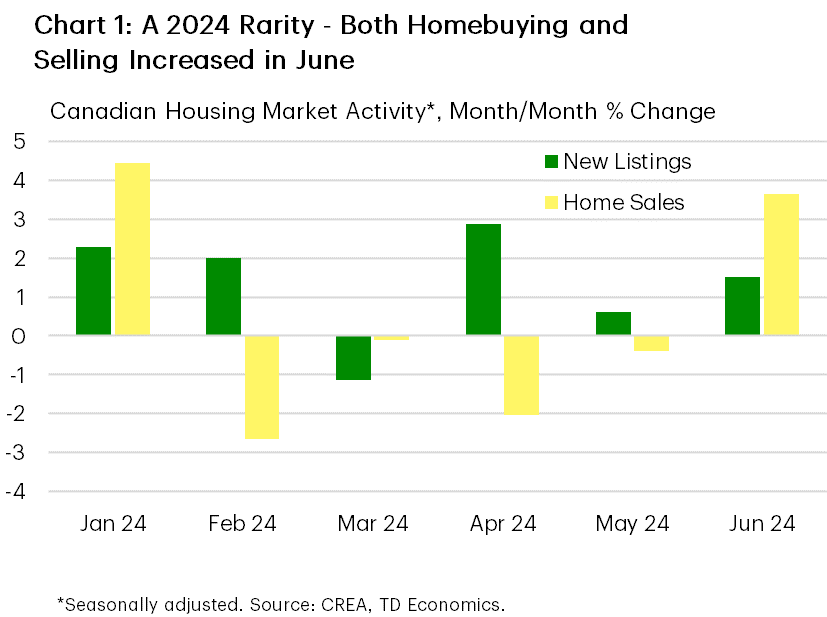
The week did offer a look at how Canadian housing markets performed in June and as it turns out, both buyers and sellers were more active, although sales levels remained low (Chart 1). A drop in interest rates during the month likely played some role in enticing buyers back into the market. Listings also picked up, posting their 5th increase in 6 months and offering buyers more choice. For their part, the Bank of Canada was likely pleased with the report, as overall economic growth was boosted by rising home sales. What’s more, the mild performance in benchmark prices suggests that the underlying trend in home price inflation remains subdued – a meaningful development for the CPI.
The real data fireworks come next week, with the Bank of Canada’s Business Outlook Survey (BoS) and Survey of Consumer Expectations on Monday and the June CPI report on Tuesday. Markets will also receive a pulse-check on the consumer via the retail trade report on Friday. On the latter, Statcan’s preliminary estimate suggests that retail spending dropped 0.6% month-on-month in May, offering some contrast to the gain shown in TD’s internal credit and debit card data. However, these same metrics point to a spending slowdown in June. A key takeaway from the prior BoS was that 2-year inflation expectations continued to decline while firms’ pricing behaviour further normalized in the first quarter. We’ll be looking for a continuation of these trends in the second quarter report. Economic growth indicators are also part of the Survey, but we’ve had plenty of other data showing the Canadian economy’s resilience in Q2, including decent job gains in the first two months of the quarter, an above-trend GDP growth print in April, and a preliminary estimate showing another monthly gain in May.
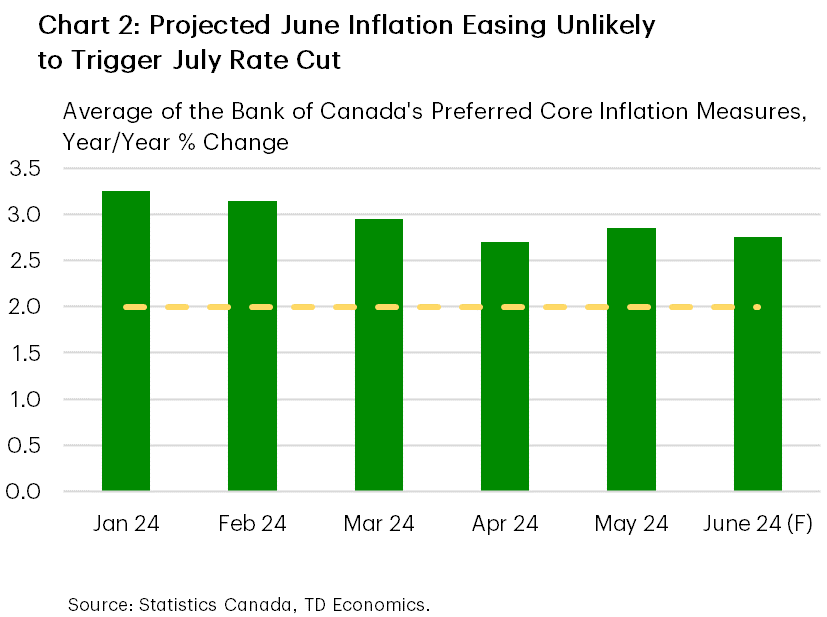
However, the inflation report will be the marquee print of the week. We expect that the average of the Bank of Canada’s preferred core inflation measures dipped to 2.8% year-on-year from 2.9% in May (Chart 2). If it materializes, this result would obviously be an improvement, although probably wouldn’t be enough to tip the scales in favour of a July rate cut. Indeed, the Bank’s next move is likely to come in September, which is when markets have the next rate cut fully priced-in.
Rishi Sondhi, Economist | 416-983-8806
Disclaimer
This report is provided by TD Economics. It is for informational and educational purposes only as of the date of writing, and may not be appropriate for other purposes. The views and opinions expressed may change at any time based on market or other conditions and may not come to pass. This material is not intended to be relied upon as investment advice or recommendations, does not constitute a solicitation to buy or sell securities and should not be considered specific legal, investment or tax advice. The report does not provide material information about the business and affairs of TD Bank Group and the members of TD Economics are not spokespersons for TD Bank Group with respect to its business and affairs. The information contained in this report has been drawn from sources believed to be reliable, but is not guaranteed to be accurate or complete. This report contains economic analysis and views, including about future economic and financial markets performance. These are based on certain assumptions and other factors, and are subject to inherent risks and uncertainties. The actual outcome may be materially different. The Toronto-Dominion Bank and its affiliates and related entities that comprise the TD Bank Group are not liable for any errors or omissions in the information, analysis or views contained in this report, or for any loss or damage suffered.
Download
Share: