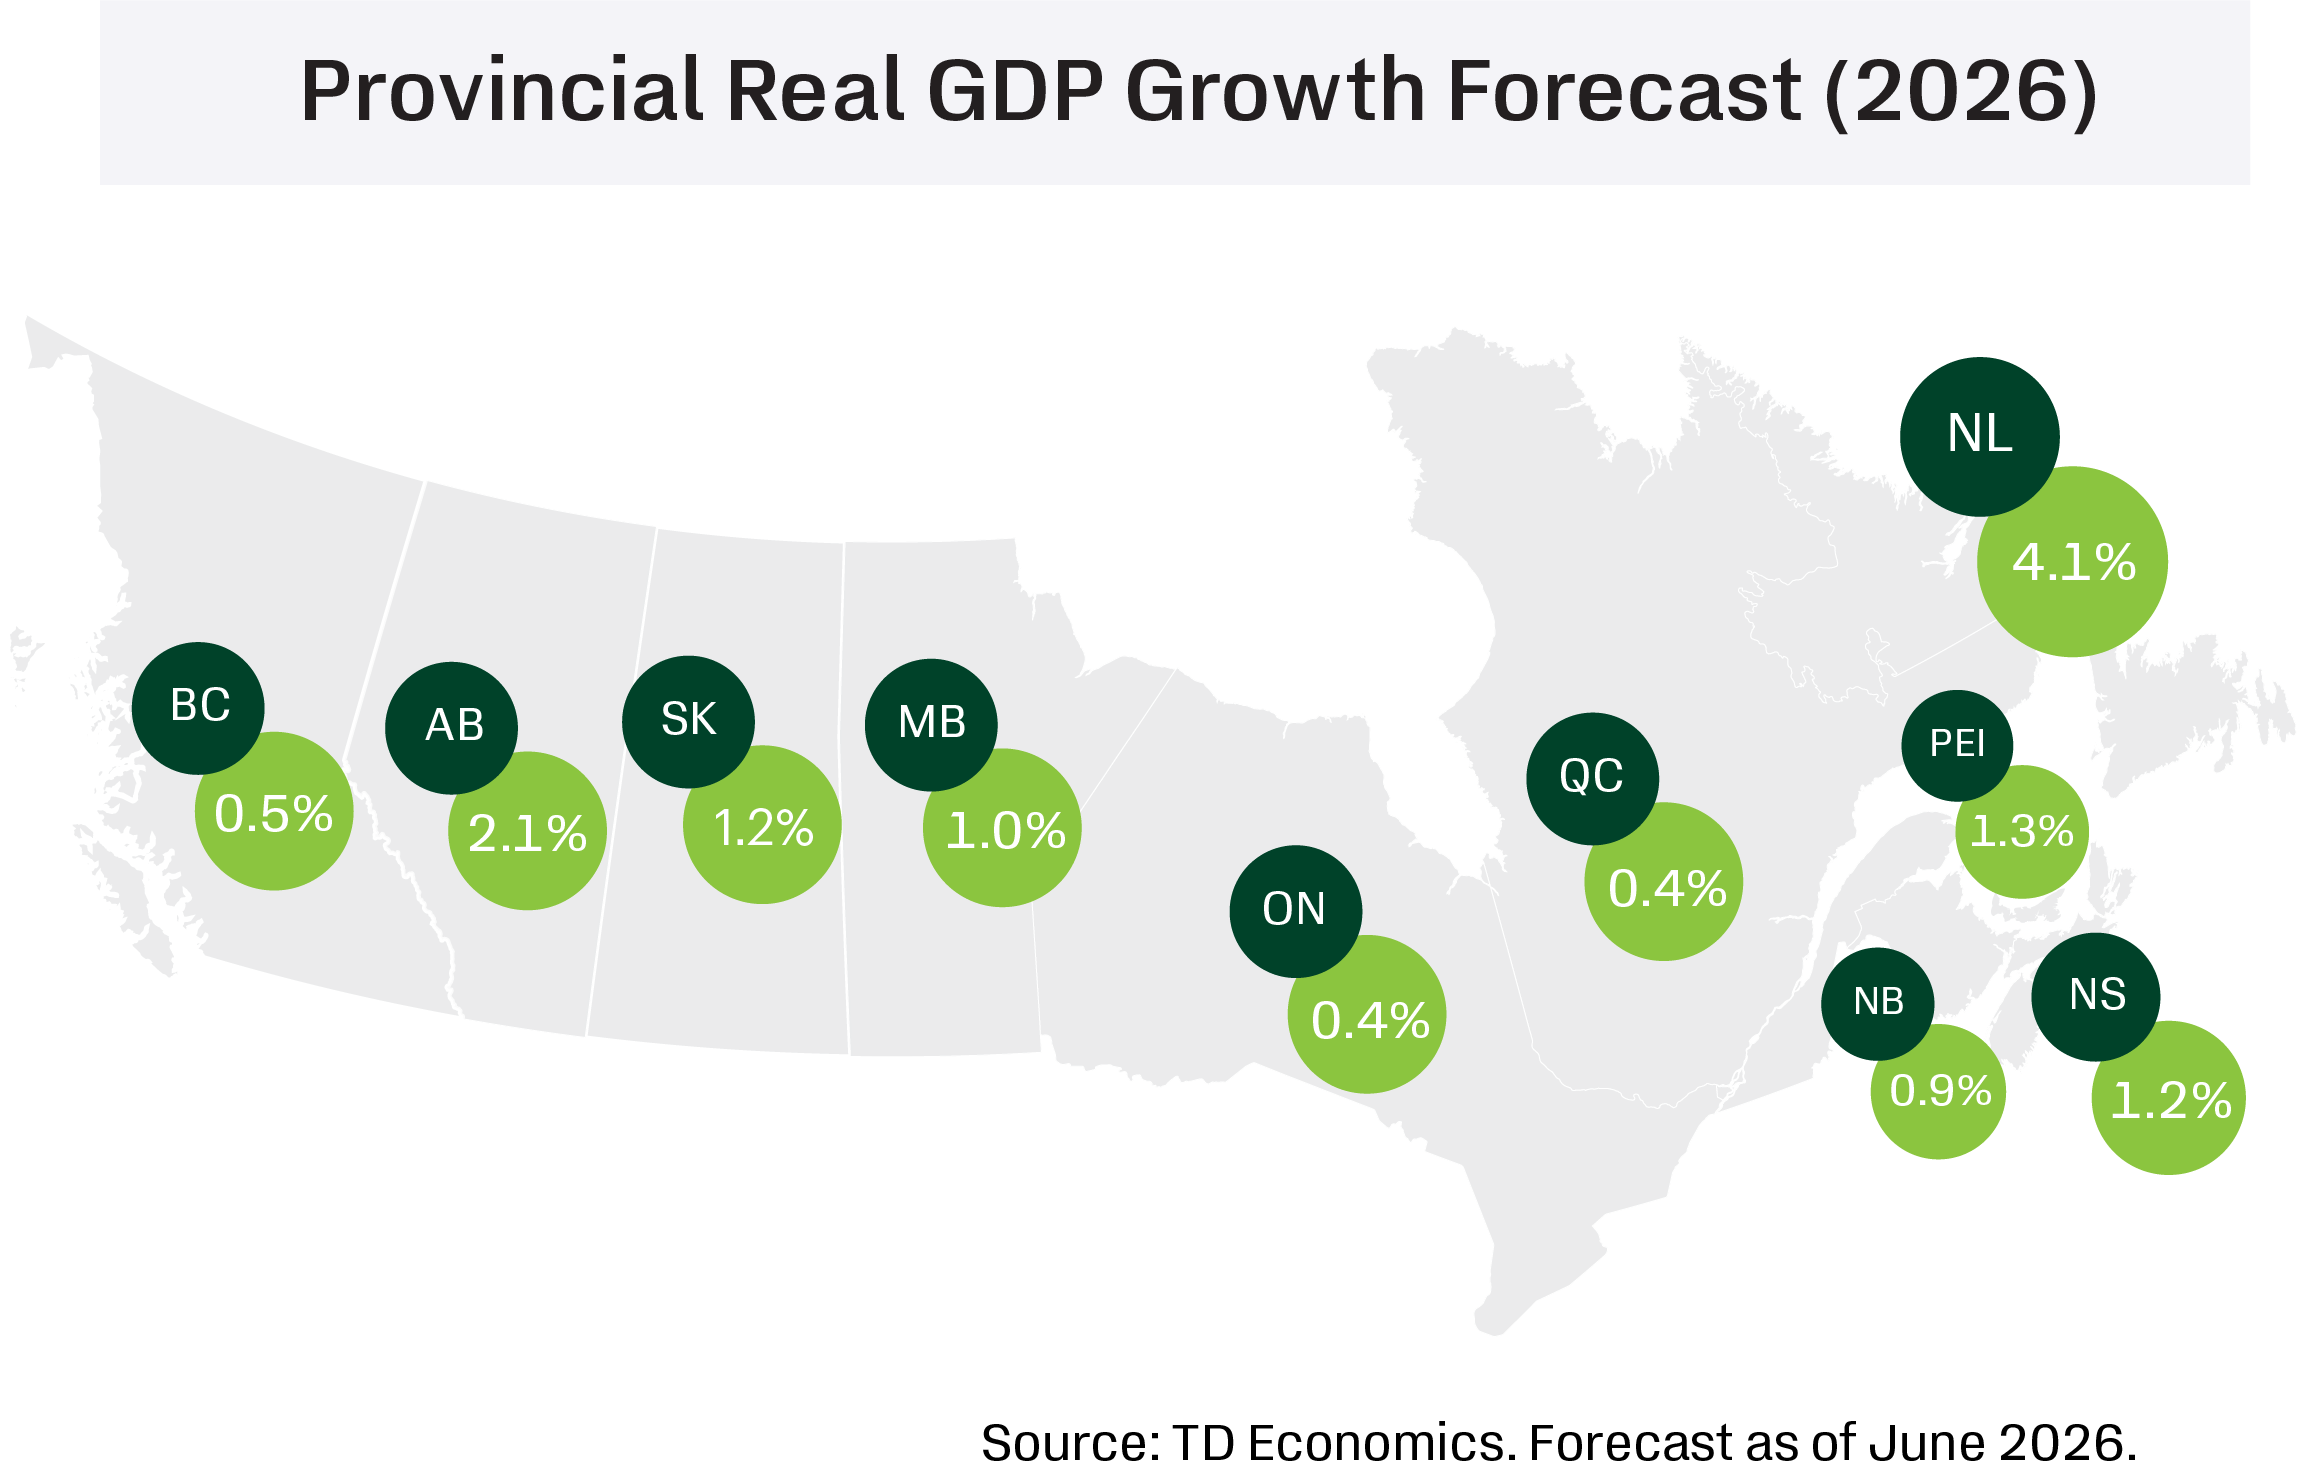
- The soft start to the year for the Canadian economy appears broad-based, underpinning 2026 real GDP growth downgrades across provinces, particularly in Ontario, B.C. and parts of the Atlantic. The picture is better in per capita terms, with positive growth expected across all provinces this year, led by Newfoundland and Labrador.
- A rebound in employment in May offered a modest lift to labour markets after a soft first quarter, but data volatility continues to cloud the underlying trends. Population growth is slowing sharply, with outright declines in Ontario, Quebec, and B.C. leading to smaller labour forces. This should help cap increases in unemployment, even as hiring slows to a near-standstill.
- The U.S.-Iran conflict has lifted global energy prices, providing a meaningful revenue and income boost to oil- producing provinces—particularly Alberta and Newfoundland and Labrador. Prices are expected to moderate through the back half of the year as Middle East tensions ease, though the outlook is highly uncertain. Higher fuel costs are weighing on households and businesses, especially in Central Canada.
- Provincial budget season has wrapped up, with deficits and net debt (both as a share of GDP) set to rise in aggregate this year. While FY 2026/27 program spending is set to gear down across provinces, weighing on GDP, committed public capital spending plans remain an important source of support. New initiatives were targeted rather than transformative, including measures such as the removal of the PST on groceries in Manitoba and tax cuts for businesses and new home purchases in Ontario.
- Canadian home sales in the second quarter are tracking broadly in line with our prior projection, led by Ontario, while price growth is somewhat stronger. We continue to expect a gradual recovery through next year, with modest improvements in Ontario and B.C. (supported by pent-up demand), partly offset by cooling activity in other regions amid scant population growth.
- The July 1 CUSMA review deadline is nearing, but timely renewal looks unlikely as talks have yet to pick up. Trade uncertainty remains elevated as the U.S. stays committed to tariffs. Ontario, Quebec, and B.C. are most exposed given their reliance on manufacturing and trade. Still, exemptions for CUSMA-compliant goods have left Canada facing relatively low effective tariff rates, helping support export recoveries in most provinces.
For more details on our national forecast see our Quarterly Economic Forecast
British Columbia
British Columbia Economic Forecasts
[ Annual average % change, unless otherwise noted ]
| Economic Indicators | 2025 | 2026F | 2027F |
| Real GDP | 2.0 | 0.5 | 1.9 |
| Nominal GDP | 4.6 | 3.6 | 3.5 |
| Employment | 1.1 | -0.5 | 0.8 |
| Unemployment Rate (%) | 6.2 | 6.3 | 5.7 |
| Housing Starts (000's) | 44.1 | 43.6 | 43.3 |
| Existing Home Prices | -2.8 | -1.8 | 2.6 |
| Home Sales | -5.7 | -1.3 | 14.6 |
British Columbia’s economy performed relatively well in 2025, with real GDP by industry rising 2.0%—among the stronger provincial showings. Growth is set to slow in 2026 before firming again next year.
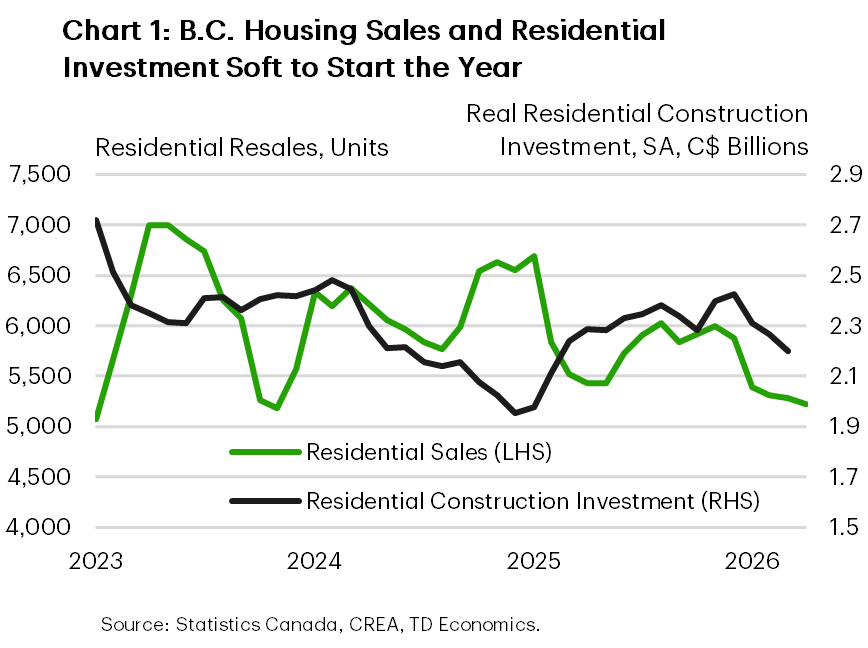
The housing market is likely to weigh on activity this year. Sales dropped more than 10% in the first quarter and are expected to recover only gradually into 2027. Elevated listings and soft demand are likely to push prices lower, pointing to another weak year for residential investment. The downturn is broad-based across markets and coincides with still-muted pre-construction activity, limiting near-term momentum in new supply and related construction activity (Chart 1). Looking ahead, pent-up demand and somewhat lower bond yields combined with general affordability improvements will likely put B.C.’s housing market on an upward trajectory next year.
Demographics have also shifted from tailwind to headwind. B.C.’s population is now declining, reflecting a sharp pullback in non-permanent residents tied to federal policy changes. Labour market conditions have softened alongside this shift. Employment is down 0.8% year-to-date—the weakest performance among provinces—pushing the unemployment rate up to its highest level since mid-2021. Still, slower labour force growth should help keep a lid on the unemployment rate through the rest of the year. These trends point to a cooling in consumer-facing sectors following a solid 2025. Real retail spending ranked second weakest across provinces in the first quarter.
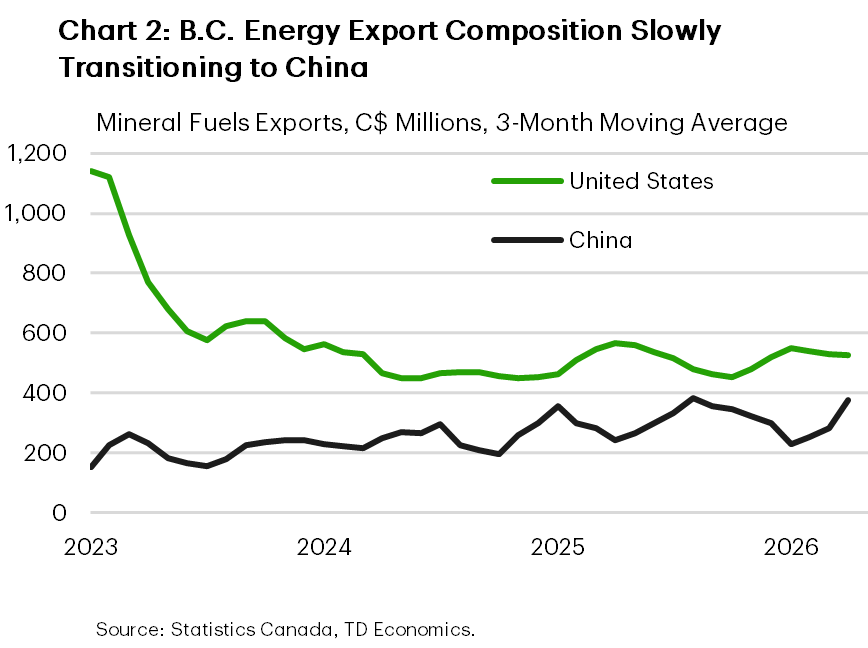
The goods-producing side of the economy should provide a partial offset, helping keep overall growth in positive territory. LNG Canada, which shipped its first cargo in mid-2025, continues to ramp up operations. The project is set to materially boost exports and deepen trade ties with Asian markets (Chart 2). As of March 2026, natural gas exports to non-U.S. markets hit a record level. This growing diversification comes as U.S. tariffs on key exports—particularly lumber and metals—continue to weigh on shipments. U.S.-exposed industries, including manufacturing, are expected to see a modest recovery following last year’s contraction.
Major project investment remains another source of support. British Columbia accounts for four of the 15 federally fast-tracked projects across energy, mining and infrastructure. This pipeline should provide a steady floor for growth in 2026, with a more meaningful boost to non-residential investment and job creation expected in 2027 and beyond.
Alberta
Alberta Economic Forecasts
[ Annual average % change, unless otherwise noted ]
| Economic Indicators | 2025 | 2026F | 2027F |
| Real GDP | 2.8 | 2.1 | 2.4 |
| Nominal GDP | 4.6 | 7.4 | 2.9 |
| Employment | 2.8 | 2.9 | 0.7 |
| Unemployment Rate (%) | 7.2 | 6.6 | 6.1 |
| Housing Starts (000's) | 55.0 | 46.1 | 43.0 |
| Existing Home Prices | 3.9 | 2.8 | 3.9 |
| Home Sales | -7.8 | -8.2 | 5.8 |
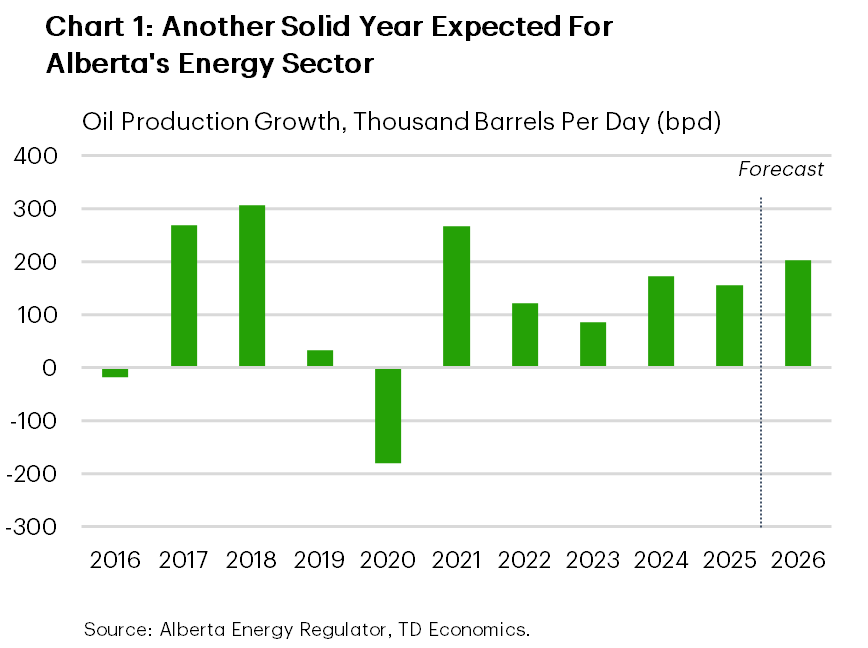
Alberta’s economy is expected to slightly decelerate in 2026, but growth should still rank among the strongest across provinces, supported by ongoing strength in the energy sector. Oil output recently reached record levels (Chart 1), and higher oil prices are expected to provide an added lift to production, corporate profits, and incomes this year.
One key question for the outlook is how quickly export capacity can expand. Trans Mountain has indicated that pipeline utilization is already ramping up and could reach full capacity by this summer, limiting how much additional oil production can be absorbed in the near-term. The first round of debottlenecking looks relatively close. A drag-reducing agent project is expected to add roughly 90,000 barrels per day (bpd) in early 2027, while a larger mainline optimization project could add another 210,000 bpd by late 2028. That suggests some relief is coming, but likely not soon enough to fully ease constraints later this year.
There has also been movement on a potential new west coast pipeline. Under the recent implementation agreement between Ottawa and Alberta, the province is to submit an official pipeline proposal to the Major Projects Office by July 1, 2026, and the federal government aims to pursue national-interest designation later this year. The agreement sets a framework for industrial carbon pricing while linking progress on a new pipeline to the advancement of the Pathways carbon capture project. Still, we would not include a new pipeline into the forecast until private-sector backing becomes clearer.
Outside energy, non-residential investment is another key growth driver, led by construction tied to transportation, utilities, clean energy, and technology projects. This is helping offset softer residential investment, with housing starts easing from extraordinary 2025 levels as population growth and household formation normalize. Even so, housing fundamentals remain sound, and resale activity should stay relatively firm.
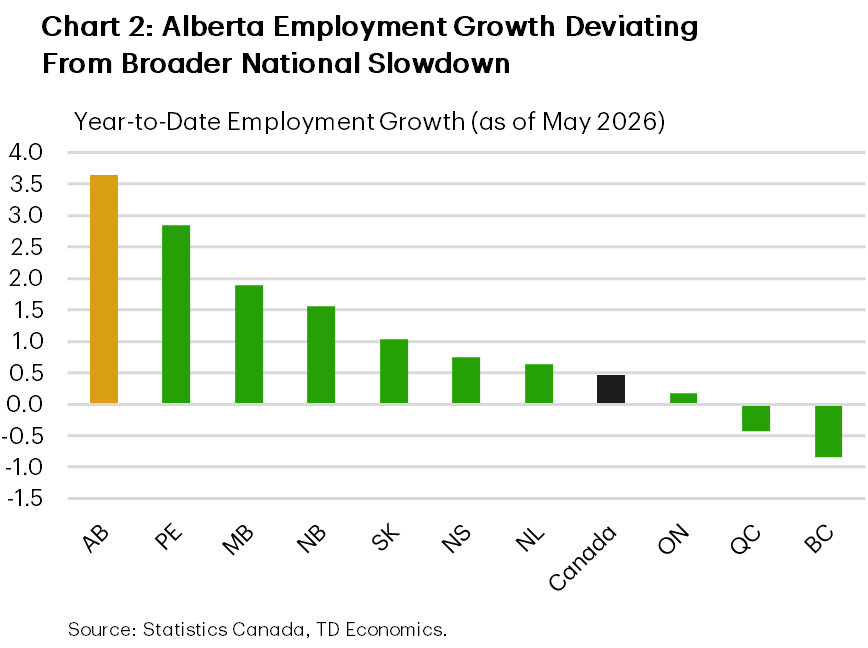
The household sector is also holding up better than elsewhere in Canada. Employment was up 3.6% year-on-year in May (Chart 2), with broad-based hiring helping support incomes and spending. That said, Alberta is not immune to slower population growth, softer homebuilding, infrastructure bottlenecks and trade uncertainty, all of which should act as natural constraints on growth into 2027. On the latter, U.S.-exposed industries like manufacturing and transportation are coming off a weak 2025 and are expected to see only a modest recovery this year, with further momentum in 2027 as trade certainty improves.
Saskatchewan
Saskatchewan Economic Forecasts
[ Annual average % change, unless otherwise noted ]
| Economic Indicators | 2025 | 2026F | 2027F |
| Real GDP | 2.2 | 1.2 | 2.0 |
| Nominal GDP | 4.8 | 5.2 | 3.6 |
| Employment | 2.5 | 0.5 | 0.7 |
| Unemployment Rate (%) | 5.2 | 5.4 | 5.1 |
| Housing Starts (000's) | 6.1 | 6.0 | 5.0 |
| Existing Home Prices | 8.6 | 4.7 | 4.5 |
| Home Sales | 0.8 | -4.2 | 9.3 |
Saskatchewan’s economy has been one of the stronger performers in recent years, with real GDP growth averaging close to 3% annually over the past three years. Growth is expected to ease in 2026 before firming in 2027. Even so, the province remains well positioned and should continue to outperform.
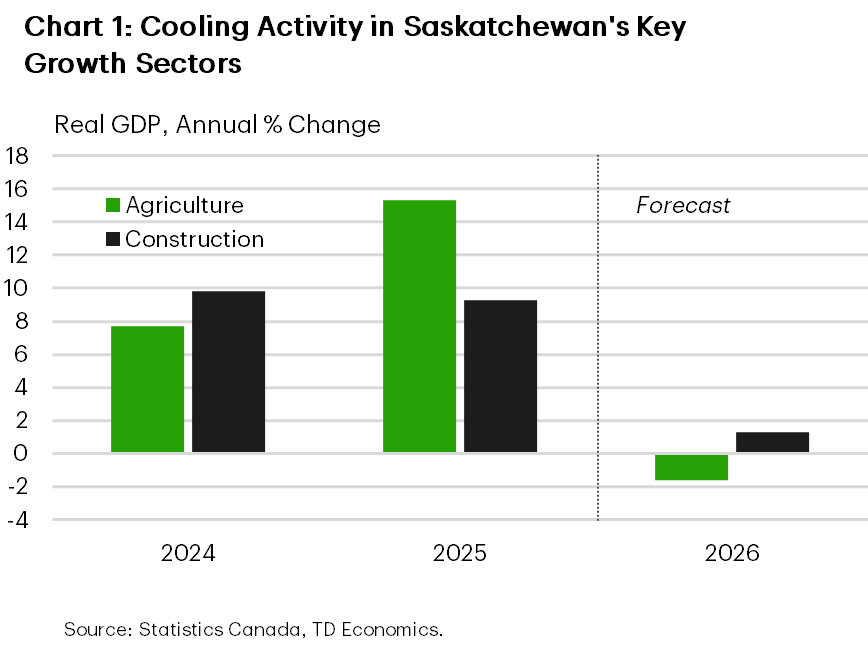
The moderation largely reflects fading tailwinds from key sectors, particularly agriculture and construction (Chart 1). In agriculture, a late and uneven start to the growing season is expected to weigh on output this year. Cold and wet conditions early in the spring delayed seeding across the province, with progress remaining well below historical norms until late May. With seeding pushed back, yields are more exposed to summer weather conditions, and crop production is expected to step down from 2025’s record levels to more typical ranges.
Construction is also set to cool after an exceptional run, with close to double-digit cumulative gains over the past three years. The pullback is driven primarily by softer residential investment following a period of strong homebuilding. In contrast, non-residential construction—particularly commercial and institutional projects—should provide an offset, supported by a large provincial capital program and still-elevated private investment. Recent data suggest capital spending will hold near historically high levels in 2026, although growth is likely to level off beyond this year.
Elsewhere in the goods sector, elevated oil prices should support a modest recovery in oil production following a weak 2025, when softer prices pulled production down by over 3%. Similarly, Saskatchewan’s globally-dominant potash sector will continue to provide stability. Strong global demand, constrained supply from competitors, and ongoing capacity expansions will keep production and export activity robust.
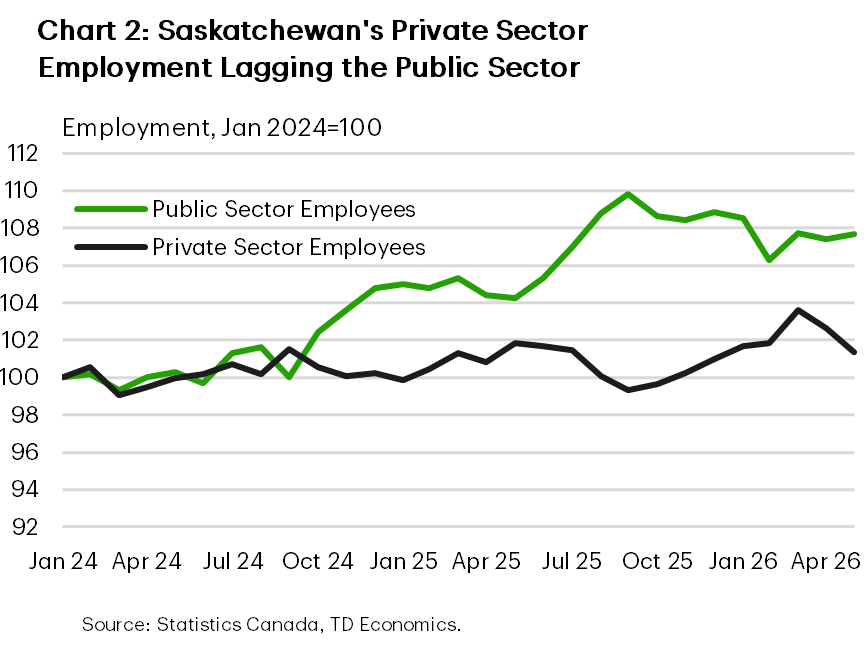
On the household side, real (inflation-adjusted) retail spending has moderated in line with our view that consumer momentum is easing. The latest budget sprinkled in some new modest household affordability measures that should provide some spending support as the labour market enters a cooling phase. Employment growth in the province has moderated to 1% year-to-date as of May. The public sector has driven recent hiring (Chart 2), but a renewed uptake in private-sector hiring into next year should help keep the unemployment rate stable.
Manitoba
Manitoba Economic Forecasts
[ Annual average % change, unless otherwise noted ]
| Economic Indicators | 2025 | 2026F | 2027F |
| Real GDP | 1.3 | 1.0 | 1.7 |
| Nominal GDP | 3.9 | 4.2 | 3.4 |
| Employment | 1.7 | 1.6 | 0.7 |
| Unemployment Rate (%) | 5.9 | 5.5 | 5.1 |
| Housing Starts (000's) | 7.9 | 8.2 | 6.3 |
| Existing Home Prices | 6.6 | 3.1 | 3.8 |
| Home Sales | 2.6 | -2.0 | 5.8 |
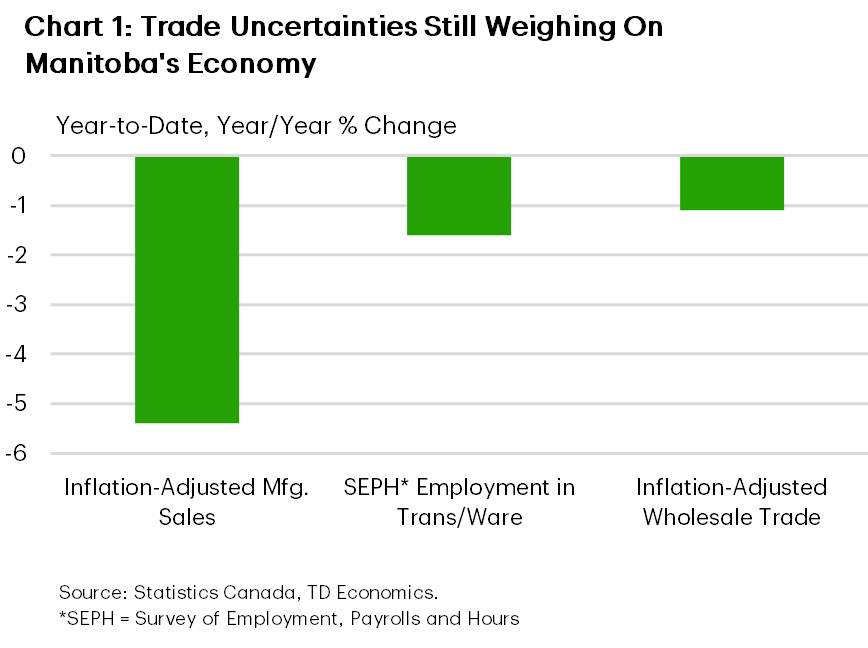
Manitoba’s economy is set to grow at a modest pace this year, as the trade conflict with the United States continues to weigh on activity—much as it did in 2025. Manufacturing output fell sharply last year, while other exposed industries, such as transportation/warehousing, posted shallow gains. Notably, the picture should be better in per capita terms, however.
Those same sectors are off to a weak start in 2026 (Chart 1). With CUSMA negotiations still in the early stages, trade uncertainty is likely to keep activity subdued. Elevated energy prices add to the challenge, acting as a headwind for Manitoba’s large manufacturing sector.
On the positive side, manufacturing may receive some support in the second half of the year from the temporary ten percentage point reduction in the U.S. tariff rate on agricultural (and certain other) equipment. Exports of these goods accounted for about 5% of Manitoba’s U.S.-bound shipments last year—the highest share among provinces.
Amid these external headwinds, Manitoba’s government is doing its best to backfill demand. The latest budget shows program spending expanding at a roughly 5% pace in FY 2026/27, led by healthcare and education. In addition, the government has rolled out a $3.8 billion capital spending plan for this fiscal year, although this comes against earlier survey-based intentions that pointed to a modest dip in 2026 public sector investment.
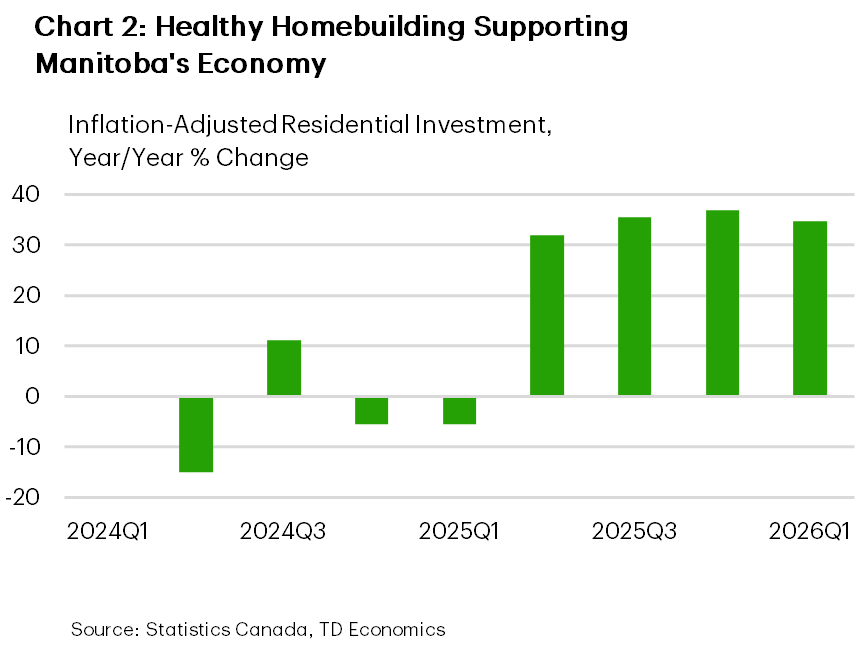
While messaging on government investment has been mixed, residential spending has been very strong, rising 35% year-on-year in the first quarter (Chart 2). This should provide a meaningful, albeit front-loaded lift to real GDP this year. Likely lower housing starts next year signals a slowdown going forward.
Household spending has also been resilient to start the year, as reflected in retail spending. Comparatively firm job growth has helped, pushing Manitoba’s unemployment rate lower so far this year. We expect this consumption resilience to continue through 2026, supported in part by measures introduced in the provincial budget. Most notably, the elimination of the PST on groceries should free up spending capacity, with groceries accounting for 11% of a typical household’s spending basket.
Ontario
Ontario Economic Forecasts
[ Annual average % change, unless otherwise noted ]
| Economic Indicators | 2025 | 2026F | 2027F |
| Real GDP | 1.3 | 0.4 | 1.8 |
| Nominal GDP | 4.2 | 3.7 | 3.1 |
| Employment | 1.0 | 0.4 | 0.7 |
| Unemployment Rate (%) | 7.7 | 7.2 | 6.7 |
| Housing Starts (000's) | 65.2 | 65.0 | 62.9 |
| Existing Home Prices | -4.1 | -3.6 | 0.7 |
| Home Sales | -5.5 | -0.6 | 12.5 |
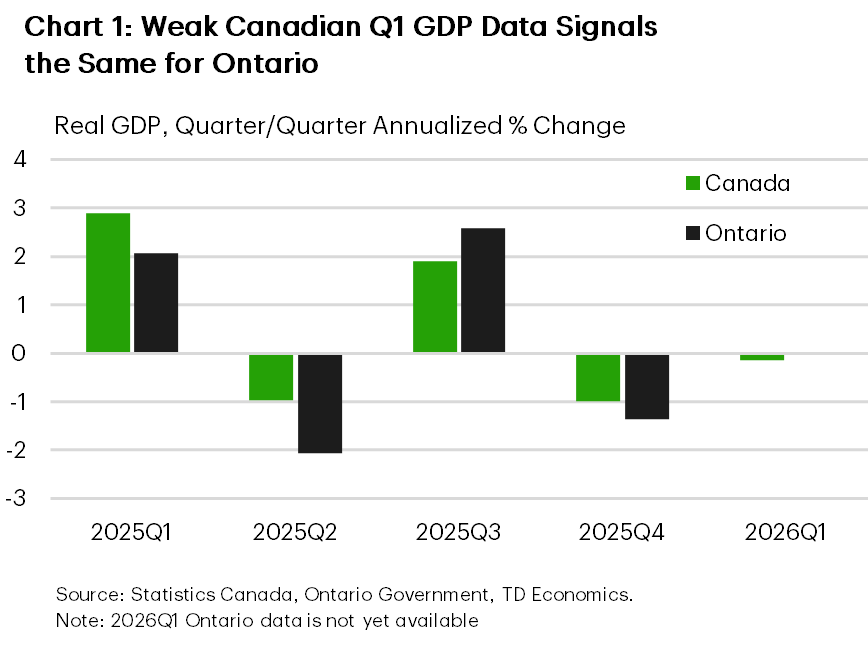
Canada’s largest province looks to have started the year on the back foot (Chart 1), prompting a downgrade to our 2026 real GDP growth forecast for Ontario. We now expect Ontario’s economy to advance at its slowest (non-pandemic) pace since the Global Financial Crisis. Population decline is a big part of the story, with a stronger performance expected in per capita terms. And, we’re expecting a better showing for Ontario after a weak first quarter.
Echoing 2025, trade-exposed sectors were subdued in the first quarter and are expected to remain a drag on growth this year amid ongoing trade uncertainty, tariffs on key sectors, and higher energy prices. The manufacturing sector recently received disappointing news, with Honda indefinitely suspending plans to build a $15 billion EV battery plant. Looking ahead, 2027 should bring some improvement if greater clarity emerges on CUSMA negotiations.
Construction will be another source of weakness this year, as the pullback in homebuilding continues in response to elevated unsold inventories and earlier weakness in pre-construction sales. The federal and provincial decision to remove the HST on new homes for all buyers should support demand, but given the lags between pre-sales and starts, any boost to homebuilding is likely a late-2027 story at the earliest. The provincial government’s sizeable capital spending plan should provide some offset to weakness in residential construction.
Alongside tax cuts on new homes and robust infrastructure investment plans, the latest provincial budget delivered a tax cut for small businesses and expanded accelerated depreciation allowances. While the latter could support business investment, elevated economic uncertainty is likely to remain the dominant constraint over the forecast horizon.
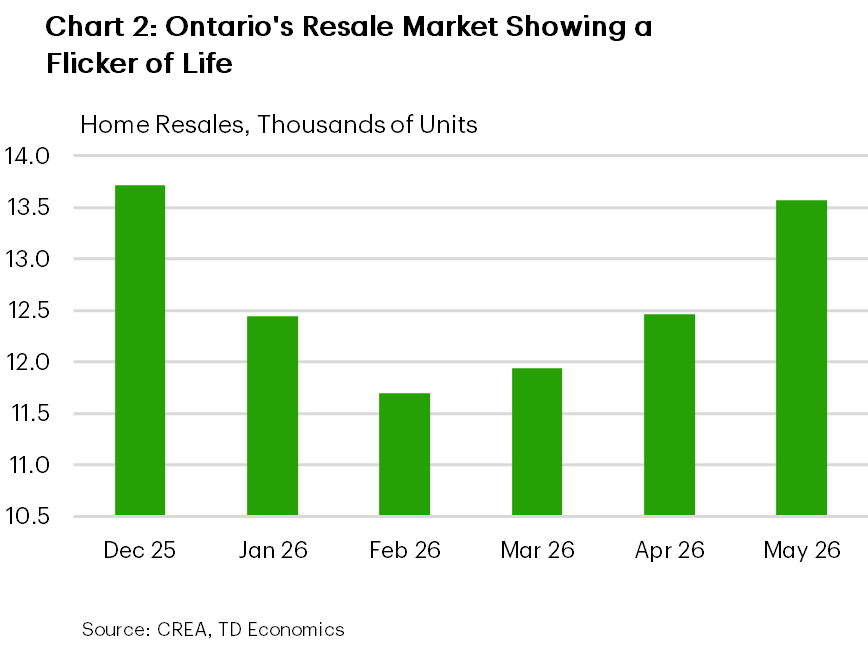
Despite broader economic weakness, consumption has held up relatively well, supported by households drawing on savings and gains in non-real estate wealth. Hiring has also picked up in recent months and, together with a boost from the World Cup, should provide some near-term lift. That said, this resilience is likely to be tested by the rise in energy prices, while weak population growth should keep a lid on hiring through next year, tempering consumption gains. The depressed resale housing market has also shown some signs of life (Chart 2), and we expect a modest, gradual recovery, supported by pent-up demand, improved affordability, and somewhat lower bond yields in the back half of the year.
Québec
Quebec Economic Forecasts
[ Annual average % change, unless otherwise noted ]
| Economic Indicators | 2025 | 2026F | 2027F |
| Real GDP | 0.8 | 0.4 | 1.5 |
| Nominal GDP | 4.7 | 3.6 | 2.9 |
| Employment | 1.7 | -0.7 | 0.4 |
| Unemployment Rate (%) | 5.6 | 5.6 | 5.3 |
| Housing Starts (000's) | 59.4 | 60.4 | 51.8 |
| Existing Home Prices | 8.2 | 3.4 | 2.2 |
| Home Sales | 7.7 | -3.7 | 3.7 |
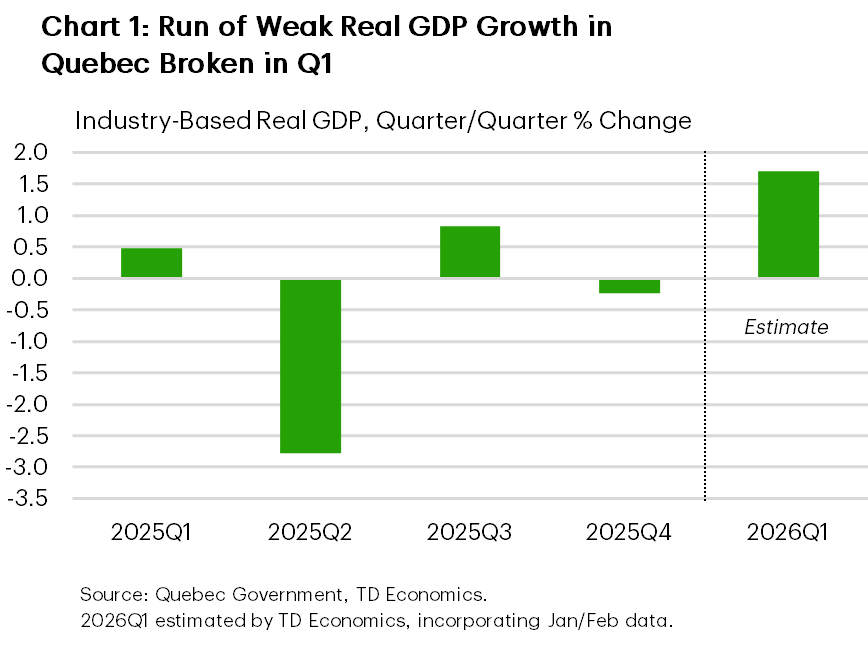
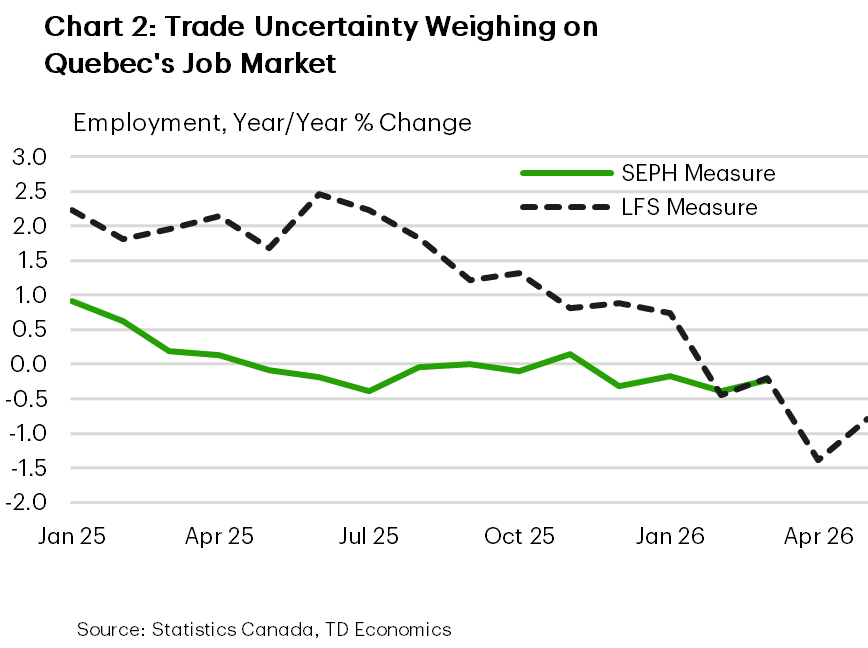
Quebec’s economy looks to have rebounded in the first quarter of 2026 following three quarters of roughly 0.5% average contraction amid trade-related headwinds and U.S. tariffs on key Quebec exports. Monthly industry GDP suggests a roughly 2% annualized first quarter gain (Chart 1), outperforming a flat nationwide reading. This firmer start provides a buffer to our 2026 real GDP growth forecast.
Growth is unlikely to sustain its first-quarter pace. Higher energy prices are adding to headwinds for manufacturing, as trade-exposed industries remain under pressure. A renewed CUSMA deal would provide some clarity, and, if it results in sector-specific tariff relief, will provide some upside to the outlook. Still, given the fluid nature of U.S. trade policy, uncertainty is likely to persist.
Meanwhile, domestic demand remains subdued. Consumer spending has been weak despite elevated savings, edging lower on a Q4/Q4 basis in 2025. Activity likely picked up in the first quarter, but underlying momentum remains fragile. Labour market conditions have also softened. Despite a healthy May print, employment is down year-on-year (Chart 2), while higher energy prices since the onset of the war are set to weigh further on household purchasing power. This backdrop will also continue to restrain housing demand, cooling home price growth into 2027.
Construction is providing some support for growth. Housing starts are elevated, driven by rental construction, and should lift activity this year. Non-residential building investment is trending lower, though engineering investment will be boosted by projects such as the Port of Contrecœur expansion and the development of a new graphite mine in Matawinie.
On the policy front, the latest provincial budget introduced few new initiatives, instead focusing on core services, targeted social supports, and infrastructure investment. As a result, it does little to alter the outlook, despite a planned $5 billion increase in infrastructure spending over six years.
Minimal population growth is also weighing on the 2026 outlook. In per capita terms, the picture is more favourable, with growth of just under 1% expected this year.
New Brunswick
New Brunswick Economic Forecasts
[ Annual average % change, unless otherwise noted ]
| Economic Indicators | 2025 | 2026F | 2027F |
| Real GDP | 2.0 | 0.9 | 1.3 |
| Nominal GDP | 4.5 | 3.7 | 2.7 |
| Employment | 1.3 | 1.0 | 0.1 |
| Unemployment Rate (%) | 7.1 | 7.1 | 7.3 |
| Housing Starts (000's) | 7.6 | 6.8 | 4.5 |
| Existing Home Prices | 5.6 | 0.3 | 2.4 |
| Home Sales | 4.1 | -5.9 | 6.0 |
Economic growth in New Brunswick is expected to remain modest through 2026 and 2027, as the province contends with fading demographic tailwinds, trade-related headwinds, and structurally weak private-sector investment. This comes after a reasonably solid 2025, when the economy posted decent growth despite being among the provinces most exposed to U.S. trade and tariff frictions.
A key theme shaping N.B.’s outlook is its growing reliance on the public sector. The provincial government is projecting sizeable deficits over the forecast horizon as it keeps its foot on the spending pedal amid still-soft economic conditions. Program spending is set to rise by roughly 5.5% in FY 2026/27, on top of a robust 7.7% increase last year, driven largely by new allocations for health care, alongside additional support for education and housing.
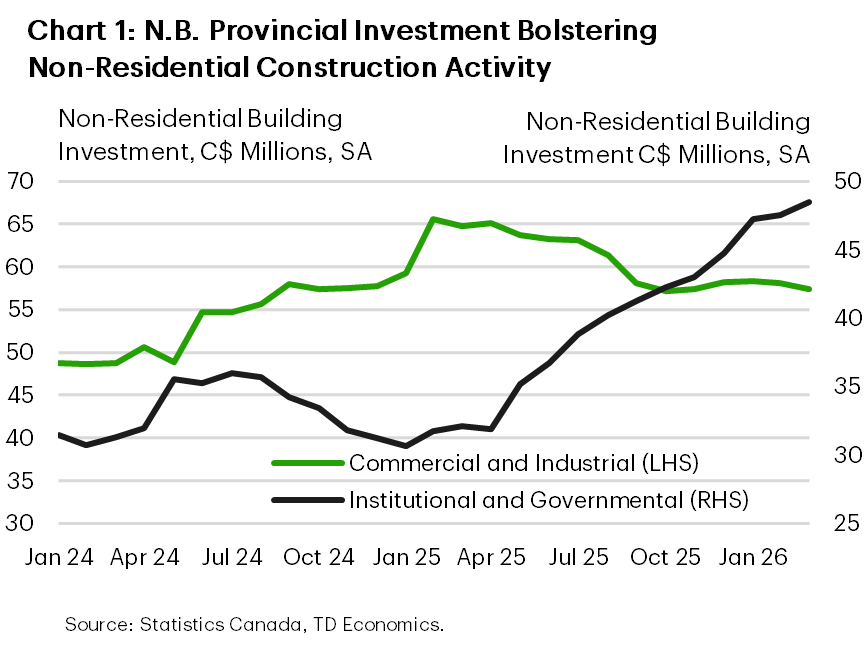
Public investment is also providing near-term support. Capital spending is set to increase by more than 20% year-on-year in the current fiscal year, with most of it directed toward transportation infrastructure and health-related projects. This builds on a period of solid construction activity, where a surge in government investment has helped offset weakness in private-sector investment (Chart 1). However, that support is expected to diminish, as modest capital spending intentions from both the public and private sectors point to softer non-residential construction activity ahead.
Elsewhere, the economic backdrop remains challenging. Trade-exposed sectors—including manufacturing, transportation, and forestry—are facing ongoing pressure from tariffs and softer external demand. Export performance has been particularly weak, with shipments down roughly 10% year-to-date, reflecting declines to both U.S. and non-U.S. markets. While these headwinds should ease as greater clarity emerges around trade policy, they are likely to weigh on goods-producing industries through much of 2026.
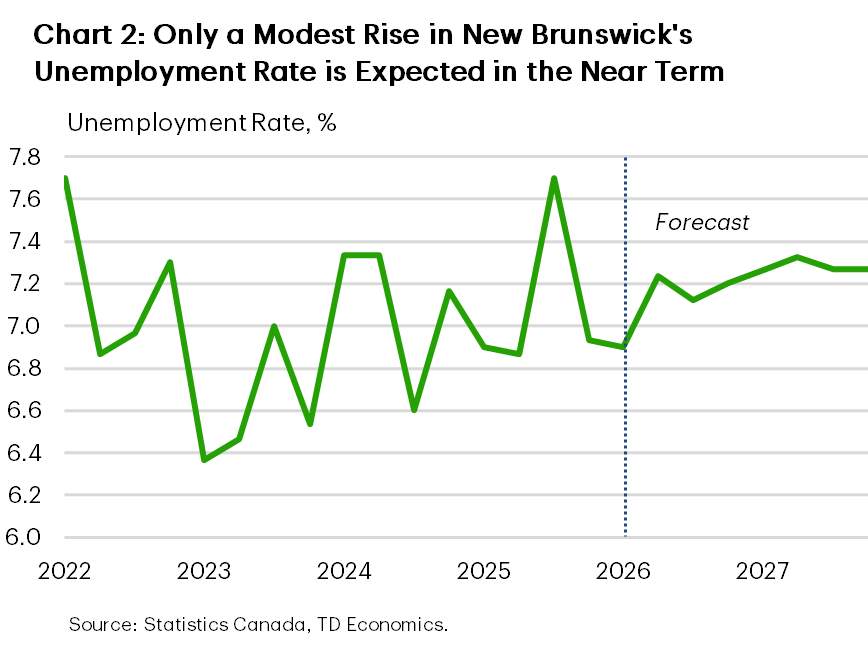
On the household side, conditions are softening at the margin. Population growth has slowed markedly following a period of rapid expansion, reducing support for labour force growth. That said, the labour market continues to hold up reasonably well (Chart 2), with employment gains concentrated in health care, education, and public administration— underscoring the role of the public sector in anchoring activity. Even so, the unemployment rate has edged higher in recent months, and softer hiring conditions are expected to limit income gains and keep consumer spending growth subdued through the year.
Nova Scotia
Nova Scotia Economic Forecasts
[ Annual average % change, unless otherwise noted ]
| Economic Indicators | 2025 | 2026F | 2027F |
| Real GDP | 2.3 | 1.2 | 1.5 |
| Nominal GDP | 4.9 | 4.6 | 3.0 |
| Employment | 0.3 | 0.8 | 0.4 |
| Unemployment Rate (%) | 6.6 | 6.9 | 6.8 |
| Housing Starts (000's) | 9.7 | 6.7 | 6.6 |
| Existing Home Prices | 5.5 | 0.2 | 1.7 |
| Home Sales | -0.1 | -9.7 | 6.1 |
A significant easing in Nova Scotia’s economic growth is expected this year following a very strong multi-year run. In an abrupt shift from 2025, goods-producing industries are expected to make a modest contribution to growth, while services are also set to slow. The latter reflects weak hiring year-to-date in Nova Scotia’s outsized finance and insurance industry.
Manufacturing has had a weak start to the year. Activity is likely to remain constrained by ongoing U.S.-Canada trade uncertainty. That said, there are a few bright spots for external-facing industries. Nova Scotia’s exports are largely CUSMA-compliant and China’s removal of tariffs on seafood products in March should lift export volumes, and Nova Scotia saw some improvement in shipments in April.
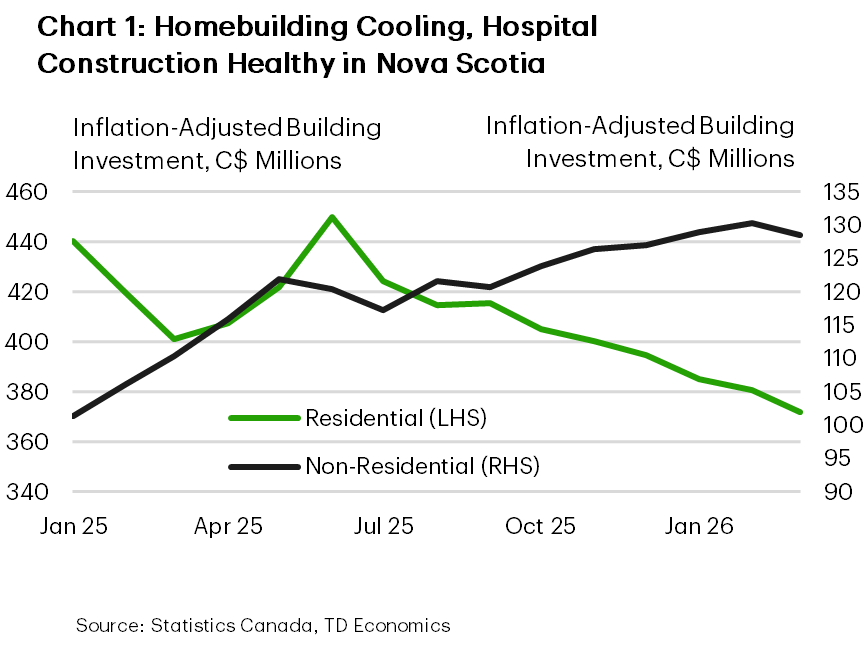
Homebuilding is also set to cool this year, driven by a moderation in ground-oriented construction after an unsustainably strong 2025. Looking ahead, weak population growth is expected to weigh on rental demand, pushing up vacancy rates and further dampening new construction.
In contrast, non-residential construction spending is expected to remain robust (Chart 1), supported by the provincial government’s hefty capital spending plan. Investment is being lifted by healthcare projects, including the QEII Halifax Infirmary Expansion Project and the redevelopment project in Cape Breton. These multi-year healthcare projects will offer sustained support to investment. Nova Scotia’s “Wind West” offshore wind project offers meaningful longer-term upside, though it remains in the planning stage. The province will likely also benefit from defense-related investment moving forward.
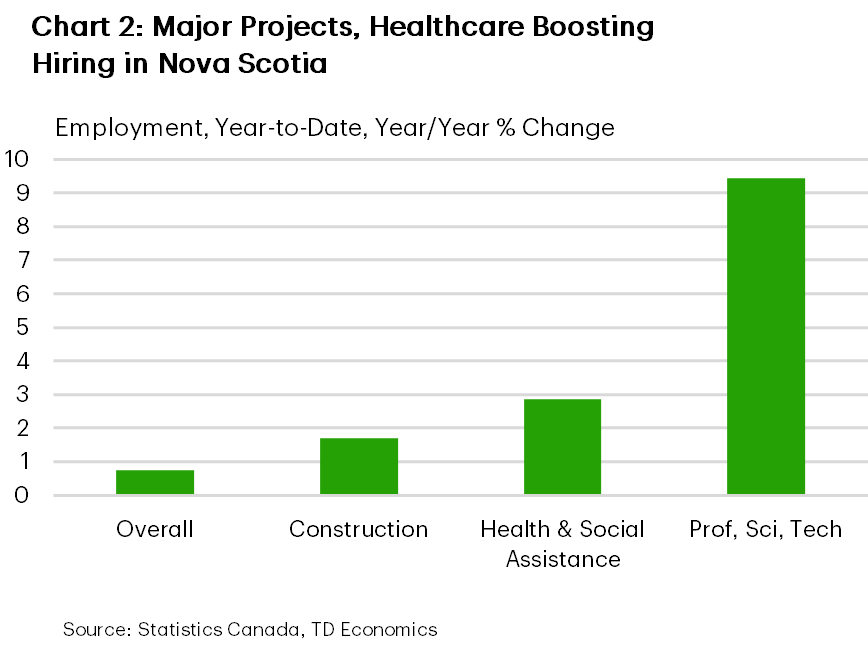
Consumption growth has shown some resilience to start the year, supported by job growth that is modestly outperforming other regions. Hiring has been lifted by construction, healthcare and professional services (Chart 2), and should remain supported by ongoing projects and firm provincial healthcare spending plans. Still, the broader cooling in activity, alongside elevated uncertainty, is likely to slow hiring. At the same time, Nova Scotia’s households are facing an increase in energy costs and devote an outsized share of income to energy. As such, household spending should ease through the remainder of the year.
Prince Edward Island
P.E.I. Economic Forecasts
[ Annual average % change, unless otherwise noted ]
| Economic Indicators | 2025 | 2026F | 2027F |
| Real GDP | 2.8 | 1.3 | 1.7 |
| Nominal GDP | 5.0 | 4.7 | 3.2 |
| Employment | 1.0 | 2.9 | 0.4 |
| Unemployment Rate (%) | 8.0 | 7.4 | 7.7 |
| Housing Starts (000's) | 1.7 | 1.8 | 1.3 |
| Existing Home Prices | 2.5 | 4.3 | 3.5 |
| Home Sales | 6.0 | -6.2 | 5.2 |
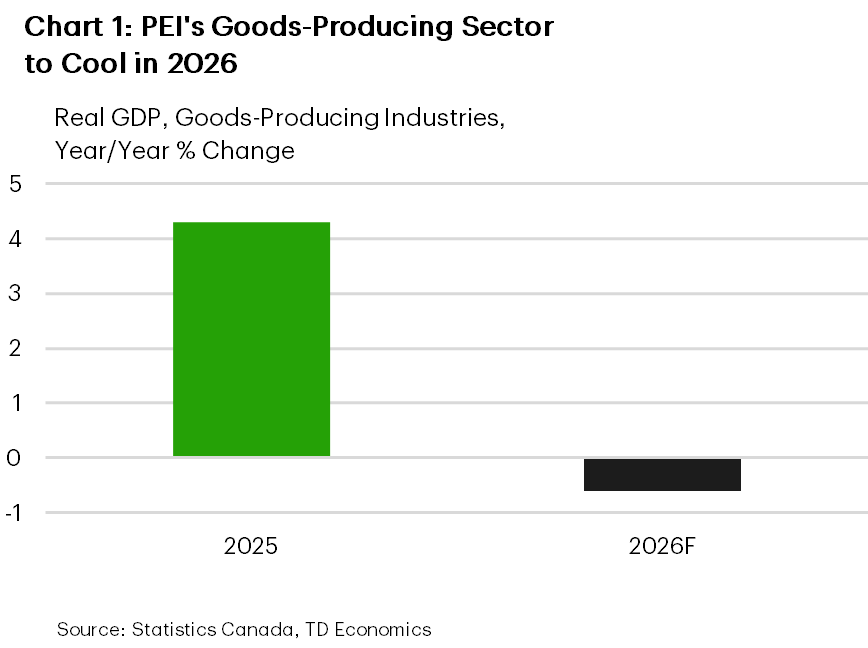
Following another rock-solid year of growth in Prince Edward Island in 2025, we expect a significant slowdown this year. Goods-producing industries are set to lead the deceleration in 2026 (Chart 1), flagged by early weakness in manufacturing and, particularly, building construction. Residential and non-residential construction investment was down roughly 30% year-on-year in the first quarter, coming off elevated 2025 levels and consistent with the sharp slowdown in population growth. Activity also appears to have started the year on the back foot in some service sectors, including wholesaling and transportation/warehousing.
Government program spending is set to slow this year, despite a solid start to 2026. Both federal and provincial governments have signalled slower growth in outlays, and with the federal government accounting for roughly 7% of GDP, the impact is meaningful. Even so, the provincial government projects a sizeable deficit of 3.5% of GDP in FY 2026/27, with deficits and capital spending together driving a near five-percentage point increase in the debt-to-GDP ratio to 38.1% this fiscal year.
A rebound in PEI’s agricultural sector—which accounts for about 8% of GDP—is expected this year following a weak 2025, consistent with increased seeded area for several major crops. At the same time, disease will significantly reduce oyster production. While oysters are not a massive export for PEI, this will weigh on overall output. In addition, potato exports have declined so far this year, and U.S. producers are pushing for the re-imposition of an import ban following the discovery of potato wart in a limited number of fields.
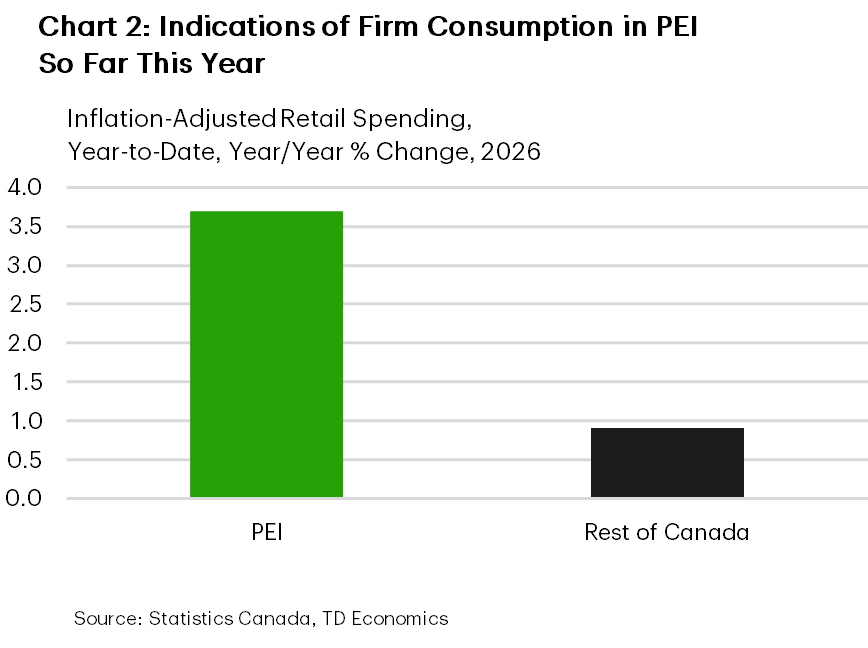
The provincial budget was a mixed bag for households. The elimination of the energy rebate and the introduction of a new tax bracket for higher-income households are expected to weigh on disposable income. Offsetting this, a new PEI Essentials Benefit for households provides some support. On net, this should be modestly positive for household spending, which has held firm to start the year (Chart 2), supported by relatively solid job growth. That said, growth is likely to slow in the near term in response to higher energy prices. As in other Atlantic provinces, energy accounts for a relatively large share of household budgets in PEI.
Newfoundland & Labrador
NFLD & Labrador Economic Forecasts
[ Annual average % change, unless otherwise noted ]
| Economic Indicators | 2025 | 2026F | 2027F |
| Real GDP | 3.5 | 4.1 | 1.3 |
| Nominal GDP | 5.3 | 10.1 | 2.4 |
| Employment | -0.2 | 0.2 | -0.7 |
| Unemployment Rate (%) | 10.2 | 10.1 | 11.0 |
| Housing Starts (000's) | 1.6 | 1.7 | 1.5 |
| Existing Home Prices | 8.3 | 4.9 | 2.5 |
| Home Sales | 7.9 | -6.6 | 9.3 |
Newfoundland and Labrador (N.L.) led provincial growth in 2025, with real GDP rising 3.5%, driven by a near 15% expansion in the energy sector. The sector’s strength is set to carry into 2026, helping the province buck the broader national slowdown. However, with growth narrowly-concentrated, momentum is expected to fade into 2027 as energy gains level off.
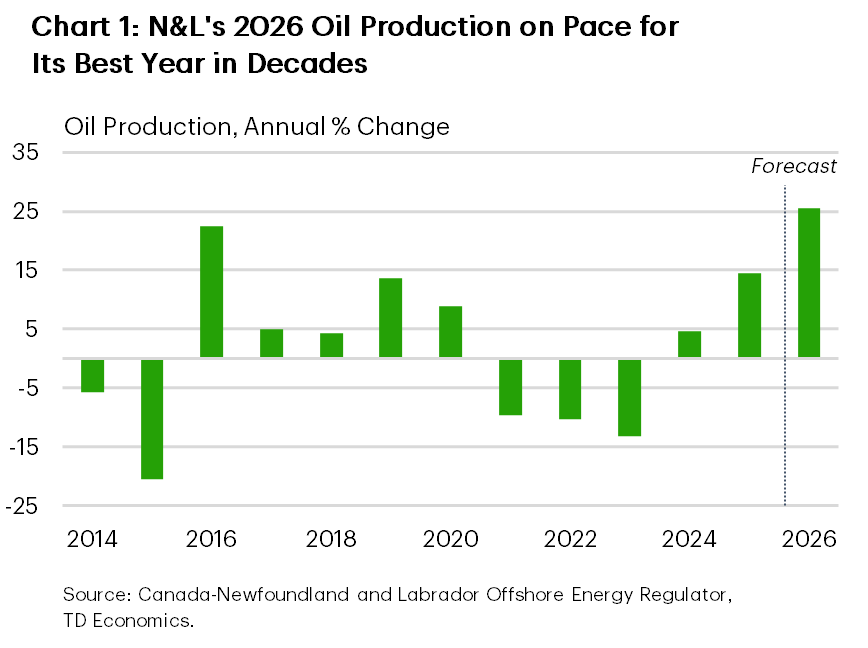
Oil production volumes are up a staggering ~30% through early 2026 (compared to year-ago levels), supported by continued ramp-ups across offshore projects and strong performance at legacy fields (Chart 1). Output has reached multi-year highs, with gains evident across all major producing assets.
Elsewhere in the goods sector, manufacturing activity has turned sharply higher through early 2026, reflecting strength in resource-based processing industries. At the same time, the mining sector is receiving a lift from the Valentine gold mine, which reached commercial production in late 2025 and is expected to ramp up output through this year.
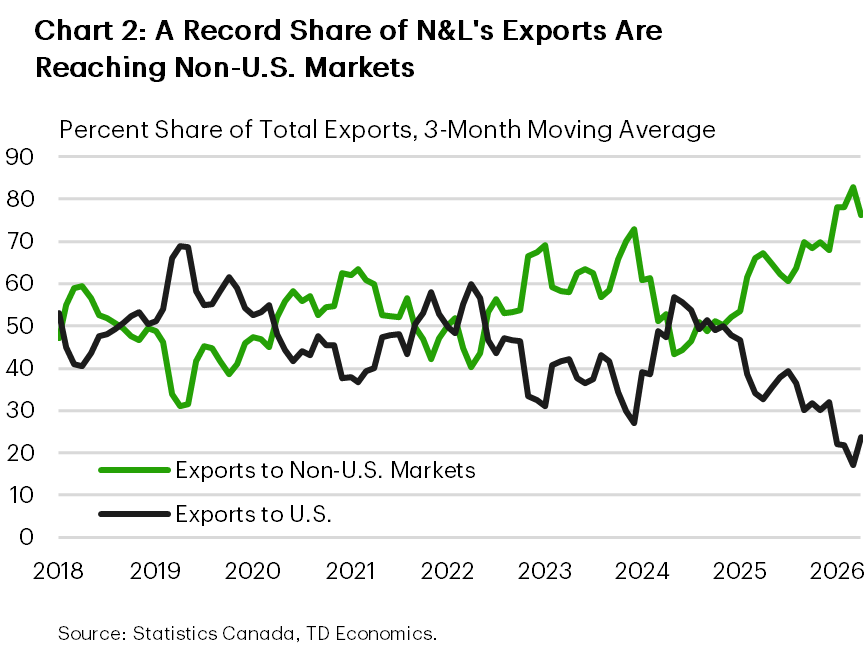
Export growth is being supported by robust global demand for crude primarily from non-U.S. markets. This positioning insulates the province from ongoing North American trade frictions but also underscores the economy’s reliance on a narrow set of commodities (Chart 2). Export growth should moderate later this year as the situation in the Middle East cools.
Despite the strong top-line growth expected this year, underlying domestic momentum is weaker. Construction remains a clear soft spot, with non-residential investment near decade lows and the outlook constrained by a scaled-back capital spending envelope. While residential investment has strengthened, it has not been sufficient to offset broader weakness. In addition, restrained operating spending plans laid out by the government in their recent budget will weigh on public sector-driven activity over the forecast horizon.
Hiring in the province turned negative last year and the job market is expected to face further challenges as growth slows. However, we expect a limited rise in the unemployment rate (11% by the beginning of 2027), as the labour force is expected to shrink amid stalling population growth and older workers exiting the workforce. The softer labour market points to an ongoing drag on consumption growth this year, evidenced by real retail spending growth that ranks last among provinces so far this year.
Forecast Table
Provincial Economic Forecasts
| Provinces | Real GDP (% Chg.) |
Nominal GDP (% Chg.) |
Employment (% Chg.) |
Unemployment Rate (Average, %) |
Housing Starts (Thousands) |
Home Prices (% Chg.) |
||||||||||||
| 2025 | 2026F | 2027F | 2025 | 2026F | 2027F | 2025 | 2026F | 2027F | 2025 | 2026F | 2027F | 2025 | 2026F | 2027F | 2025 | 2026F | 2027F | |
| National | 1.9 | 0.7 | 1.8 | 4.4 | 4.4 | 3.1 | 1.4 | 0.4 | 0.6 | 6.8 | 6.6 | 6.2 | 258.4 | 246.4 | 226.2 | -1.4 | -0.3 | 2.9 |
| Newfoundland & Labrador | 3.5 | 4.1 | 1.3 | 5.3 | 10.1 | 2.4 | -0.2 | 0.2 | -0.7 | 10.2 | 10.1 | 11.0 | 1.6 | 1.7 | 1.5 | 8.3 | 4.9 | 2.5 |
| Prince Edward Island | 2.8 | 1.3 | 1.7 | 5.0 | 4.7 | 3.2 | 1.0 | 2.9 | 0.4 | 8.0 | 7.4 | 7.7 | 1.7 | 1.8 | 1.3 | 2.5 | 4.3 | 3.5 |
| Nova Scotia | 2.3 | 1.2 | 1.5 | 4.9 | 4.6 | 3.0 | 0.3 | 0.8 | 0.4 | 6.6 | 6.9 | 6.8 | 9.7 | 6.7 | 6.6 | 5.5 | 0.2 | 1.7 |
| New Brunswick | 2.0 | 0.9 | 1.3 | 4.5 | 3.7 | 2.7 | 1.3 | 1.0 | 0.1 | 7.1 | 7.1 | 7.3 | 7.6 | 6.8 | 4.5 | 5.6 | 0.3 | 2.4 |
| Québec | 0.8 | 0.4 | 1.5 | 4.7 | 3.6 | 2.9 | 1.7 | -0.7 | 0.4 | 5.6 | 5.6 | 5.3 | 59.4 | 60.4 | 51.8 | 8.2 | 3.4 | 2.2 |
| Ontario | 1.3 | 0.4 | 1.8 | 4.2 | 3.7 | 3.1 | 1.0 | 0.4 | 0.7 | 7.7 | 7.2 | 6.7 | 65.2 | 65.0 | 62.9 | -4.1 | -3.6 | 0.7 |
| Manitoba | 1.3 | 1.0 | 1.7 | 3.9 | 4.2 | 3.4 | 1.7 | 1.6 | 0.7 | 5.9 | 5.5 | 5.1 | 7.9 | 8.2 | 6.3 | 6.6 | 3.1 | 3.8 |
| Saskatchewan | 2.2 | 1.2 | 2.0 | 4.8 | 5.2 | 3.6 | 2.5 | 0.5 | 0.7 | 5.2 | 5.4 | 5.1 | 6.1 | 6.0 | 5.0 | 8.6 | 4.7 | 4.5 |
| Alberta | 2.8 | 2.1 | 2.4 | 4.6 | 7.4 | 2.9 | 2.8 | 2.9 | 0.7 | 7.2 | 6.6 | 6.1 | 55.0 | 46.1 | 43.0 | 3.9 | 2.8 | 3.9 |
| British Columbia | 2.0 | 0.5 | 1.9 | 4.6 | 3.6 | 3.5 | 1.1 | -0.5 | 0.8 | 6.2 | 6.3 | 5.7 | 44.1 | 43.6 | 43.3 | -2.8 | -1.8 | 2.6 |
For any media enquiries please contact Oriana Kobelak at 416-982-8061
Disclaimer
This report is provided by TD Economics. It is for informational and educational purposes only as of the date of writing, and may not be appropriate for other purposes. The views and opinions expressed may change at any time based on market or other conditions and may not come to pass. This material is not intended to be relied upon as investment advice or recommendations, does not constitute a solicitation to buy or sell securities and should not be considered specific legal, investment or tax advice. The report does not provide material information about the business and affairs of TD Bank Group and the members of TD Economics are not spokespersons for TD Bank Group with respect to its business and affairs. The information contained in this report has been drawn from sources believed to be reliable, but is not guaranteed to be accurate or complete. This report contains economic analysis and views, including about future economic and financial markets performance. These are based on certain assumptions and other factors, and are subject to inherent risks and uncertainties. The actual outcome may be materially different. The Toronto-Dominion Bank and its affiliates and related entities that comprise the TD Bank Group are not liable for any errors or omissions in the information, analysis or views contained in this report, or for any loss or damage suffered.
Download
Share: