Behind the Scenes: China’s Deflation and Global Prices
Andrew Hencic, Senior Economist | 416-944-5307
Date Published: July 3, 2024
- Category:
- Global
- Asia
- Global Economics
Highlights
- The fading pandemic-era boom in goods consumption, multi-decade highs in interest rates that weighs on demand for durable goods that are often bought on credit, and a return to normalcy in supply chains have all helped slow consumer price inflation.
- An important role has been played by fading input price pressures, partially attributable to weak economic conditions in China. This is likely to persist in the coming years as the economy slowly rebalances from housing-driven growth.
- The potential for a rapid absorption of excess capacity in China is an upside inflationary risk. However, the baseline outlook is still one of piecemeal stimulus by authorities wary of stoking new imbalances in the economy.
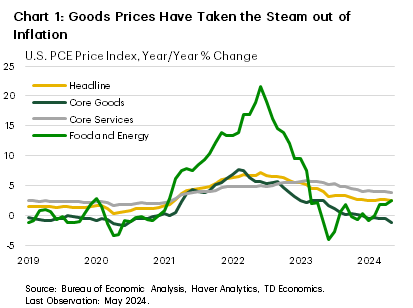
The pronounced cooling in inflation in advanced economies has primarily been driven by a steep deceleration in the price increases of physical goods. Falling energy and food prices have been front and center of the drawdown, but core goods have also recorded slower price growth or outright decline (Chart 1). In turn, a key mechanism behind this trend is the fading pressure from input prices, which can be partly attributed to the ongoing sluggishness of China’s economy.
The decline in goods inflation is due to several factors, the most obvious of which are the fading pandemic-era boom in goods consumption, a multi-decade high in interest rates that weighs on demand for durable goods that are often bought on credit, and a return to normalcy in supply chains. Looking forward, one question that lingers over the outlook is: “to what extent is China’s excess capacity helping to cool price pressures around the world, and specifically in the U.S.?”
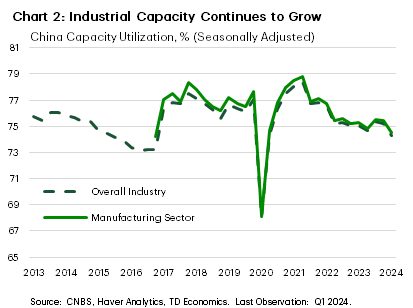
Reports of excess capacity have grabbed headlines. On this front, electric vehicle production has been in the spotlight after the U.S., Europe, and most recently, Canada, raised tariffs on China’s exports of the product. But EVs are only one product and represent a very small share of trade between the U.S. and China. Moreover, China’s whole economy is in a state of excess supply as it continues to deal with the moribund housing market and associated debt overhang. Economy-wide prices continue to sink (the GDP deflator is down 1.0% year-on-year, y/y) while consumer prices are effectively flat (+0.3% y/y). For global goods markets, China’s sinking industrial (and manufacturing) capacity utilization is a convenient illustrator of the accumulating slack in the sector (Chart 2).
History has taught us that restoring price growth (by rebalancing supply and demand) after a financial shock (with large balance sheet effects for businesses and households) takes a notoriously long time. This could mean that China’s factories and builders face a prolonged period of low pricing power, with meaningful implications for consumers world-wide.
For consumers in advanced economies there are two transmission channels to consider. First, are the direct links – intermediate and final consumption goods. These are the items that are used by end consumers (e.g., clothing, toys, electronics, etc.) or intermediate goods used in final assembly (the cloth in a shirt). The second channel is a catch-all for indirect effects. For instance, the potential for weak demand in China to dampen demand for oil or other commodities and depress prices that rely on these inputs or, changes in global investment and hiring decisions due to softer earnings of multinationals’ operations in China.
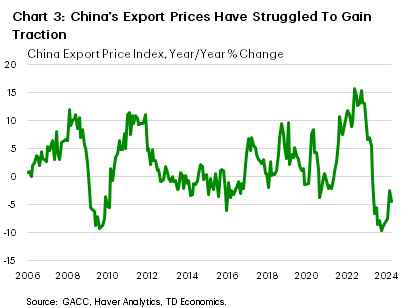
The direct linkage flows through the goods produced in China and shipped to markets around the world. China’s industrial capacity utilization has been marching lower since 2021, and export prices (in yuan terms) have been falling since May 2023 (Chart 3). Falling export prices have helped ease inflation across advanced economies, even if they have only partially unwound the run-up since the pandemic. The U.S. dollar’s dominant run since the pandemic has also helped to drive down Chinese import prices into the U.S. – the greenback has appreciated roughly 4% against the renminbi since May 2023.
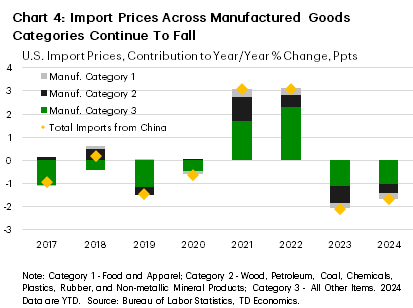
Separately, data from the U.S. Census Bureau show that prices for goods imported from China are falling. Nearly all U.S. imports from China (over 95%) are manufactured goods and prices are tracked across the three major product groupings1. Group One is primarily food and apparel, Group Two contains processed raw materials like wood, petroleum, nonmetallic minerals, and chemicals, and Group Three contains all other products including the single largest category (computer and electronic products). The absence of pricing power is apparent across all three groups as the import price indexes are all in contraction (Chart 4).
Yet, the direct linkage from China’s factories to U.S. final consumer prices is relatively small. While the estimated figure of 1.7%2 of U.S. consumer spending tracing back to China may be slightly out of date (the analysis was compiled based on data from 2016 and 2017) it is still roughly in line with current economic linkages. The resultant direct pass-through of deflation is likely only marginal.
The second-round effects are likely playing a larger role. As China’s economy falters, demand for global commodities and services is depressed and the resultant supply is left searching for markets – ending in lower prices or more tepid price growth. For the U.S., less pressure from input costs means firms can support margins without having to resort to raising prices, as they did during the pandemic-era supply shocks.
Our estimates shows that overall economic slack in China has may have shaved between two and three percent from the U.S. producer price index since 2022, and 90 basis points from headline PCE inflation – of which roughly half is due to lower core PCE price growth3.
“It is very difficult to predict, especially the future.” - Niels Bohr
Extrapolating into the future is slightly more complicated. We expect that the excess capacity built thus far continues to linger and is incorporated into our inflation outlook. The key question becomes the extent to which China’s economy can rebalance supply and demand – shrinking the output gap4.
The housing slump is set to continue. Research out of the Institute for International Finance notes that the ongoing sag in housing prices has currently lasted about half as long as a typical correction, and experienced two thirds of the typical price declines5. Given the strain falling home prices exert on household and investor balance sheets, the excess housing stock, and the reported lack of uptake during smaller government property purchase programs6 it looks unlikely that a turning point is coming soon. Moreover, officials remain reticent to let interest rates fall sharply and risk a steep devaluation in the currency. The aversion to sinking interest rates also comes amid the general hesitancy to allow for a rapid accumulation in additional debt, particularly by sub-national governments7.
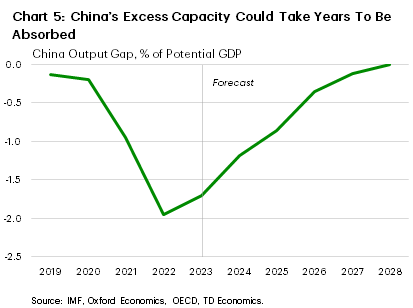
Thus, accounting for historical comparisons after housing market corrections suggests that China’s economy could remain in a state of excess supply into 20278 (Chart 5). This would fall in line with longer-term growth projections that expect a gradual deceleration in China’s GDP gains through 2029. For example, the IMF forecasts real GDP growth to slow from 3.8% y/y in 2026 to 3.3% in 20299.
In the near term, however, the balance of risks to the outlook is skewed towards a more rapid improvement in China’s economy – potentially by a renewed stimulus push. The structure and timing of any such action is highly uncertain and would involve a relatively abrupt shift by policymakers. Moreover, with a main driving force behind any inflationary impact coming through a change in raw materials prices, the scale of any supply side response by major producers could serve to counterbalance the effect. Nonetheless, under an unlikely but plausible scenario that much of the excess domestic capacity in China is quickly absorbed (within a year) through the right mix of stimulus, the additional inflationary pressure could add as much as 50 basis points to headline consumer prices in the U.S. (above our current baseline forecast), and roughly 30 basis points to core inflation over the course of a year.
The lift to prices from additional demand would result in more muted price gains relative to the demand shocks of the pandemic era. At that time lockdowns and quarantines limited the delivery of products to market and strained labor supply, resulting in outright shortages of goods and services. With quantities severely constrained, prices rose rapidly. As the supply side of the economy has since broadly recovered, producers can be far more responsive – allowing quantities to adjust rather than prices. That said, the uncertainty about our estimate of the inflationary impact is high and conditional on the response from commodity markets and consumer sentiment.
Ultimately, a more rapid recovery in China is still simply an upside risk. The baseline outlook is for piecemeal stimulus by authorities wary of stoking new imbalances in the economy, and a domestic market dealing with the broad economic slowdown resulting from sagging asset prices.
Bottom Line
The U.S. economy is largely insulated from the rest of the world. Nonetheless, the scale of the slowdown in China has been large enough to help cool inflationary pressures. Looking forward, a rapid recovery in China appears to be unlikely, meaning that it will continue to act as a counterweight to global demand and price growth. Nonetheless, upside inflation risks are ever-present, but a rapid absorption of slack in China’s economy might temporarily lift U.S. inflation.
End Notes
- Category One: Food, Apparel, Textiles, Beverage and Tobacco, Leather and Allied Products. Category Two: Wood, Paper, Petroleum, Coal, Chemicals, Rubbers, Plastics, Nonmetallic Minerals. Category Three: Primary Metal Manufacturing, Fabricated Metal Products, Machinery, Computer and Electronics, Electrical Equipment, Appliance and Components, Transportation Equipment, Medical Equipment and Supplies, Furniture and Related Products, Miscellaneous Manufacturing
- Hale, G., Hobijn B., Nechio, F., D. Wilson (2019) “How Much Do We Spend on Imports” FRBSF Economic Letter 2019-01, https://www.frbsf.org/research-and-insights/publications/economic-letter/2011/08/us-made-in-china/#:~:text=Two%2Dthirds%20of%20U.S.%20durables,of%20the%2011.5%25%20foreign%20share. See Appendix.
- An estimate of the impact of China’s additional economic slack on global prices is going to depend heavily on “what could have been”. One method is to look at forecasts at different points of time and calibrate slack based on how far the economy has undershot expectations. From this lens, the IMF’s May 2024 projections for China’s economy expected it to be roughly two percentage points smaller in 2025 than those conducted in October 2021 . With the supply side of the economy roughly invariant (given the absence of lockdowns or other supply shocks) the economic underperformance mostly reflects the widening gap between demand and supply.
- Taking an approximation of an output gap that was essential closed in 2019 (overall CPI inflation registered 2.9%, relative to a 3.0% target), is expected to be closed by 2029, and estimating supply side growth into the future gives an approximate path of the output gap.
- Ma G., Feng P., P. Wang (June 2024) “China Spotlight: Housing is Still in Dire Straits” The Institute for International Finance. https://www.iif.com/Publications/ID/5791/China-Spotlight-Housing-is-still-in-dire-straits
- Bloomberg News (May 26, 2024) “China’s Housing Rescue Has a Poor Track Record in Pilot Cities” https://www.bloomberg.com/news/articles/2024-05-26/china-s-housing-rescue-has-a-poor-track-record-in-pilot-cities?srnd=homepage-asia
- Leahy, J., McMorrow, R., C. Leng (March 13, 2024) “China’s Treatment of Local Debt ‘Ulcer’ Threatens Growth Target” Financial Times. https://www.ft.com/content/901bc68e-ad35-42eb-97e0-542c631b9033
- The CBO estimates of the U.S. output gap had it in negative territory from 2009 until 2019, while estimates for Japan from the BoJ and the Cabinet Office estimate an output gap below or close to zero between 1992 and 2006.
- IMF WEO April 2024: https://www.imf.org/en/Publications/WEO/weo-database/2024/April
Disclaimer
This report is provided by TD Economics. It is for informational and educational purposes only as of the date of writing, and may not be appropriate for other purposes. The views and opinions expressed may change at any time based on market or other conditions and may not come to pass. This material is not intended to be relied upon as investment advice or recommendations, does not constitute a solicitation to buy or sell securities and should not be considered specific legal, investment or tax advice. The report does not provide material information about the business and affairs of TD Bank Group and the members of TD Economics are not spokespersons for TD Bank Group with respect to its business and affairs. The information contained in this report has been drawn from sources believed to be reliable, but is not guaranteed to be accurate or complete. This report contains economic analysis and views, including about future economic and financial markets performance. These are based on certain assumptions and other factors, and are subject to inherent risks and uncertainties. The actual outcome may be materially different. The Toronto-Dominion Bank and its affiliates and related entities that comprise the TD Bank Group are not liable for any errors or omissions in the information, analysis or views contained in this report, or for any loss or damage suffered.
Download
Share: