The Weekly Bottom Line
Our summary of recent economic events and what to expect in the weeks ahead.
Date Published: July 5, 2024
- Category:
- Canada
U.S. Highlights
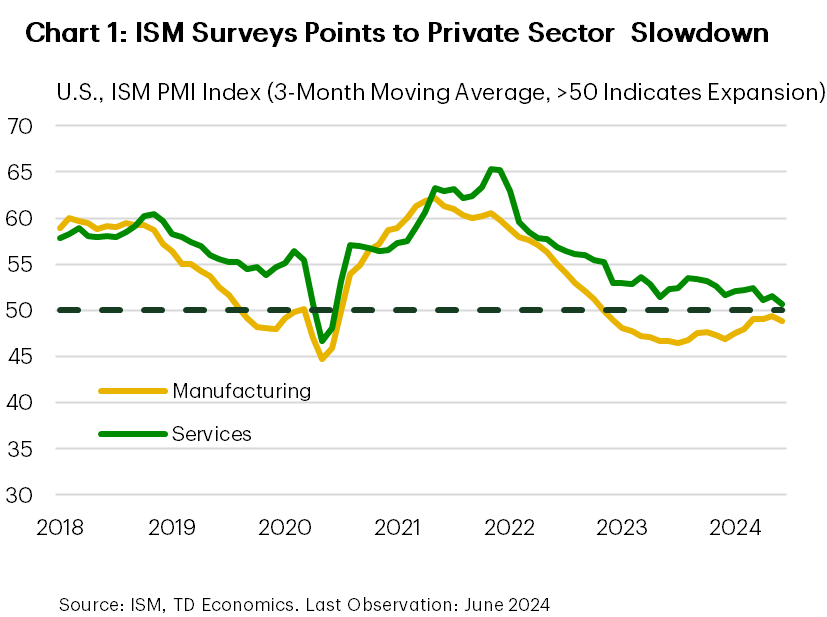
- This week’s data all flashed signs of an economy slowly gearing down.
- Both ISM indicators signaled contraction, while revisions to prior month’s payrolls gains and an uptick in the unemployment rate show the labor market continues to cool.
- All eyes will now be focused on next week’s Consumer Price Index report to see just how much this apparent slowdown is translating to the Fed’s goal.
Canadian Highlights
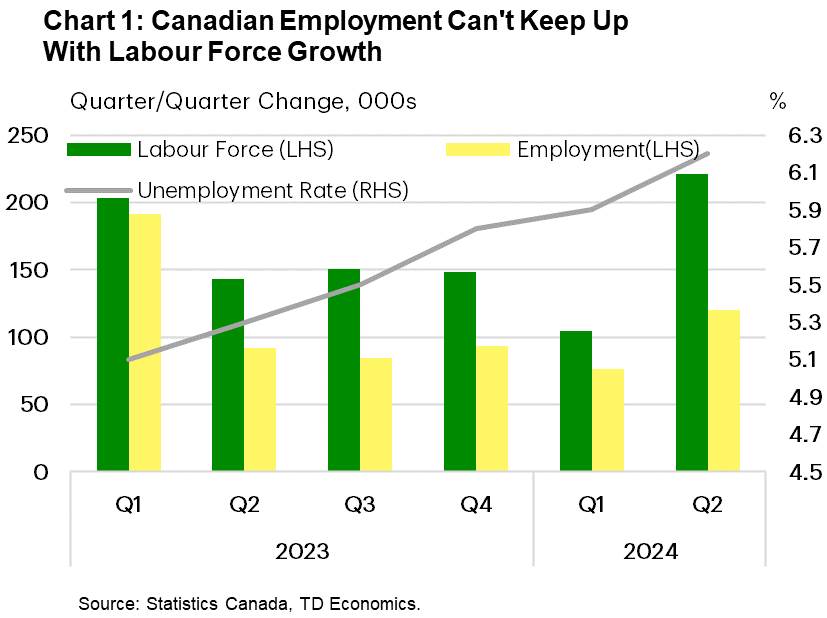
- A downbeat jobs report for June confirmed that Canada’s labour market continues to lose steam.
- Wage growth remains sticky, but should begin to soften as the unemployment rate tracks higher.
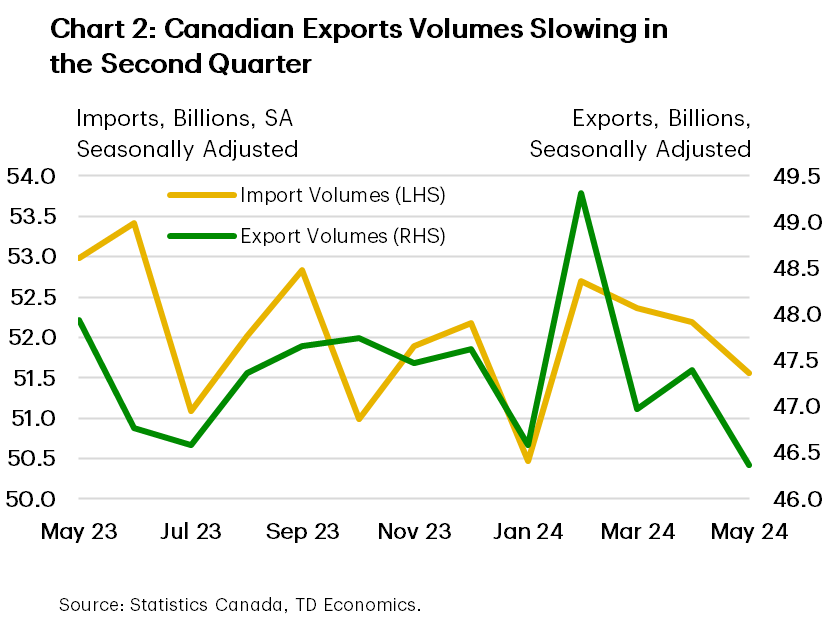
- International trade data for May suggests softer growth in the second quarter, but volatility in monthly readings leaves the external picture with a bit more uncertainty.
Despite the holiday, it was a data heavy week for the U.S., and all signs pointed to an economy that is slowly gearing down. The rally in U.S. Treasuries picked up steam as softer-than-expected survey data showed some cracks forming in the services sector and carried that momentum into Friday as the labor market continued to show signs of cooling. Taken together, the indicators signal that the economy might be cooling off enough to justify policy easing.
The ISM indicators have been wrong-footed several times by economic growth since the pandemic, most notably in late 2023 when real GDP growth jump to nearly 5% annualized without a discernible firming in the composite index. While that one quarter was an outlier, the trend in the data has been one of gradually decelerating growth (Chart 1). With June’s readings from the widely tracked indicator, the composite index now registered 50.5 in the second quarter, just above the 50 reading that signals growth. Now, this isn’t to say the economy will stall out, but rather that growth is trending lower, in line with the Fed’s goal of generating additional slack and cooling price pressures.
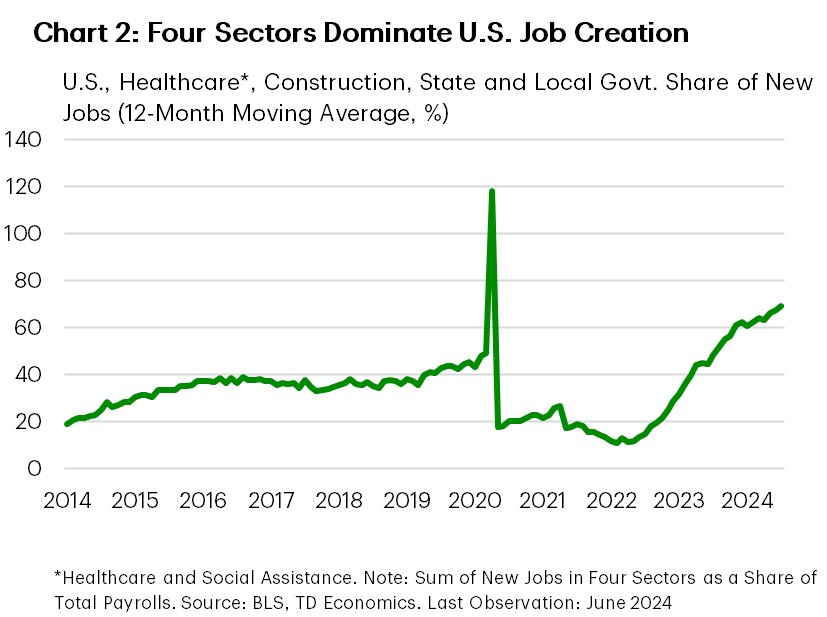
Friday’s Household and Payrolls figures reinforced the message that things are slowing down. Job gains in the two months to June were revised lower by roughly 100k positions, while the month’s reading fell roughly in line with what consensus was expecting. This wasn’t a bad report by any stretch, but it’s not the kind of gangbusters growth that drove the Fed to implement highly restrictive monetary policy. Looking under the hood can highlight this. Jobs gains were concentrated in construction, healthcare and social assistance, and local and state governments which, together, accounted for roughly 85% of the new positions in June. Moreover, they’ve been the real workhorse behind most of the job growth over the past year – being responsible for roughly 70% of the monthly job gains over this period (Chart 2) – larger than their usual contribution.
The unemployment rate also ticked up for the month (now up to 4.1%), but this wasn’t all bad news. The major driver here was that the number of people re-entering the labor market, or joining for the first time, drove much of the rise. What will matter going forward is whether the economy will have strong enough demand to absorb these new entrants – the slowing pace of new job creation suggests that it won’t be quite as easy to find work as last year.
So, with cracks clearly forming, the question for the Fed is when will decision makers have seen enough. The Minutes from June’s meeting put an emphasis on developments in the labor market and, to that end, today’s release was a step in the right direction. With private sector firms noting a clear slowdown in activity and new entrants into the labor market adding to labor supply, this should continue to work in the Fed’s favor, taking the edge off inflationary pressures. However, policymakers are likely to remain wary. The big story of 2023 and 2024 has been one of an economy that has consistently surprised with its remarkable resilience. To that end, all eyes are now focused on Fed Chair Powell’s testimony to Congress next Wednesday and Thursday’s release of June’s Consumer Price Index report to see just how much this apparent slowdown is translating to the Fed’s goal.
Andrew Hencic, Senior Economist | 416-944-5307
An update to Canada’s job market for the month of June was the main calendar-based risk in an otherwise quiet holiday-shortened week. Aside from this, markets continue to digest last week’s upside inflation surprise and what it means for the Bank of Canada (BoC) as they embark on their interest rate cutting campaign. Market moves were fairly muted as the Canadian 2 and 10-year yields closed the week effectively flat. Meanwhile, the Canadian dollar jumped a modest two-tenths of a cent to 0.733 USD.
Canada’s job market continues to gear down. The economy lost a few jobs in June, against consensus expectations for a +25k gain. The loss isn’t statistically significant when considering month-to-month fluctuations, but it is feeding into a broader trend of soft employment gains. Further signs of cooling were evidenced through another contraction in full-time workers and a pull-back in hours worked.
The economy continues to have difficulties absorbing new labour force entrants. For the past six-quarters, population-fueled labour force growth has outpaced employment, pulling the unemployment rate up over one percentage point over that time (Chart 1). At 6.4%, the jobless rate is at it’s highest level since January 2022 and half a percent above 2019 levels.
There is plenty in June’s job data that supports the case for lower interest rates. However, the BoC is likely focusing on the evolution of wages, which is presenting difficulties ahead of their July 24th meeting. Economy-wide wage growth accelerated in June, largely due to base-effects given the soft print one year ago. Still, it doesn’t take away from the fact wages have been growing at around 5% year-on-year for the past 18-months while productivity dipped over the same period. The acceleration of wages could stoke concerns around persistent inflation pressures but, in a recent speech, Governor Macklem has indicated the committee’s growing comfort that wage pressures will moderate.
On the growth side, international trade data for May suggests that trade could chop a bit off of second quarter growth as export volumes have slid more relative to imports (Chart 2). The highly volatile metals and non-metallic minerals sector, as well as the energy sector, are responsible for the drag. We’d caution against attributing too much to the current tracking, as past trade data has been subject to heavy revisions and monthly variances. Looking forward, we expect trade to boost economic growth in the third quarter as the Trans Mountain Pipeline (TMX) expansion bolsters energy exports.
Market pricing for an interest rate cut in July has whipsawed significantly since the Bank cut rates earlier last month. Today’s soft jobs reading have markets settling on a 60% probability that the BoC will deliver another 25 bps cut on July 24th. However, there are still a couple of very key indicators to go before we reach that point, including inflation and the BoC’s Business Outlook Survey, which will help shape the Bank’s view on whether the next cut is July or September.
Marc Ercolao, Economist
Disclaimer
This report is provided by TD Economics. It is for informational and educational purposes only as of the date of writing, and may not be appropriate for other purposes. The views and opinions expressed may change at any time based on market or other conditions and may not come to pass. This material is not intended to be relied upon as investment advice or recommendations, does not constitute a solicitation to buy or sell securities and should not be considered specific legal, investment or tax advice. The report does not provide material information about the business and affairs of TD Bank Group and the members of TD Economics are not spokespersons for TD Bank Group with respect to its business and affairs. The information contained in this report has been drawn from sources believed to be reliable, but is not guaranteed to be accurate or complete. This report contains economic analysis and views, including about future economic and financial markets performance. These are based on certain assumptions and other factors, and are subject to inherent risks and uncertainties. The actual outcome may be materially different. The Toronto-Dominion Bank and its affiliates and related entities that comprise the TD Bank Group are not liable for any errors or omissions in the information, analysis or views contained in this report, or for any loss or damage suffered.
Download
Share: