The Weekly Bottom Line
Our summary of recent economic events and what to expect in the weeks ahead.
Date Published: July 24, 2026
- Category:
- Canada
Canadian Highlights
- Good Canadian economic data this week were overshadowed by rising oil prices and new U.S. tariffs.
- The new tariff measures differ in scope and risk: Section 301 tariffs largely match prior assumptions, while surprise Section 338 tariffs target about 5% of Canadian goods exports to the U.S. and could disrupt trade flows.
- Canada’s domestic economy is showing good momentum, supported by softer inflation and stronger real retail spending, but the outlook remains clouded by trade uncertainty and geopolitical tensions.
U.S. Highlights
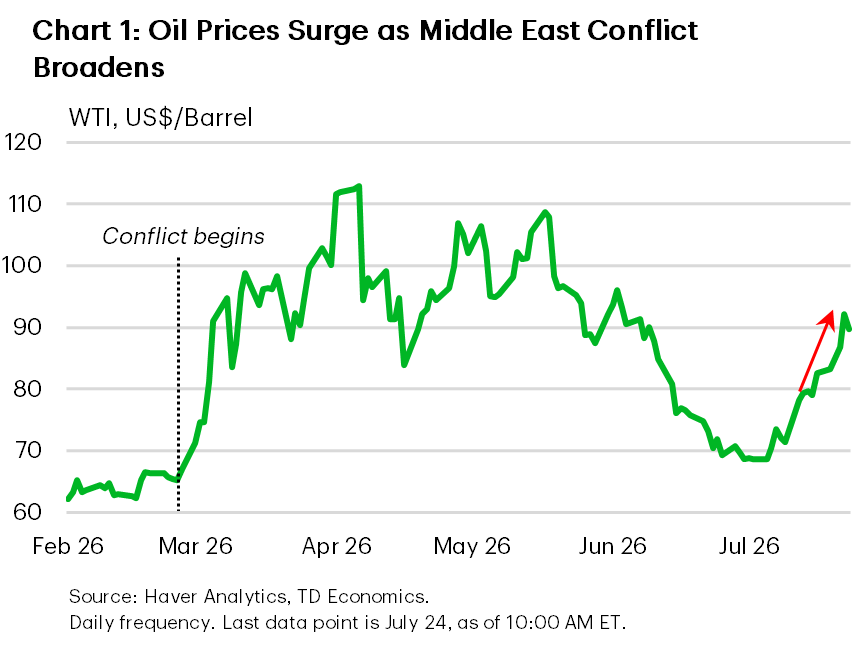
- Escalating Middle East tensions pushed WTI crude to $90 Friday morning. Treasury yields also rose, with the 10-year briefly topping 4.7%.
- The administration replaced the expiring 10% global Section 122 tariffs with Section 301 tariffs of 10% or 12.5% on imports from 60 economies, broadly preserving the existing tariff structure.
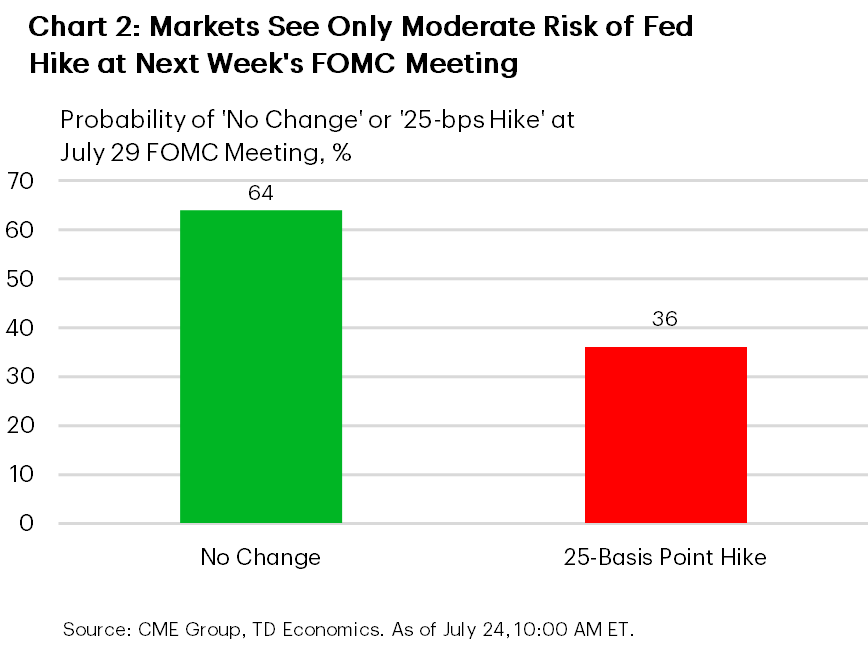
- Markets favour no change at next week’s Fed meeting, though the probability of a 25-basis-point hike remains non-trivial at roughly 36%.
It’s another week of geopolitical events making headlines and overshadowing good news at home. Oil prices kept rising as Houthi attacks raised fresh concerns about Saudi oil shipments through the Red Sea and trade tensions also returned to centre stage. The U.S. administration announced 50% tariffs on a targeted subset of Canadian exports under Section 338 of the Tariff Act of 1930 (see commentary), and new Section 301 tariffs came into force as it continues rebuilding its tariff wall). And while these events made headlines, Canada also received encouraging economic news, with another benign inflation report and stronger retail spending pointing to firmer economic activity in the second quarter.
The Section 301 tariffs largely preserve the status quo that emerged after the IEEPA tariffs were struck down. For Canada this means a 10% duty on non-USMCA compliant goods. This is consistent with what we assumed in our June forecast.
The Section 338 tariffs were a surprise and pose a different challenge. These tariffs are set to take effect on August 19th. The tariffs come in response to U.S. alcohol sales restrictions, tariffs on U.S.-made automobiles and longstanding disputes surrounding dairy market access under Canada’s supply management system. That said, the affected goods represent roughly 5% of Canadian goods exports to the U.S., despite including a wide range of products.
Unlike the broad-based tariff announcements of 2025, these duties appear carefully designed to maximize pressure on Canadian producers, while minimizing the impact on U.S. consumers and manufacturers, and there is no carve out for USMCA-compliant goods. Looking forward, businesses are likely to accelerate shipments before August, creating additional volatility in trade data through the summer. We also don’t know for certain that the tariffs will come into effect, with the U.S. and Canada continuing negotiations over trade and the USMCA agreement over the next month.
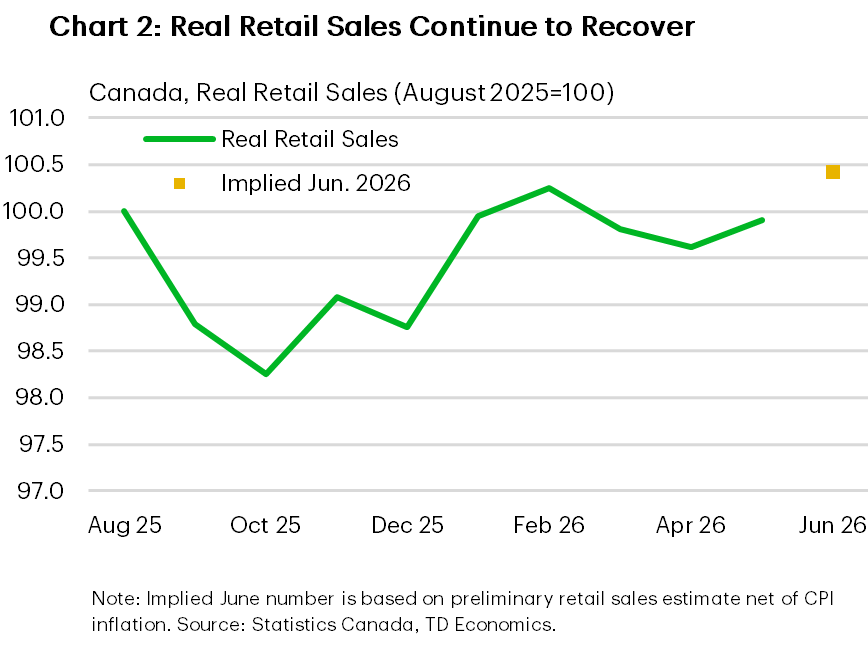
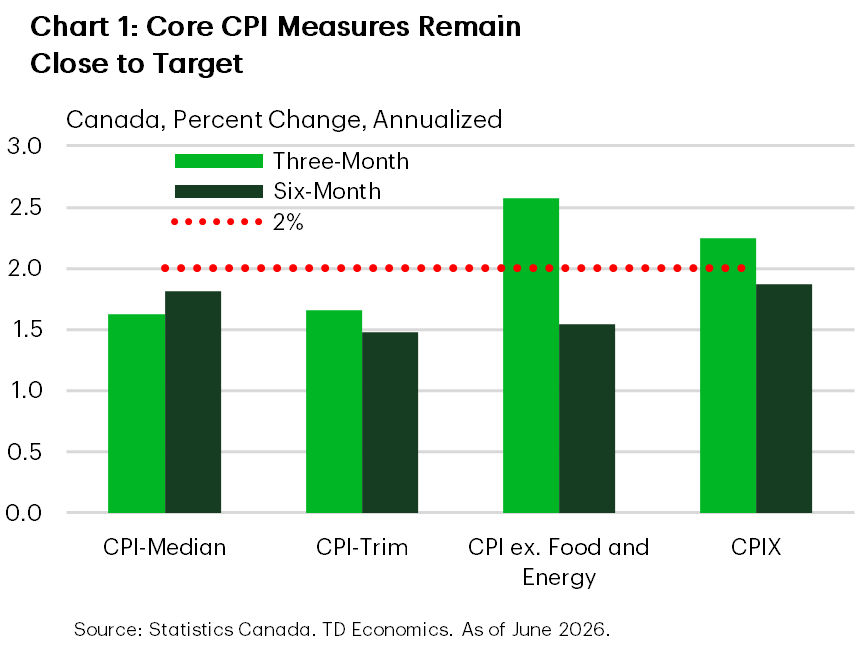
The trade uncertainty comes at a time when the Canadian economy has shown some verve. Consumer prices fell in June as sinking energy costs brought some relief. Moreover, core inflation continued to trend around the Bank of Canada’s target rate (Chart 1). Some of this relief will be reversed in July as oil prices have surged from last month’s lows, but the temporary relief is important in the context of the retail spending data. May’s real retail spending rose 0.3%, while falling June consumer prices and Statistics Canada’s advanced estimates suggest that June’s real gains could be even better (Chart 2).
The data suggest a meaningful rebound in Canadian economic activity during the second quarter, likely stronger than we had embedded in our forecast. Unfortunately, that improvement remains clouded by trade uncertainty and renewed geopolitical tensions. Still, our baseline assumption remains that cooler heads will eventually prevail. If they do, both oil prices and trade tensions should ease over time, allowing USMCA negotiations to progress and letting Canada’s domestic resilience shine through.
Following last week’s heavy economic calendar, the data flow slowed to a trickle, leaving geopolitics and tariffs to drive the narrative. Escalating Middle East tensions sent WTI crude oil prices sharply higher, reigniting inflation concerns and pushing Treasury yields up across the curve. The policy-sensitive two-year yield rose to just shy of 4.4%, while the benchmark 10-year yield briefly climbed above 4.7%. Both reached their highest levels since early 2025. Last week’s cooler inflation data significantly reduced the odds of an imminent rate hike, but this week’s developments are a reminder that oil-market volatility can quickly disrupt the disinflation process.
The U.S.-Iran conflict intensified, while supply disruptions broadened into the Red Sea after Yemen’s Houthis claimed to have attacked two Saudi oil tankers, raising concerns over shipping through a second critical energy chokepoint. WTI crude climbed by $10 per barrel from the end of last week to briefly above $93 before easing below $90 Friday morning (Chart 1). Marking another potential escalation, President Trump warned that the U.S. would attack critical infrastructure if Iran targeted vessels.
The longer oil prices and yields remain elevated, the greater the squeeze on household budgets. Mortgage rates have already moved higher to near 6.9%, a one-year high that will strain near-term affordability.
Renewed energy pressures may not be the only threat to the recent narrative of cooling inflation. New tariffs announced this week also raise upside risks to inflation. Earlier this week, President Trump signed proclamations imposing additional 50% tariffs on a selected group of Canadian imports, including wine, dairy products, and cement. The duties are set to take effect later in August, leaving some room for negotiations. Potentially more consequential for the broader inflation outlook is the new tariff regime that replaced the temporary 10% global surcharge under Section 122 that expired overnight.
Following investigations into forced-labor import enforcement, the U.S. imposed tariffs of 10% or 12.5% on imports from 60 economies under Section 301 of the Trade Act. The move appears to preserve the broader tariff status quo, suggesting that the immediate inflation impact will be limited. This is further supported by an extensive list of goods exempted from the tariffs, which dilutes the impact. That said, the Section 301 tariffs provide a more durable framework through which rates or product coverage could be increased later, potentially heightening the risk of retaliation from key trading partners.
Next week brings a much busier economic calendar. Attention will be focused on Wednesday’s FOMC rate decision and Chair Warsh’s post-meeting press conference. Markets currently favor no change at this meeting, though the possibility of a 25-basis-point hike remains non-trivial (Chart 2). Meanwhile, pricing puts the odds of two hikes by year-end at roughly 70%. The near-term path for monetary policy will hinge on inflation, and so depends on whether the conflict with Iran keeps energy prices elevated and how aggressively the administration amplifies its tariff regime.
Disclaimer
This report is provided by TD Economics. It is for informational and educational purposes only as of the date of writing, and may not be appropriate for other purposes. The views and opinions expressed may change at any time based on market or other conditions and may not come to pass. This material is not intended to be relied upon as investment advice or recommendations, does not constitute a solicitation to buy or sell securities and should not be considered specific legal, investment or tax advice. The report does not provide material information about the business and affairs of TD Bank Group and the members of TD Economics are not spokespersons for TD Bank Group with respect to its business and affairs. The information contained in this report has been drawn from sources believed to be reliable, but is not guaranteed to be accurate or complete. This report contains economic analysis and views, including about future economic and financial markets performance. These are based on certain assumptions and other factors, and are subject to inherent risks and uncertainties. The actual outcome may be materially different. The Toronto-Dominion Bank and its affiliates and related entities that comprise the TD Bank Group are not liable for any errors or omissions in the information, analysis or views contained in this report, or for any loss or damage suffered.
Download
Share: