Questions? We've Got Answers
Addressing Issues Impacting the Economic and Financial Outlook
Date Published: November 25, 2025
- Category:
- Canada
- Forecasts
- Financial Markets
It's hard to write anything these days without addressing the impact of tariffs, but this quarter bubbled up many other issues for our Q&A. The effects of the U.S. government shutdown, signals from the labor market and the Fed's next interest rate move are also examined. For Canada, policy shifts are in the spotlight, with the federal budget, immigration and the Bank of Canada's move to the sidelines all addressed.
- Q1. Why is the global economy resilient in the face of a historic increase in tariffs?
- Q2. How did the 43-day government shutdown affect the U.S. economy?
- Q3. Should we be concerned with the softening U.S. labor market?
- Q4. Will the Fed pause amid still-stubborn inflation and the absence of data?
- Q5. What's needed to bring relief to the U.S. housing market?
- Q6. Will Canada's federal budget drive "transformational change"?
- Q7. What is the outlook for the Canadian-U.S. trade relationship?
- Q8. What is the impact of immigration changes on Canada's outlook?
- Q9. Is the Bank of Canada done reducing interest rates?
- Q10. Where to from here on Canada's housing market?
Q1. Why is the global economy resilient in the face of a historic increase in tariffs?


The U.S. effective tariff rate has risen rapidly to a historic high. Yet the global economy has not faltered as much or as quickly as feared, with our global growth outlook largely unchanged from September. Here are a few reasons behind the resilience.
First, the implementation of tariffs has been gradual, with businesses exhibiting caution in immediately adjusting consumer prices amidst the uncertainty and the potential for renegotiated trade deals. On top of this, the actual tariffs collected have come in lower than the announced rates, for a variety of reasons. Supply chains have substituted away from higher-tariff imports, the U.S. administration has adjusted for imports deemed critical, and there have been implementation delays in duty collection. The actual duties collected as a share of U.S. imports clock in at around 9% rather than the 18% effective tariff rate. This gap has softened the blow.
Second, since realized tariffs are lower than the announced rates, the knock-on effect to inflation has likewise been more muted. Companies have absorbed much of the tariffs in their margins, sparing consumers from the bulk of the price increase (Chart 1). In another observation, import prices for some heavily tariffed sectors have fallen, which is usually a sign that foreign exporters are also bearing some of the cost, particularly for motor vehicles and consumer goods (Chart 2). Companies that are absorbing the price increases may eventually pass a greater portion to consumers, but that ultimately depends on their confidence for consumers to pay for the higher sticker price. Right now, that seems low. Much of the Main Street rhetoric is centered on grievances over the higher cost of living.
Finally, the global economy has benefited from some offsetting tailwinds. Tech-related investment in software, computers, and related equipment has contributed a large part to U.S. GDP growth in 2025. Soaring stock market valuations and slightly lower interest rates have facilitated larger investments as firms compete in artificial intelligence technology adoption.
Outside of the United States, central banks have lowered policy rates to a greater extent, and financial conditions have been favourable. China has been on the brunt of the highest tariff rates, and yet defied expectations due to the cascading effects of government support measures from the prior year. We still expect tariffs to drag growth in China, but the effect is folding into the economy in a more gradual fashion, particularly with the recent announcement of a one-year tariff-truce with the United States.
Q2. How did the 43-day government shutdown affect the U.S. economy?
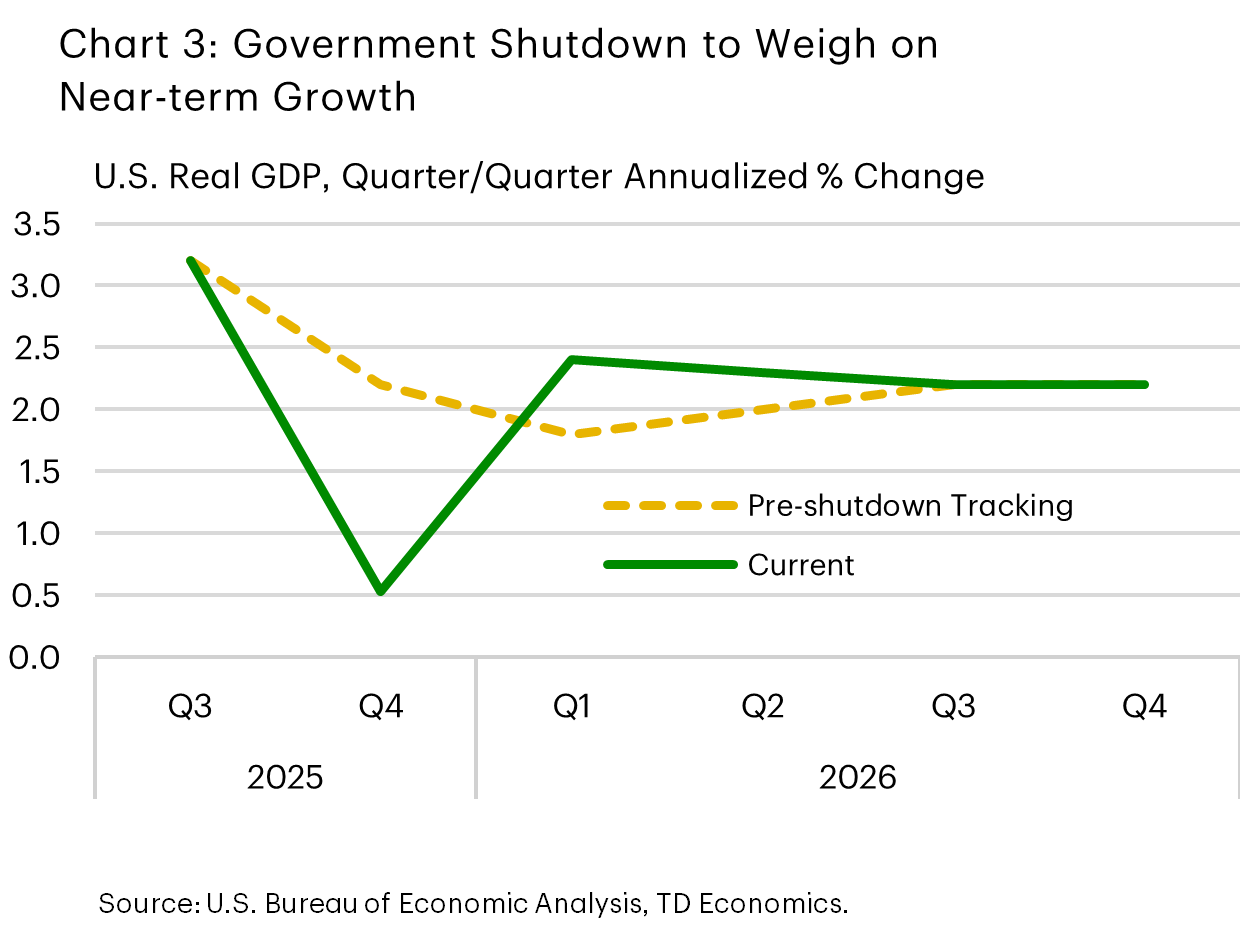
The six-week government shutdown will inflict near-term pain. Estimates by the Congressional Budget Office suggest that the economic drag could shave as much as 1.5 percentage points (annualized) from Q4 growth – equivalent to a $112 billion reduction in output. Most of the hit stems from the 650,000 furloughed workers who did not receive pay during the shutdown, squeezing discretionary consumer spending. However, there is also an impact from the government forgoing purchases of goods and services as well as knock-on effects to private investment stemming from delays in government payments, permits and inspections.
Fortunately, the funding bill signed on November 12th will provide full backpay to all furloughed employees, which should reverse most of the near-term spending impacts through H1-2026 (Chart 3). However, those workers can't go back in time to get that haircut or eat that family meal at a restaurant. The level of GDP should remain $40 billion lower by the end of next year relative to the counterfactual – underscoring the 'cost' of the shutdown.
Prior to the shutdown, the U.S. economy was strengthening on the heels of a weak start to the year. Revisions to Q2 GDP showed that consumer spending was much stronger than previously reported, while heavy investments in AI buoyed overall business investment. Importantly, consumer spending figures for July and August were also healthy, suggesting Q2's momentum carried into the third quarter. However, the strength in spending has been at odds with the softening labor market (see Question 4). Because hiring tends to lead household consumption, some cooling was expected even before the government shutdown started. And now those effects will be more pronounced. This means a healthy Q3 GDP tracking of over 3% is likely to be followed by a sub-1% pace in Q4. Looking through the volatility, 2025 will likely post a 2% pace, which is pretty remarkable considering the magnitude of uncertainty through the year and restrictive level of the policy rate relative to peer countries.
The outlook for 2026 may be only modestly better with the burst in AI investment unlikely to repeat its massive contribution to growth. On the flip side, consumers and businesses should benefit from more certainty on the trade front, a modest fiscal push from the One Big Beautiful Bill, and another leg down in interest rates.
Q3. Should we be concerned with the softening U.S. labor market?
Job growth slowed noticeably through this year and then the government shutdown obscured the trend. The latest payrolls data is only to September, but it showed job creation rising at its fastest pace in five months. However, payroll gains remain narrowly concentrated while trade exposed sectors are increasingly showing strain.
Triangulating other statistics, initial jobless claims through mid-November have remained rangebound at a low level. However, there have been conflicting signals from the various non-governmental data sources. Job openings reported by Indeed support cooling demand, as did the employment subcomponents from both the ISM manufacturing and non-manufacturing survey. The Challenger report also showed a spike in layoffs in October, raising eyebrows on what to expect come December when the official data is revealed.
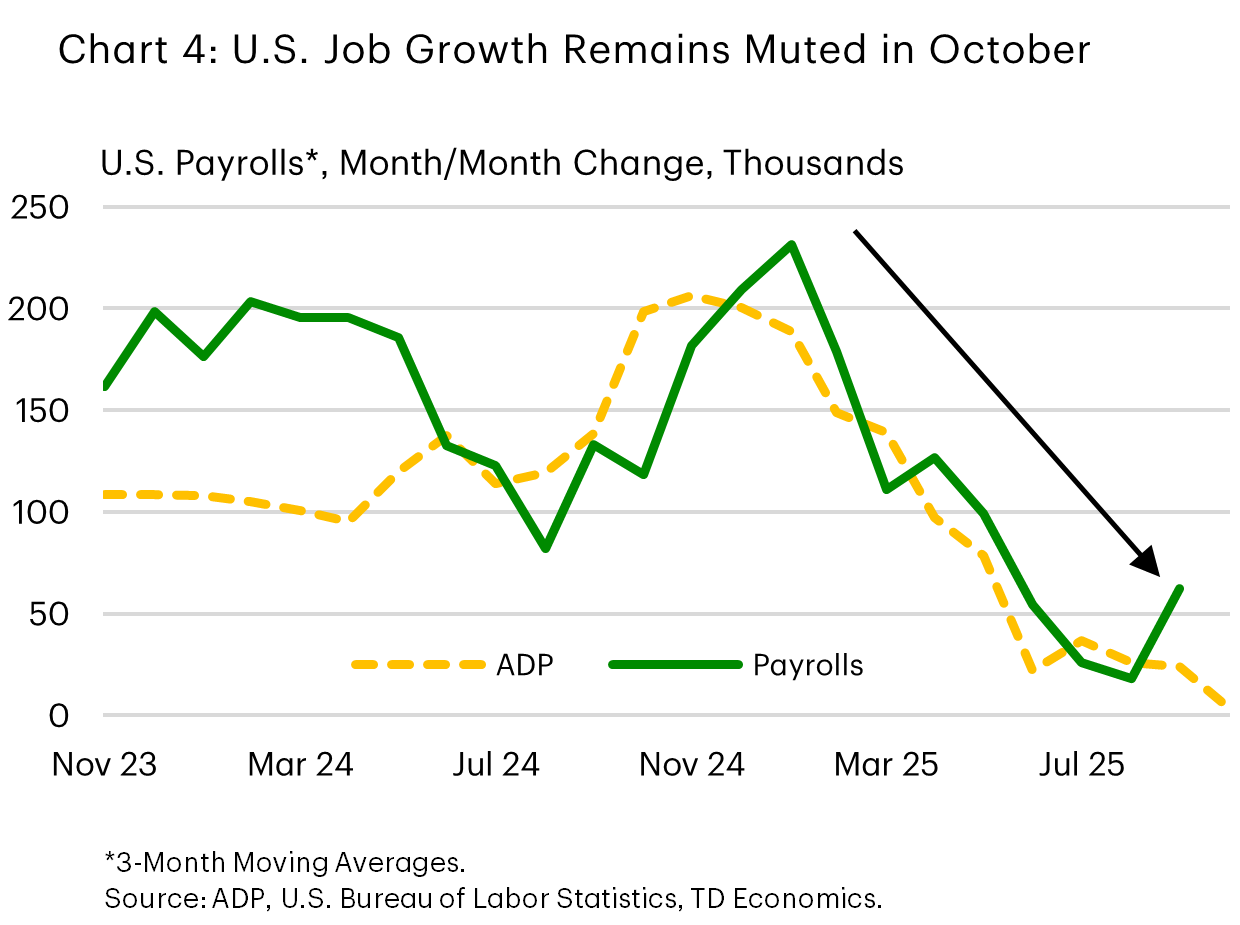
Then there's the ADP private payrolls, which went in the other direction. It rebounded by 42k in October after declining by 29k the prior month (Chart 4). Since the latter figure did not reflect the September payrolls data, where the private sector added a robust 97K positions, questions exist over its month-to-month predictive accuracy.
The bottom line is that the data is neither universally weak, nor strong. It's riding up the middle. That is, until the unemployment rate comes into scope.
It's still low but trending up, rising 0.3 percentage points since June. The gain would have been faster if not for a tapping down of the labor force. With fewer new workers entering the job market each month, fewer new jobs are needed to keep the unemployment rate stable. We estimate that job growth of about 45,000 per month should suffice to maintain the current jobless rate for this year, with next year’s breakeven pace falling to 30,000 jobs per month amid a further slowing in immigration.
That means our 2026 expectation for a gradual improvement in employment will place an automatic upper limit on the unemployment rate. We anticipate a monthly average of 85,000 jobs next year will cap the unemployment rate at the current peak of 4.4% before ending the year closer to 4.1%. But this business cycle brings a higher degree of uncertainty for both labor demand and supply. On the supply side, immigration policies are at the heart of that uncertainty, while several unique factors are pressing down on labor demand – from federal spending cuts, to rising cost pressures from tariffs, to rapid AI implementation.
Q4. Will the Fed pause amid still-stubborn inflation and the absence of data?
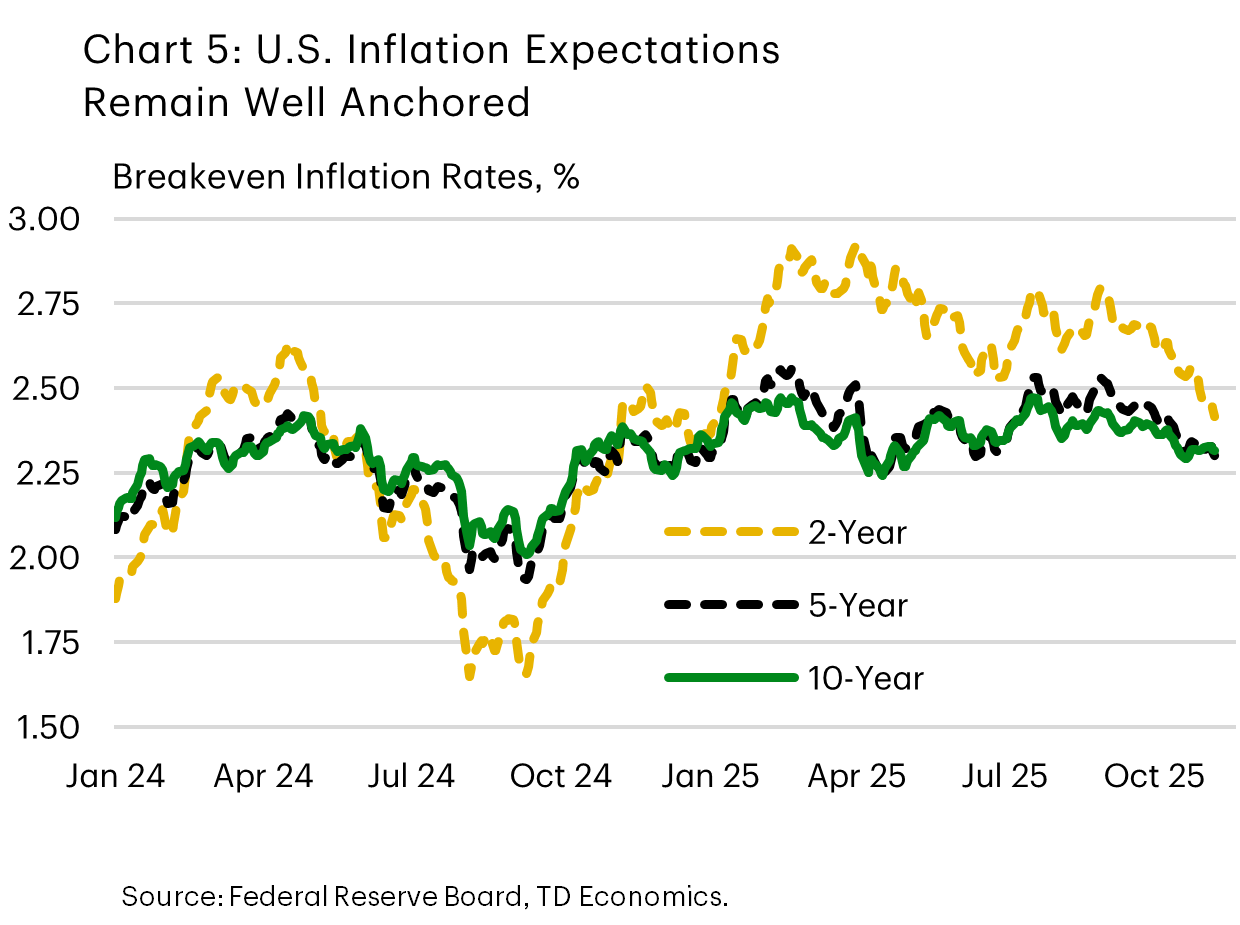
At this point, it's very likely. According to fed futures, a December cut is only about one-third priced. This is a big change from just a few weeks ago, when markets priced another cut with near-certainty. So, what's changed? A few things, but most importantly, the Bureau of Labor Statistics announced that it will not be releasing an October employment and CPI inflation reports, and the release of the November figures will not arrive until after the FOMC’s next meeting on December 10th. But even before that, there was evidence to suggest that a growing number of Fed officials were leaning in favor of a pause given the lack of data. This was further underscored in the FOMC’s October meeting minutes, which showed that while most participants judged more cuts would eventually be needed, many saw no case for easing in December. Chair Powell appears to be in this camp, noting at the last press conference that, “when driving in the fog, you slow down”. From that perspective, the FOMC is likely to skip the December meeting – buying a bit more time to play catch-up on the economic data – and then cut in January should the labor market data reinforce a slowing trend. But this is by no means a guarantee. Should the labor market show signs of firming or even stabilizing, the Fed could very well opt for a more extended pause, while maintaining an easing bias. From our perspective, the biggest argument favoring at least one more cut in early 2026 is that the policy rate remains above the neutral stance, which is estimated at 3.0% based on the median view of Fed officials. This leads us to believe there's little risk in another insurance cut without stoking further inflation. The calculus would be different if inflation expectations were becoming unanchored, but that isn't the case. Shorter-term breakeven inflation rates have drifted lower in recent months and are converging on the more stable 5-and-10-year measures (Chart 5).
If the Fed were to cut in January, a subsequent two meeting 'pause' seems likely. At 3.75%, the policy rate would be at the upper end of the range of neutral estimates – creating a natural stopping point to pause and assess the cumulative effects of the prior three cuts. Provided inflation drifts lower in Q2 2026, the Fed could maneuver the policy rate to 3.25% by Q3 of next year.
Q5. What's needed to bring relief to the U.S. housing market?
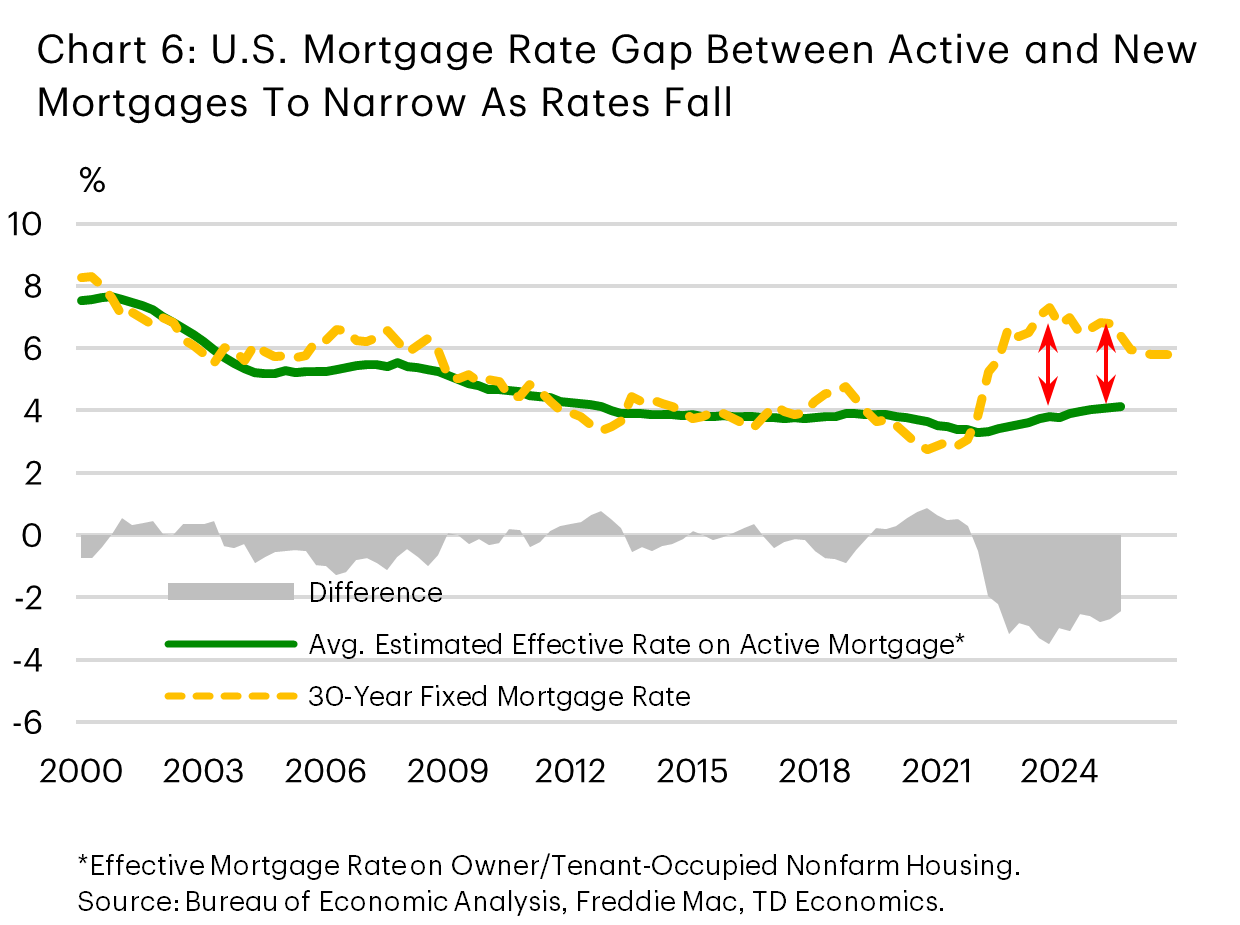
Mortgage rates have declined from 2023 highs and now hover around 6.3% for a 30-year fixed term. This drop has provided only modest relief to the cost of housing, and home sales remain historically low. Limited resale supply is also a barrier. While there is room for rates to fall further as the Fed continues to ease policy, we expect only a limited decline in mortgage rates to a 5.75%–6.00% range by mid-2026. This decrease should support some improvement in sales activity. It would also help reduce home financing costs and narrow the gap between the average interest rate on existing mortgages (about 4.10%) and the prevailing rate for new buyers (Chart 6). This gap has been a big barrier for existing homeowners who would have to trade-higher on a mortgage rate to finance a new home.
According to data compiled by the New York Federal Reserve, only 15% of mortgage holders are servicing a mortgage with a rate above 6%, while another 10% are between 5%-6%. The narrowing of the gap loosens this mortgage lock-in effect. In turn, this would boost supply on the market.
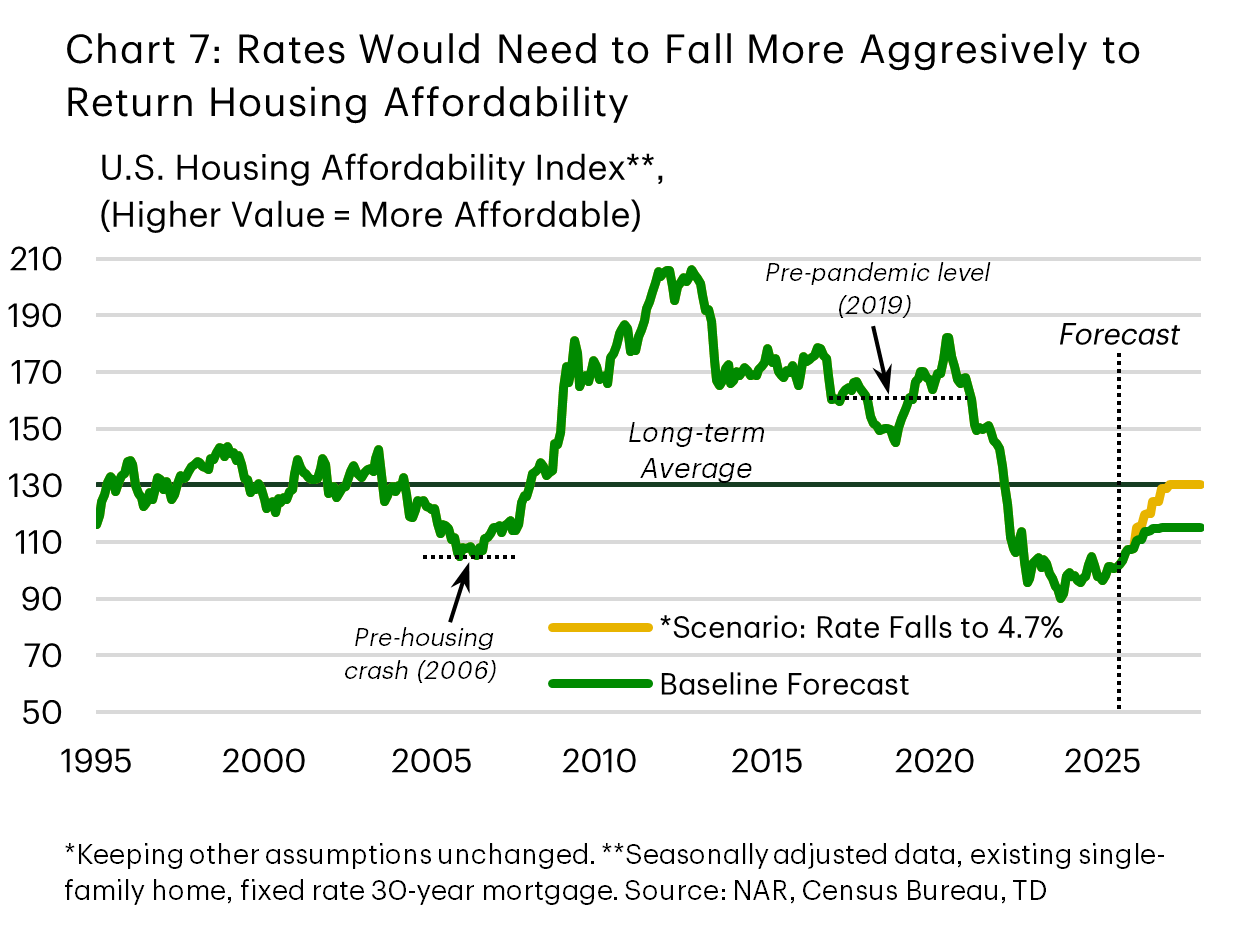
We forecast total home sales will rise by 5% in 2026 and 10% in 2027, which would still leave sales roughly 5% below pre-pandemic levels – highlighting the gradual nature of the recovery in the absence of sharply lower rates (for more, see our report here). For housing affordability to return to its long-term average, we estimate that mortgage rates would need to fall more aggressively to around 4.7% – all else equal (Chart 7).
There are two emerging policies from the Trump administration that could lift our forecast on both sales and prices. The first is the idea of portable mortgages – which allow borrowers to transfer their existing loan and rate to a new property. This would ease the lock-in effect. The second proposal is the 50-year mortgage, which could drop the average mortgage payment on a median-priced home by about $150/month on average, and as much as $250/month at the upper end. The range reflects uncertainty regarding how this mortgage product – which would almost certainly carry a higher interest rate than the 30-year fixed – would ultimately be priced. However, extending the amortization period also increases total interest paid over the lifetime of the loan to roughly double, if carried to maturity, and may have limited appeal. Regardless, both policy measures require time for necessary legislative changes and implementation – probably at least about a year – so their impact would still be some way off.
Q6. Will Canada's federal budget drive "transformational change"?
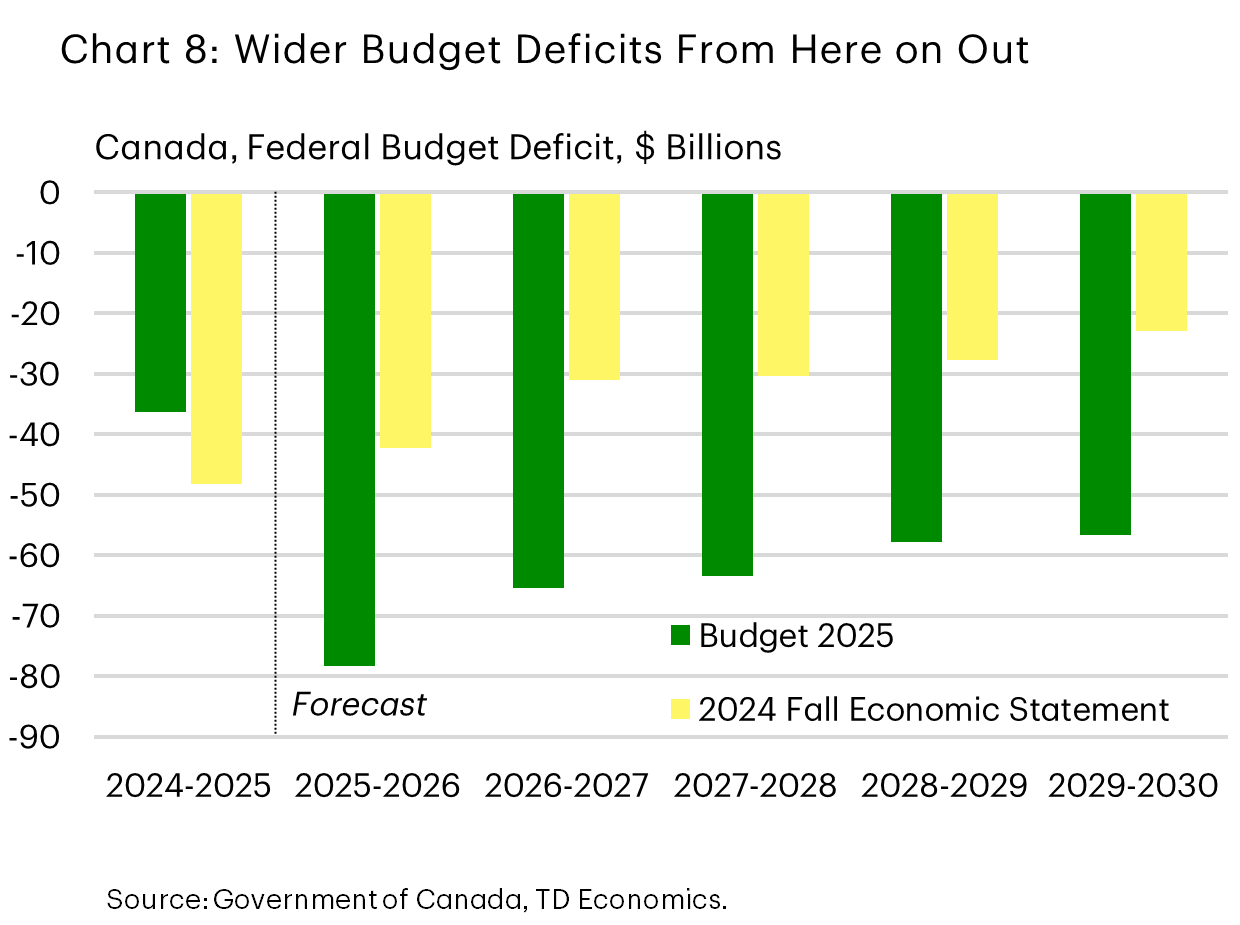
The budget read like a solid "first step" but fell short of offering a strong statement towards economic transformation. First, the effort to rotate spending from operational to capital measures is laudable. Large expenditures on housing, public infrastructure, and defense are all on the books (Chart 8). If disbursed as planned, inclusive of attracting even larger sums from the private sector and other levels of government, the lift to growth would be meaningful. But the size and complexity of projects will require time and patience, and the government ultimately opted for a limited fiscal expansion. Relative to the fiscal assumptions already built into our September forecast, this budget will not add a discernible boost. Back then, we assumed government spending would amount to roughly 1% of GDP next year, and we’re sticking to our guns until there’s strong evidence of lift-off on the large government initiatives. Our view holds that Canada's economy should improve slightly from this year’s sub-1% pace on a Q4/Q4 basis to 1.6% in 2026. However, this is historically modest pace and speaks to the challenges of the times.
The budget did not contain, nor did it plan for, a comprehensive review of taxes or spending and transfers. As we have written, the current tax and regulatory environment is clubbing productivity growth (see report). The upcoming legislation to extend the accelerated capital expensing initiative (expanded and redubbed the Productivity Super-Deduction) lowers the marginal effective tax rate for businesses but falls short of a wholesale review.
Of course, looming over all investment decisions is Canada's highly uncertain operating environment. Even with tax relief (be it for marginal investments or through the statutory rate), the lack of clarity on future U.S. market access limits the effectiveness of the tax initiatives within the budget, arguing that bolder steps are needed to carve out a new competitive global position.
On the regulatory side, the government is leaning hard on the Major Projects Office (MPO) to smooth and hasten the approval process for major infrastructure, mining and energy projects. Rising regulatory requirements have been synonymous with the Canadian economy. The government announced a 60-day regulatory review in the summer and intends to introduce legislation to streamline and modernise unnecessary barriers. But the results of these efforts will not become clear until next year, at best. The MPO is a new entity that will need to be observed for its effectiveness, including whether investors are willing to come to the table with large sums of capital and time for projects that will still require several other steps for completion, including varying degrees of technical and economic viability studies, securing financing, building supporting infrastructure, and a production ramp-up period.
In addition, investors and policymakers must consider the new economic paradigm. No matter the trade deal eventually cut with the United States, Canadian companies will have less and/or more costly access compared to prior years. So, while the budget tilts the competitive landscape in the right direction, it doesn’t do enough to kickstart transformational change.
Q7. What is the outlook for the Canadian-U.S. trade relationship?
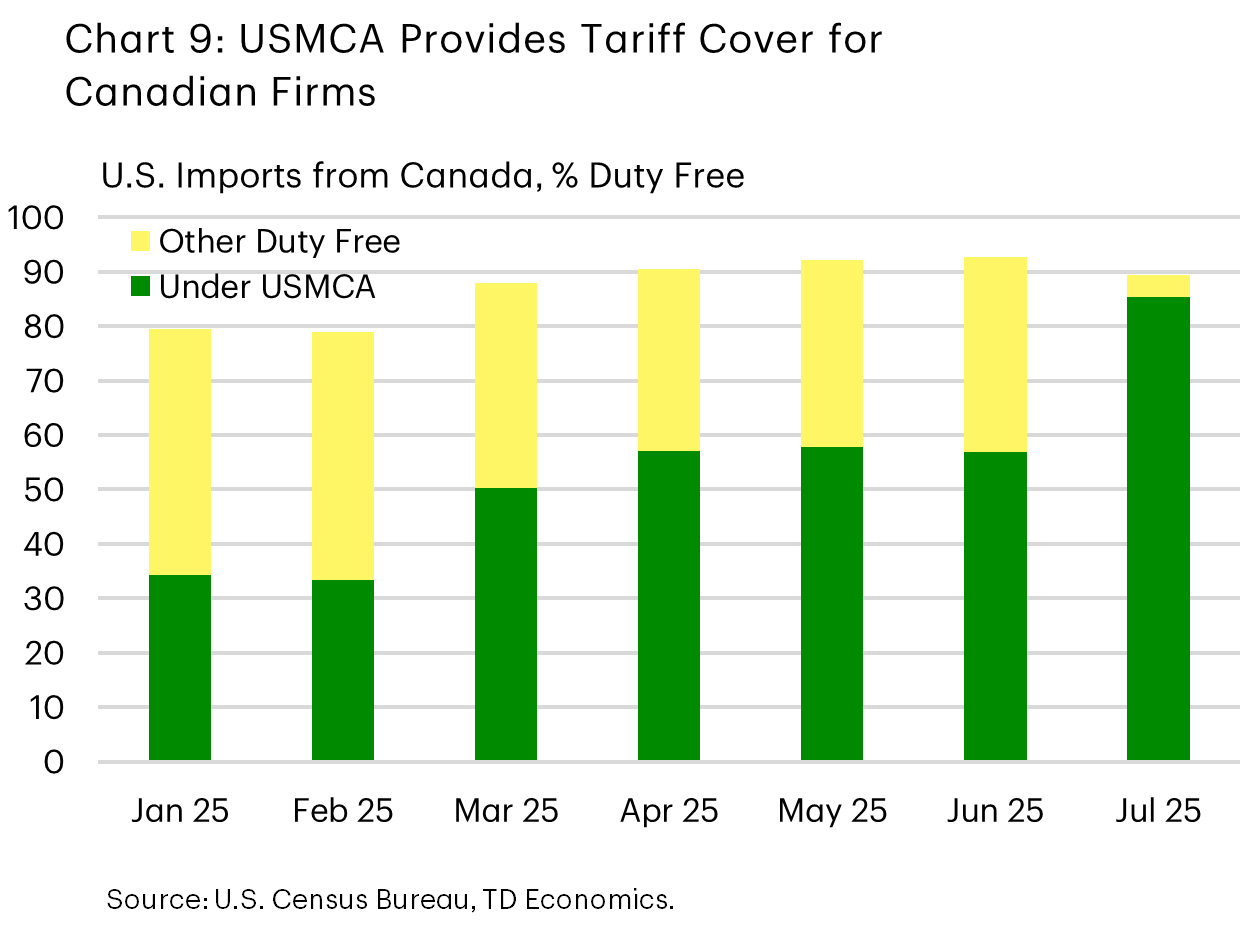
For the time being, we assume the status quo on U.S. tariffs continues. There is a significant chance Canada sees some tariff reductions, but also a risk that the USMCA is altered to impose more quotas or higher costs on businesses relative to prior years. At the moment, tariff-free access to the United States hinges on firms ensuring content compliance with the USMCA agreement. From the Canadian perspective, roughly 85% of July's exports (Chart 9) were labelled as such (and an additional ~4% entered duty free under other labels). Even so, total exports to the U.S. are down roughly 9% year-on-year amidst high uncertainty and extremely punitive tariffs in other areas.
What tomorrow looks like is anyone’s guess. The U.S. Supreme Court is currently reviewing the legality of the President's authority to impose tariffs under IEEPA. This law was applied to impose 35% tariffs on most non-USMCA Canadian goods (and 10% on energy). That ruling will not address duties as high as 50% on autos, steel, aluminum and lumber, which fall under separate legal authority. Even if the IEEPA tariffs are struck down by the courts, the President would likely turn to alternative legal avenues. The end result remains a highly uncertain business operating environment.
And the risks don’t end there. Next year's review of the USMCA agreement is underway. Recent U.S. trade agreements with other partners offer some guidance. There are generally four components to every deal. First, the baseline tariff rates imposed on countries are reduced from elevated “reciprocal” levels to a typical range of 10-15%. Second, countries must remove any retaliatory tariffs and lower other export barriers for American companies. Third, there is some relief on the product specific Section 232 tariff rates. Fourth, trade deals include a large commitment of investment dollars and/or purchase agreements of American products.
That’s the backdrop that Canada faces in negotiations. With no indication on how much Canada will be able to deviate from this blueprint, for now we’ve assumed the status quo holds.
Q8. What is the impact of immigration changes on Canada's outlook?
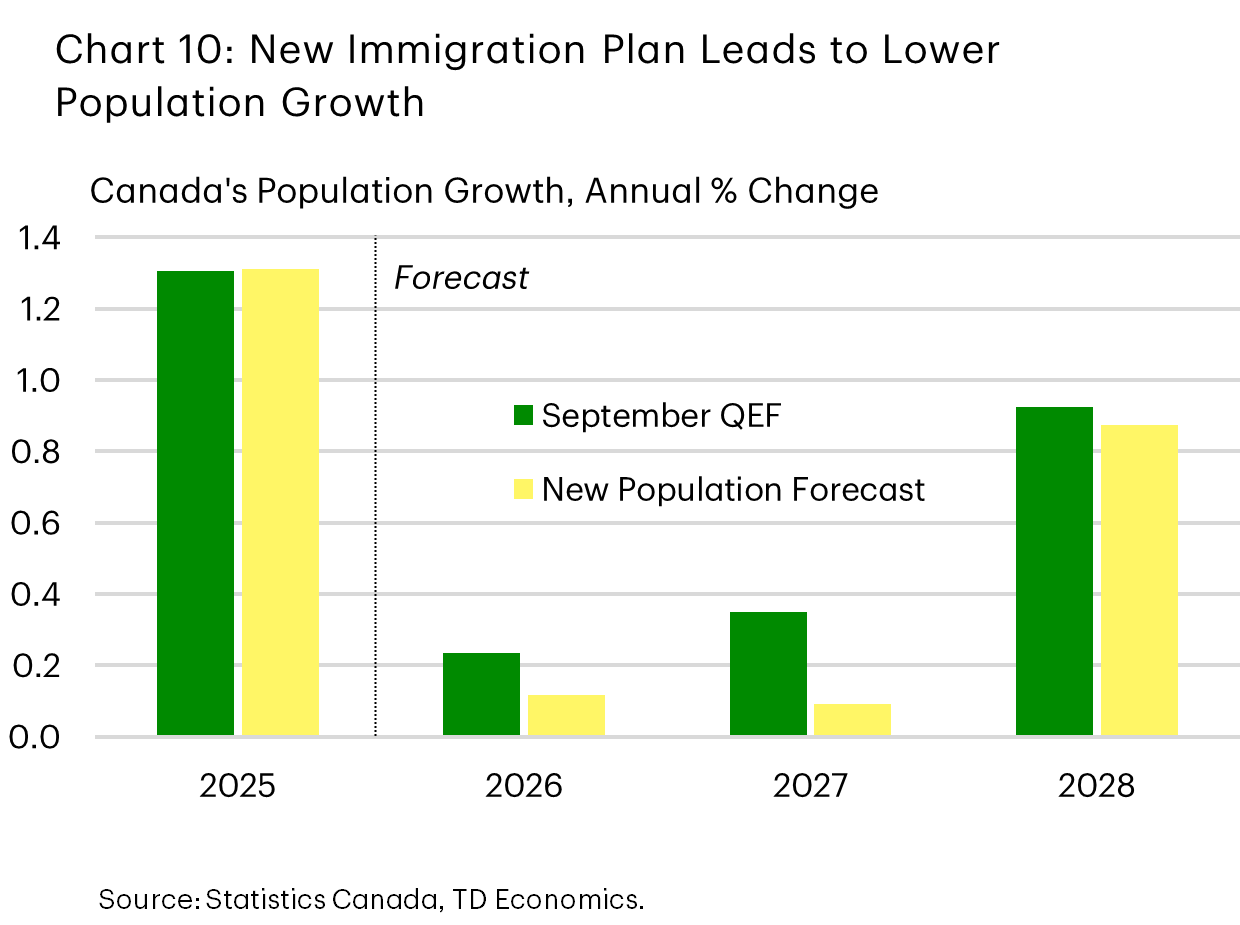
The federal government's updated Immigration Levels Plan reveals another dial back in population growth, that has lowered our forecast by a cumulative 0.5 percentage points (ppts) between now and 2028 (Chart 10). This translates to 300k fewer people in the population base relative to our prior forecast.
The change reflects a further reduction in non-permanent resident (NPR) permits through 2028, mainly due to a 50% reduction in study permits. In contrast, permanent resident targets were preserved at 380k entries for 2026, and a matching amount in 2027. The latter reflects a 2% upgrade over last year's plan.
Our recent report shows that following changes in population planning last year, Canada's social and economic infrastructure benefited from some relief. On the margin, we expect the additional reduction in NPRs will keep downward pressure on the nation's purpose-built accommodation rents and condo asking rents. However, because temporary newcomers have limited involvement in ownership markets, there is little knock-on effects in that segment. This plan also confirms that near-term labour force growth is on pace to flat line until 2027, capping the upside to Canada's unemployment rate.
On a macro level, the new immigration targets result in a marginal downgrade (-0.1 ppts) to our estimates for population growth into next year and have no material impact on our expectations for household spending or GDP growth.
Q9. Is the Bank of Canada done reducing interest rates?
For the time being, yes.
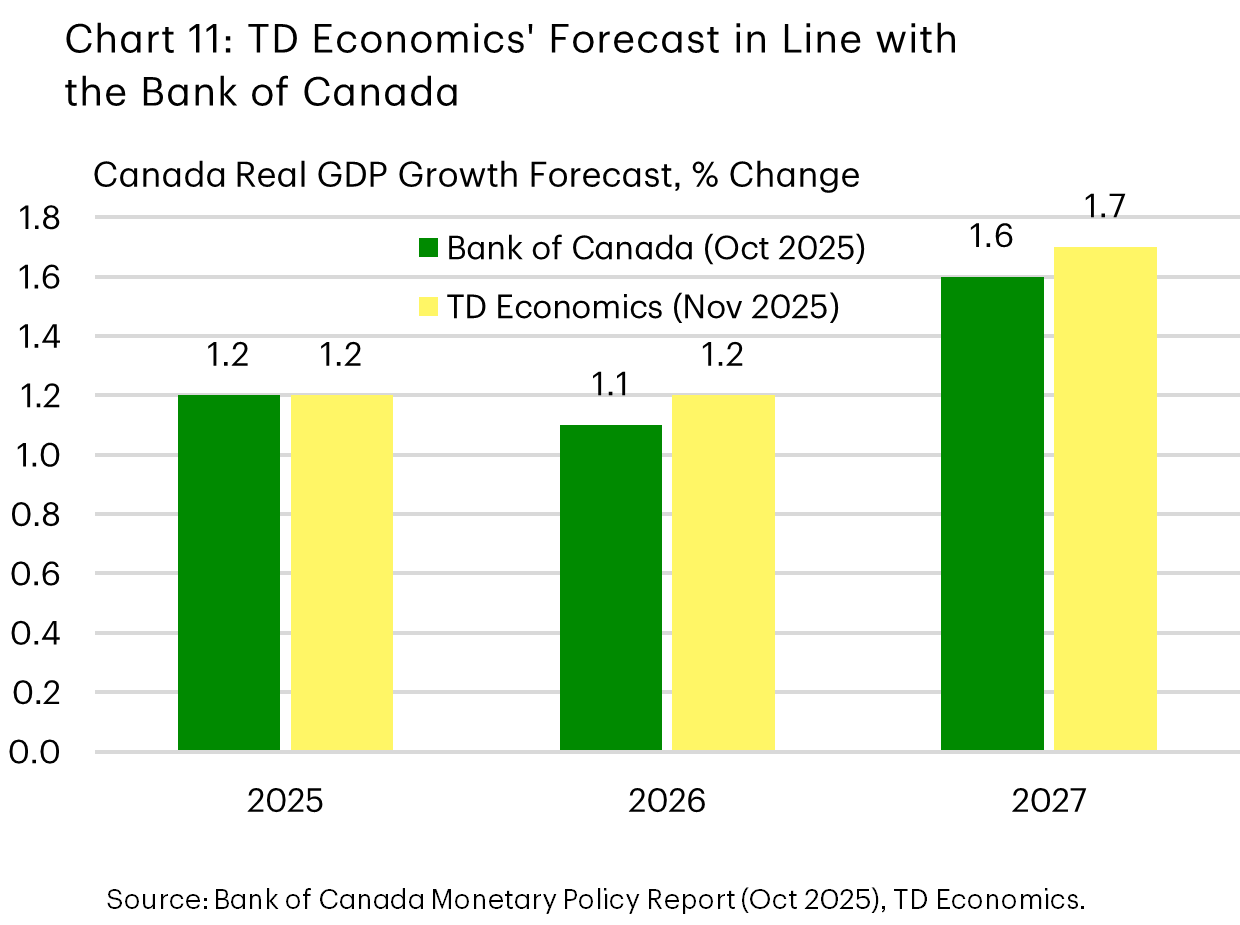
The Bank of Canada (BoC) has already made substantial interest rate reductions over the past year and a half, slicing the overnight rate from 5.00% to 2.25%. The last 100 basis points came in the wake of President Trump's trade war and are in the early stages of working their way through the economy. In the October decision, Governor Macklem was unusually prescriptive in saying that if the economy progresses in line with the Bank's forecast for just above 1% growth through 2026, inflation is likely to remain close to 2%, and further rate cuts will not be required.
What's under the hood of the steady inflation outlook merits more attention. The Bank expects the inflationary pressure from higher costs for businesses stemming from the trade conflict to be offset by the economy's domestic weakness. Furthermore, Canada's economic troubles are not just cyclical, which is typically when rate cuts are most effective as a key policy response. A structural transition is simultaneously reducing the productive capacity of the economy (hopefully temporarily). As Governor Macklem has discussed, this confines the ability of monetary policy's blunt tool – the overnight rate – to boost demand. The structural challenge is best addressed by specific government policy measures to remove barriers and unlock the economy’s potential (see question 6).
With the BoC’s updated forecast, it now lands close to our view from September that remains largely unchanged (Chart 11). Given the highly uncertain economic environment, a future rate cut cannot be fully dismissed, but it would require an economy that’s rapidly cooling relative to the Bank’s already modest expectations.
Q10. Where to from here on Canada's housing market?
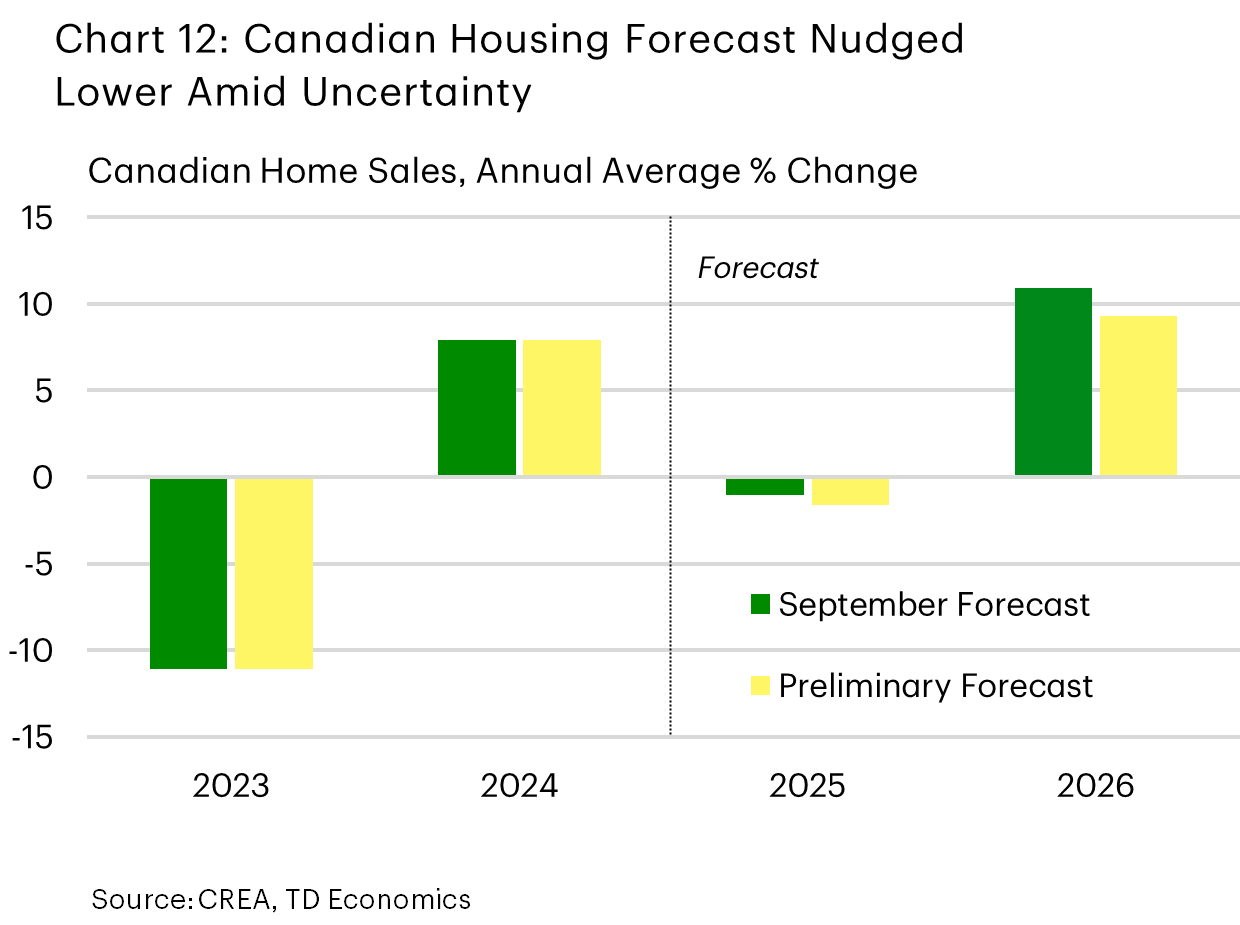
April through July kickstarted a modest recovery in Canadian home sales after a couple of months of dredging the bottom. However, sales have see-sawed since. Canadian average home prices, meanwhile, have managed to climb 5% from April through October, supported by tight conditions in much of the country outside of B.C. and Ontario.
It's early days, but we're tracking softer Q4 gains for home sales and home prices than previously projected. Economic uncertainty is weighing on the market a bit more and offering some offset to past interest rate relief. This weight is likely to persist next year, as CUSMA re-negotiations get underway. Accordingly, this suggests only modest downgrades to our 2026 projections for growth in Canadian home sales and average home prices (Chart 12).
The more important factor is that the changes do not alter the narrative that the Canadian housing market will remain on a path of gradual recovery, supported by pent-up demand and a stabilization in the job market.
For any media enquiries please contact Oriana Kobelak at 416-982-8061
Disclaimer
This report is provided by TD Economics. It is for informational and educational purposes only as of the date of writing, and may not be appropriate for other purposes. The views and opinions expressed may change at any time based on market or other conditions and may not come to pass. This material is not intended to be relied upon as investment advice or recommendations, does not constitute a solicitation to buy or sell securities and should not be considered specific legal, investment or tax advice. The report does not provide material information about the business and affairs of TD Bank Group and the members of TD Economics are not spokespersons for TD Bank Group with respect to its business and affairs. The information contained in this report has been drawn from sources believed to be reliable, but is not guaranteed to be accurate or complete. This report contains economic analysis and views, including about future economic and financial markets performance. These are based on certain assumptions and other factors, and are subject to inherent risks and uncertainties. The actual outcome may be materially different. The Toronto-Dominion Bank and its affiliates and related entities that comprise the TD Bank Group are not liable for any errors or omissions in the information, analysis or views contained in this report, or for any loss or damage suffered.