Consumption in the Time of Inflation
Maria Solovieva, CFA, Economist | 416-380-1195
Date Published: May 3, 2022
- Category:
- US
- Financial Markets
- Consumer
Highlights
- The net worth of American households surged by 30% over the past two years, setting a record of $150 trillion in 2021. Soaring stock market and house prices helped boost this expansion, accounting for almost two thirds and one quarter of gains, respectively.
- Still, money is not buying happiness. Consumer sentiment is the lowest it's been since the Global Financial Crisis as high inflation not seen decades is at the top of consumers' minds.
- Faced with higher prices on essentials, consumers are likely to cut back on discretionary spending, including the big-ticket items favored during earlier pandemic restriction periods.
- In contrast, the desire to make up for lost time during the pandemic should mute consumers' sensitivity to rising prices in close-contact services. Growing momentum in services spending should offset the decline in goods expenditures, keeping real consumption growth just shy of 3% for the year.
After two years of living through COVID-19, it finally starts to feel like the worst of the pandemic is in the rearview mirror. While the risk of a more virulent variant remains, most scientists agree that the virus is entering a less potent endemic stage. As the shadow of COVID-19 lifts, more people should be able to embrace the freedom of movement and spend on activities that may have been restricted or avoided for much of the last two years. Thankfully, they have the financial resources to do that. One of the by-products of the pandemic-induced recession is a higher level of household wealth, which, combined with exceptionally strong job growth, should be a harbinger of strong consumer spending growth.
Despite this, consumer sentiment is the lowest it's been since the Global Financial Crisis as inflation not seen in decades is at the top of consumers' minds. High inflation reduces consumers' incomes in real terms, and we expect that to weigh on real consumer spending over the coming quarters (see our forecast). Higher prices for many essentials will exact a heavy toll on modest income households. Another worry is that high prices today and expectations for elevated future prices will lead consumers to delay purchases, further weighing on spending momentum. Overall, we think that the effect of high inflation on the economy will be limited to a slowdown, rather than an outright downturn.
Households' Ledger Has Never Looked Better
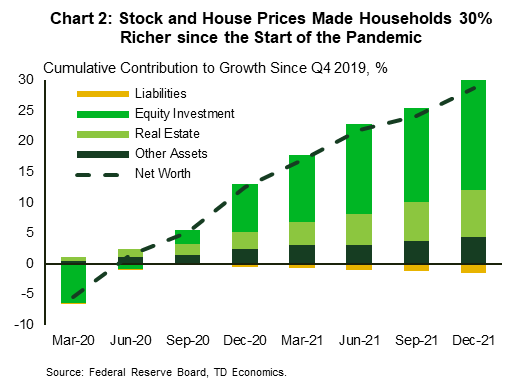
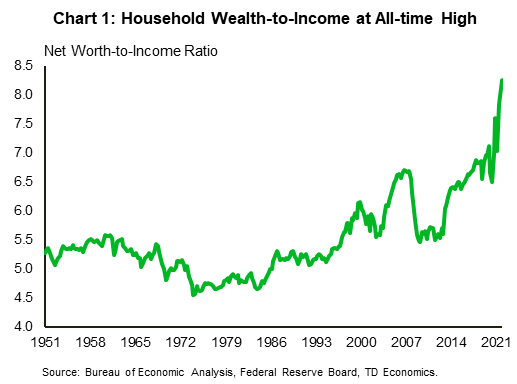
The net worth of American households and nonprofit organizations surged to a new record of $150 trillion in the fourth quarter of 2021, lifting the aggregate wealth-to-income ratio – money saved vs. money earned – to an all-time high of 8.3 times (Chart 1). In the two years of the pandemic, wealth increased by an impressive 30%, mainly on the back of stock market gains, which accounted for at least one third of the overall growth in assets (or more than 60%, if counting retirement accounts and mutual fund holdings) (Chart 2). Soaring house prices have also boosted real estate wealth, with more than a quarter of gains in net worth due to the recent housing boom.
Expansion of liquid savings has also been a driver, accounting for roughly ten percent of wealth growth. The inability to spend in many areas early in the pandemic (primarily services) left many households with higher savings than normal. With the help of an unprecedented level of government stimulus, American households were able to build up excess saving (i.e., saving above what would have been accumulated absent the pandemic) of almost $2.7 trillion, which is roughly twice the average of other advanced economies, when measured as a share of GDP.
A recent study by the Federal Reserve Board finds that changes in spending and the progressive design of income support measures may have helped improve the economic well-being of lower income groups. They estimated that almost 29% of all excess saving is held by families in the lowest 40% of income distribution.1 That's relatively higher than the average of 20% held by families in the top 40-99% of income distribution and higher than an estimated 8% of excess saving held by the top 1% of income earners, who typically account for at least twice that share of total deposits. Additionally, lower income families' estimated share of savings during the pandemic is almost three times higher than historical average of 10% reported by the Distributional Financial Accounts over the past twenty years. This points to some progress in reducing wealth inequality among households.
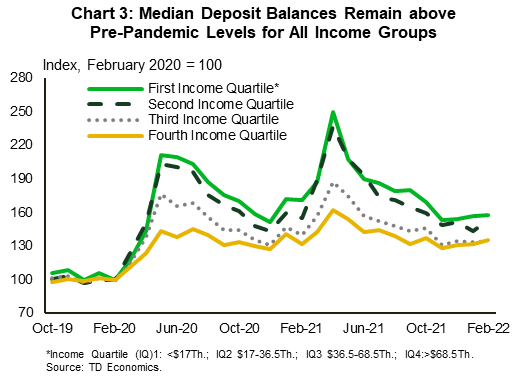
Remarkably, a lot of this excess saving remains untouched, as the strong economic rebound and healthy labor market has provided the means to support increasing spending. Our internal data suggests that deposit balances, which temporarily spiked with each stimulus payment, remain elevated relative to their pre-pandemic median balances. In February 2022, the lowest income groups still maintained deposit balances 50% above pre-pandemic levels (Chart 3).
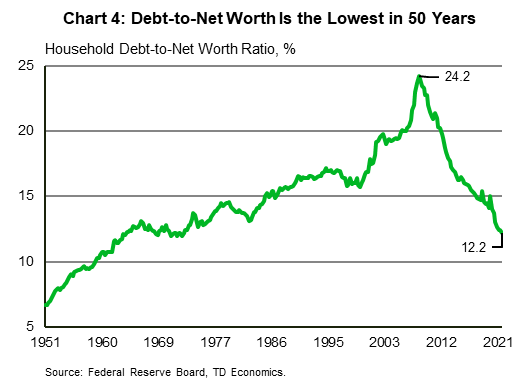
Meanwhile, the debt side of the balance sheet has grown, too, but at a much slower pace than assets. Since the beginning of the pandemic, household liabilities increased by 11%, driven largely by home mortgages that have accounted for two thirds of the increase. Nevertheless, wealth accumulation outpaced debt accumulation with the debt-to-net worth ratio – a proxy for the level of leverage – reaching the lowest level in more than 50 years (Chart 4). An important caveat to this is that debt is fixed, while assets are not. Asset prices can fluctuate, and recent volatility in the equity market put upward pressure on this ratio, but according to our estimate, not by more than one and a half percentage points.
From a credit quality perspective, debt growth was accompanied by a declining delinquency rate. Or put simply, consumer credit quality improved. This improvement is in part due to government-sponsored debt deferral and forbearance programs, at least at initial stages of the pandemic. Also, with government cash assistance and reduced spending, households were able to pay off a significant amount of unsecured consumer debt, which typically stands last in the repayment line and drives acceleration in derogatory standing among households. Indeed, as credit cards are becoming popular once again for day-to-day expenditures, consumer credit performance remains stable and is expected to normalize (rather than deteriorate) from abnormally low levels.
Money Doesn't Buy Happiness
Given the strength of household balance sheets, the consumer should have been in a better mood, but it seems money does not buy happiness. Given sky-high inflation, tightening credit conditions and increased geopolitical anxiety, American households are increasingly concerned that their personal finances are at risk of rapid deterioration. In March, the University of Michigan consumer sentiment indicator – one of the best measures of consumers' sensitivity to inflation – slipped to the lowest level in the past decade, before partially recovering in April.2
Despite consumers' negative attitude towards spending, so far there is little evidence of deteriorating demand. In the first three months of 2022, real consumption grew by 4.8% year-on-year, only moderately slowing from an average of 7.0% of the previous six months. Even demand for gasoline which should be the most sensitive to price changes, remains unusually strong. Historical relationships suggests that an increase of prices of the magnitude experienced in 2021 would result in at least 5% decline in real fuel consumption, instead of an increase of almost 10% experienced last year.
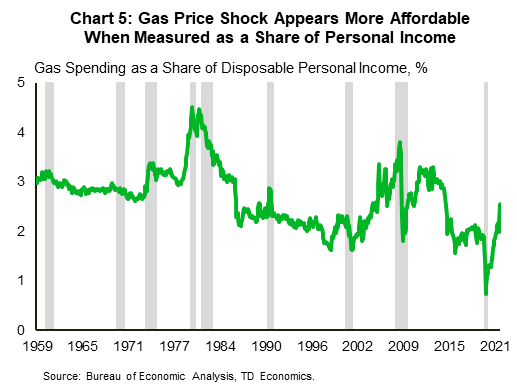
This flip in correlations adds to other oddities of the pandemic and can be explained by an unprecedented drop in demand at the peak of lockdowns followed by similarly unprecedented recovery in spending and income. On aggregate, nominal gas spending as a share of nominal disposable income just recovered to the pre-pandemic level and is remarkably far from what it was during the 1970's energy crisis, often cited as an episode comparable to current events (Chart 5).
This doesn’t mean that consumers will continue to tolerate higher gas prices. Russia's invasion of Ukraine, followed by oil sanctions and private companies' boycotts, added another level of inflationary shock. The average price at the pump went up by almost a full dollar per gallon in the matter of 20 days before stabilizing around $4.20. Watching the price jump at the time when you expect some breathing room from inflationary pressure could very well be that proverbial straw that breaks demand. Indeed, real personal consumption expenditures on gasoline and other motor fuels dropped 4.2% in the first quarter of 2022 – the lowest reading since Q2 2020, when demand for gas deteriorated rapidly due to lockdowns.
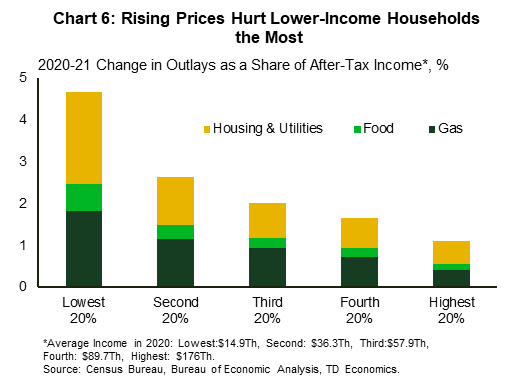
Importantly, unnoticed by aggregate measures, higher commodity prices put a disproportionate burden on lower income households. Although middle- and upper-income groups tend to spend a greater share of its consumption basket on fuel, high gas prices have a far greater impact on lower income households. Increasing cost of fuel and transportation will also have a spillover effect on prices of food, which take a much greater share of lower income families budgets (see report). For lowest income households, the higher cost of food and energy reduced their after-tax income by 2.5 percentage points in 2021 (Chart 6). This impact goes up to 4.7% when adding housing and utility prices: almost three times the average for all households. Even if fuel prices subside, as we expect, food prices may remain elevated due to the halt in exports from Ukraine and Russia – the world's largest grain exporters. If food and rent prices continue to gain momentum, protracted inflationary pressures may undo distributional gains achieved by progressive fiscal measures implemented during the pandemic.
No Relief For Car Shoppers In Sight
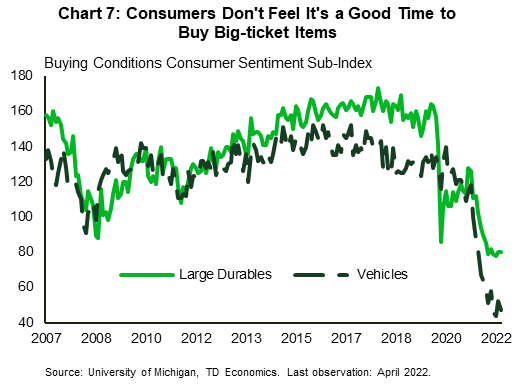
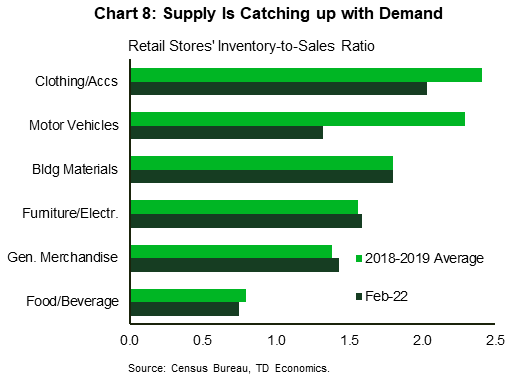
Faced with higher prices on fuel, food and shelter, consumers are likely to cut back on discretionary items. This may be especially the case for those categories that saw spending surge during earlier pandemic restriction periods. Indeed, consumers have already expressed their negative attitude towards spending on big-ticket items. According to the consumer sentiment survey, in the past six months, buying conditions for large durables and vehicles have been the worst in more than a decade (Chart 7). Lower demand for these goods would help restore supply chains and reduce inflationary pressures. Indeed, the inventory-to-sales ratio – a measure of adequacy of supply relative to current demand – for items like furniture, electronics and appliances and building materials are already above or close to their pre-pandemic levels (Chart 8). This points to normalization in supply-demand dynamics in durables spending, which accounted for a quarter of overall price growth since the start of the recovery.
The picture is less optimistic in the auto industry. Rock-bottom auto inventories generated by semiconductor shortages resulted in an estimated 5 million units of lost sales (see report). In early 2022, auto producers started to gain their footing, giving signs of hope for a rebound in production by the second half of 2022, but the Russia – Ukraine war brought another set-back. Both countries are major exporters of vital semiconductor materials, removal of which may amplify existing shortages and delay auto production recovery. As a result, we expect that it will take at least another year before auto production normalizes.
Tight supply led a large run-up in new and used vehicle prices, but that didn't do much to cool demand. Research focused on correlation between inflation and durables spending finds that spending on vehicles is the only category where higher inflation expectations may lead to an increase in demand.3 As supply continues to struggle, prices may continue to rise, creating more demand and further exacerbating price growth, at least in the short run. We hope that the recent uptick in new vehicles inventory proves to be a harbinger of a rising trend that will help steady prices in the second half of this year.
In the meantime, what could help steady demand in the coming months is higher interest rates on auto loans. The Federal Reserve started the process of raising rates with an initial rate increase of 25 basis points in March and is expected to raise its policy rate another 125 basis points this year. Despite this, our forecast for interest rates would still see rates on auto loans remain below its 2019 average in 2022 – a level that may prove to too low to cool demand this year.
Plenty of Upside for Services Spending
While the effect of rising prices on demand for goods remains uncertain, one area where high prices are less likely to play a role is spending on services, which take up a larger share in the budgets of middle- and higher- income households. In a recent paper, researchers from the Maastricht University studied how differences in financial situation, composition of assets and liabilities and expectations for future income growth affect a household’s allocation of consumption.4 They found that households with a substantial share of their wealth invested in real estate and financial assets are less sensitive to expected changes in price.
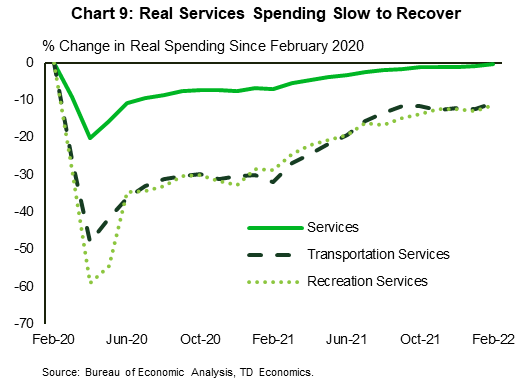
Indeed, for many Americans, activities that were restricted for the most of the past two years – traveling, going out for dinner, attending concerts – feel nondiscretionary. The desire to make up for lost time of the pandemic should mute consumers' sensitivity to rising prices in close-contact services. It seems that the only thing stopping Americans from splurging on services is the pandemic itself and the last traces of the "cave syndrome" – reluctancy to leave isolation. As of March, real spending on services recovered to its pre-pandemic level, but transportation and recreation are still missing more than 10% of their respective 2019 volumes (Chart 9).
The fruits of the pandemic-induced isolation are felt most in the recreation services, or more specifically – the performing arts. Stay-at-home orders, restrictions on public gatherings, and declines in arts-related giving have already resulted in persistent revenue gaps and employment losses, but a protracted period of social isolation may also generate a longer-lasting effect on the industry if the change in behavior proves to be more permanent. There is hope that, as we enter the endemic stage, spectators, seeking pre-pandemic normalcy start returning to live events.
Coincidentally, a revival of city centers should also help boost the transportation services sector, especially the public transport industry whose recovery has been delayed by a slow return to office. Even if post-pandemic office work is transformed into a hybrid format with fewer hours spent in-office, the likely further increase in commuting will increase public transport ridership, boosting revenues of transportation services. In addition, the rebound in travel transportation, up to now driven mainly by domestic leisure trips, should get an additional boost as fewer travel restrictions and entry requirements make international trips and business travel effortless again.
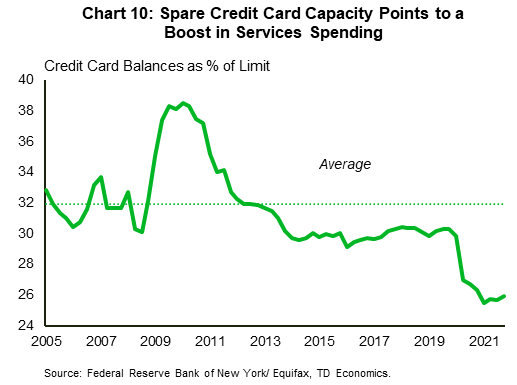
Importantly, rising interest rates are less likely to have a dampening impact on services spending, which are typically financed by credit cards that already carry high interest rates. Many households use credit cards for convenience and pay their bills in full every month, without increasing their debt obligations. Other consumers who carry outstanding balances are unlikely to respond to higher rates. Researchers find that most of these households pay high interest on credit card debts while also earning lower interest on deposits - a phenomenon known as "credit card puzzle". 5 This points to credit card debt's limited sensitivity to rising interest rates. On the other hand, credit utilization – the share of the total credit limit used at any given point in time – is extremely stable over time. This means that lower levels of credit utilization observed today may very well presage an increase in credit balances (and services spending) in the near-term.
Barring a major setback, we think that spending on services gains momentum in the second quarter before stabilizing at its pre-pandemic trend by the end of 2023. This should help offset the loss we are expecting from spending on durable goods, keeping real consumption growth just shy of 3% for the year.
Bottom Line
High inflation will no doubt have a dampening effect on growth as consumers become more wary of spending on items that carry a high price tag. Still, US consumers remain in a strong financial position and should be able to support above trend spending growth despite intensified inflation pressures. Indeed, a slower pace of spending is welcome as it would help moderate inflation pressures, especially in industries that are also facing supply constraints. Meanwhile, as consumers resume more activities put on hold during the pandemic, a re-acceleration in services consumption should help offset the decline in goods spending, supporting solid economic growth.
End Notes
- Batty, M., Deeken, E., Volz, A. H. Wealth Inequality and Covid-19: Evidence from the Distributional Financial Accounts. FEDS Notes No. 2021-08-30-2 https://www.federalreserve.gov/econres/notes/feds-notes/wealth-inequality-and-covid-19-evidence-from-the-distributional-financial-accounts-20210830.htm.
- The Michigan Consumer Sentiment Index and the Conference Board Consumer Confidence Index are the two consumer confidence indicators. The former has been relatively weak in recent months, while the latter has remained relatively strong. The Conference Board survey tends to be better at picking up on indicators related to the job market and job security, while the Michigan survey is a better measure of issues related to inflation, like the price of gasoline.
- Burke MA, Ozdagli A. Household inflation expectations and consumer spending: evidence from panel data. Working papers, Federal Reserve Bank of Boston (2013). https://www.bostonfed.org/publications/research-department-working-paper/2013/household-inflation-expectations-and-consumer-spending-evidence-from-panel-data.aspx
- Lieb, L., Schuffels, J. Inflation expectations and consumer spending: the role of household balance sheets. Empir Econ (2022) https://doi.org/10.1007/s00181-022-02222-8.
- Fulford, S.L., Schuh, S. “Consumer Revolving Credit and Debt over the Life Cycle and Business Cycle”, Federal Reserve Bank of Boston https://www.bostonfed.org/publications/research-department-working-paper/2015/consumer-revolving-credit-and-debt-over-the-life-cycle-and-business-cycle.aspx.
Disclaimer
This report is provided by TD Economics. It is for informational and educational purposes only as of the date of writing, and may not be appropriate for other purposes. The views and opinions expressed may change at any time based on market or other conditions and may not come to pass. This material is not intended to be relied upon as investment advice or recommendations, does not constitute a solicitation to buy or sell securities and should not be considered specific legal, investment or tax advice. The report does not provide material information about the business and affairs of TD Bank Group and the members of TD Economics are not spokespersons for TD Bank Group with respect to its business and affairs. The information contained in this report has been drawn from sources believed to be reliable, but is not guaranteed to be accurate or complete. This report contains economic analysis and views, including about future economic and financial markets performance. These are based on certain assumptions and other factors, and are subject to inherent risks and uncertainties. The actual outcome may be materially different. The Toronto-Dominion Bank and its affiliates and related entities that comprise the TD Bank Group are not liable for any errors or omissions in the information, analysis or views contained in this report, or for any loss or damage suffered.
Download
Share this: