TDE Leading Economic Index:
Navigating Uncharted Waters
Shernette McLeod, Economist | 416-415-0413
Date Published: July 24, 2023
- Category:
- US
- Real Estate
- Consumer
- Labor
- Business Investment
Highlights
- Some indicators have been pointing to a recession for a year now. Yet, the U.S. economy continues to defy expectations.
- TD’s Leading Economic Indicator is flashing a warning that we interpret as a period of slower growth, rather than increased risk of recession.
- The current economic cycle is characterized by atypical sectoral patterns due to the pandemic, now overlayed with the effects of rate hikes, which are clouding the usual economic signals.
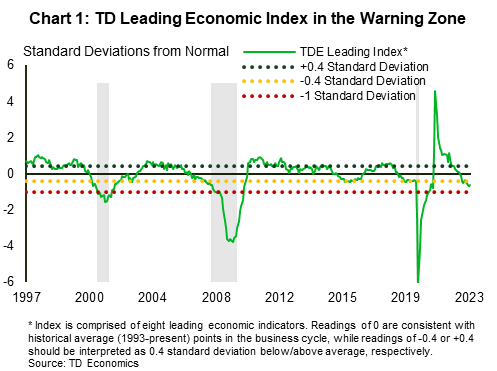
For almost a year, Bloomberg’s surveyed odds of recession over the next 12 months has been 50% or higher, and yet U.S. economic growth has defied expectations. Calls for recession got louder last summer when the U.S. Treasury yield curve inverted – an event that has preceded every recession in the U.S. in the last five decades. However, this signal can have long lags, and TD Economics calculates a Leading Economic Index (LEI) to get a timely sense of underlying economic momentum. Since March 2023, the index has dipped below a threshold that is typically associated with a significant slowdown in economic momentum, possibly resulting in a recession within the next one to two quarters (Chart 1). However, there are reasons to be cautious about the signals this time around.
The LEI is comprised of eight economic variables which help to detect changes in economic activity and can be a helpful gauge of future U.S. economic activity. The variables capture household and business spending, employment and housing activity, and consumer and business delinquencies and are laid out in Table 1. The index is calculated using a statistical technique called principal component analysis that determines co-movement shared between a set of economic indicators while stripping out inherent volatility. Most variables listed in Table 1 enter the index in year-on-year growth terms except for the ISM Manufacturing Index and the delinquency rate. A zero reading should be interpreted as a historical average point in the business cycle.
Based on historical estimation, readings below -1 have been consistent with recessions in the 1995-2018 period. The index has been flashing yellow since the fourth quarter of last year and remained there for the first two months of 2023 (Table 1). Yellow generally corresponds with an index reading that is within 0 to -0.4 standard deviation of its historical average. This range generally provides a warning signal and is historically consistent with potentially predicting a recession. The index has now moved into light red territory. This is consistent with readings lower than -0.6 but is still off the -1 that signifies a recession.
Table 1: TD Leading Indicator Heat Map
Table 1 is a heatmap showing how the TD Economics Leading Economic Index and its eight components have evolved over the period January 2022 to May 2023. The index was generally giving favorable signals up to September 2022. Since October 2022, however it has tipped into the yellow warning zone which generally signals a recession. These signals are largely coming from housing permits, ISM manufacturing, real core capital goods new orders and the delinquency rate.
| TDE Economic Index | Real Personal Consumption Expenditure (PCE) | Housing Permits | Industrial Production | ISM Manufacturing | Hours Worked | Unemployment Insurance Claims | Real Core Capital Goods New Orders | Delinquency Rates | |
| Jan 22 | 0.6 | 0.19 | -0.01 | 0.02 | 0.15 | 0.18 | 0.08 | 0.01 | 0.01 |
| Feb 22 | 1.1 | 0.27 | 0.03 | 0.23 | 0.17 | 0.33 | 0.08 | -0.01 | 0.01 |
| Mar 22 | 0.5 | -0.03 | 0.05 | 0.13 | 0.13 | 0.22 | 0.08 | -0.03 | 0.00 |
| Apr 22 | 0.4 | -0.03 | 0.02 | 0.14 | 0.09 | 0.23 | 0.07 | -0.09 | -0.01 |
| May 22 | 0.4 | -0.01 | -0.01 | 0.09 | 0.10 | 0.21 | 0.06 | -0.04 | -0.02 |
| Jun 22 | 0.2 | -0.04 | 0.01 | 0.07 | 0.01 | 0.22 | 0.06 | -0.06 | -0.01 |
| Jul 22 | 0.2 | -0.04 | 0.00 | 0.06 | 0.00 | 0.17 | 0.05 | -0.06 | -0.01 |
| Aug 22 | 0.1 | -0.03 | -0.13 | 0.07 | 0.00 | 0.18 | 0.05 | -0.06 | 0.00 |
| Sep 22 | 0.1 | -0.05 | -0.04 | 0.13 | -0.06 | 0.14 | 0.05 | -0.09 | 0.00 |
| Oct 22 | -0.1 | -0.07 | -0.10 | 0.07 | -0.09 | 0.14 | 0.04 | -0.10 | -0.01 |
| Nov 22 | -0.4 | -0.10 | -0.18 | 0.01 | -0.12 | 0.09 | 0.02 | -0.12 | -0.01 |
| Dec 22 | -0.5 | -0.06 | -0.23 | -0.05 | -0.14 | 0.07 | 0.02 | -0.14 | -0.02 |
| Jan 23 | -0.4 | -0.01 | -0.24 | -0.01 | -0.17 | 0.15 | 0.03 | -0.09 | -0.02 |
| Feb 23 | -0.4 | -0.02 | -0.16 | -0.04 | -0.16 | 0.04 | 0.01 | -0.09 | -0.03 |
| Mar 23 | -0.6 | -0.05 | -0.20 | -0.07 | -0.20 | 0.05 | 0.00 | -0.12 | -0.03 |
| Apr 23 | -0.7 | -0.04 | -0.18 | -0.06 | -0.18 | 0.02 | 0.00 | -0.09 | -0.15 |
| May 23 | -0.7 | -0.05 | -0.12 | -0.08 | -0.18 | 0.02 | 0.00 | -0.08 | -0.18 |
Color Scheme for Heat Map Is Based on Number of Standard Deviations From the Mean
| Less than or equal to -1.00 |
| Less than or equal to -0.80 |
| Less than or equal to -0.60 |
| Less than or equal to -0.40 |
| Less than or equal to -0.20 |
| Less than or equal to 0 |
| Greater than 0 |
| Greater than or equal to 0.20 |
| Greater than or equal to 0.40 |
When Navigating Uncharted Waters, Perspective Matters
So far, the weakness in the index is largely emanating from the housing and production sectors of the economy. Manufacturing has been showing signs of softness, with the ISM Manufacturing Index in the red since October of last year. As of May, the ISM Manufacturing Index has been below the 50 threshold, indicating contraction, for seven consecutive months. Additionally, industrial production (IP), which incorporates real output in manufacturing, mining, and utilities, has moved from green to amber at the close of 2022 signifying deteriorating conditions. Within the index, the manufacturing component has been declining on a year-on-year basis for the last three months. This is not surprising as goods consumption surged during the pandemic, and a global slowdown in manufacturing has occurred as goods demand normalizes. The weak performance of core capital goods new orders, which often acts as a barometer for business spending plans, is consistent with this softness in manufacturing.
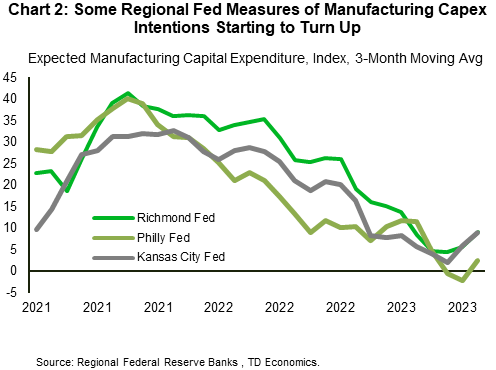
However, there are other factors which suggest that the manufacturing sector may be able to weather the current sectoral slowdown without pulling overall economic growth into negative territory. To start, capital expenditure intentions which tend to closely track with the ISM manufacturing index seem to be turning a corner and are starting to pick-up (Chart 2). Similar signals are also coming from the small business sector, with the number of NFIB survey respondents planning future capital expenditure up a notable six points from the recent April 2023 trough.
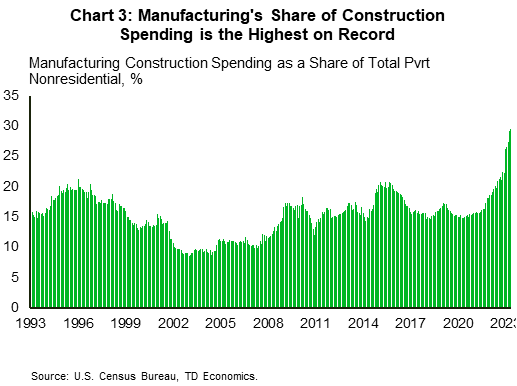
Additionally, despite the current slowing in manufacturing output, manufacturing construction has skyrocketed (Chart 3). Outlays on computer, electronic, and electrical manufacturing plants have been the primary drivers behind this surge in manufacturing construction. The strong investment in this area has been driven by the CHIPS Act and the Inflation Reduction Act, as according to the White House1, companies have pledged to spend over $360bn in new semiconductor and battery investments, and almost $500bn across the sectors that would benefit most from the Acts (see TD Economics report). Combined, these factors are positive developments for the U.S. manufacturing outlook. This should help to offset some of the current headwinds facing the industry.
Housing is always one of the first areas of the economy to respond to higher interest rates. Since peaking in December 2021, building permits for new homes have generally been trending down, and are a key area currently in the red on the heatmap in Table 1. However, we don’t expect this indicator to remain in the red for much longer. We expect permitting activity to turn up later this year, once it becomes clearer the Fed is done hiking interest rates. Also, existing home listings remain low, with homebuyers increasingly turning to the new home market. This has raised homebuilder confidence in recent months, supporting an upturn in new home construction in the coming quarters.
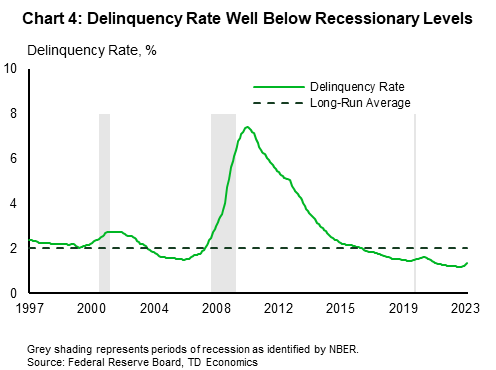
Delinquency rates have also recently gone up, moving from 1.2% in March to 1.3% in April and May. The result is that while the indicator has been in the warning zone since April 2022, it has since moved to red for the last two months. This again is reflecting the impact of rising interest rates in areas such as commercial real estate and auto loans, where the value of underlying assets may now be lower than outstanding balances, causing loan holders to cut losses and walk away. However, delinquency rates were depressed during the pandemic thanks to generous fiscal supports, and the recent uptick represents more of a normalization towards the long-run average of 2%, rather than suggestive of a recession (Chart 4).
Areas of Strength
Meanwhile, some areas of the economy have displayed noteworthy resilience. Most notable is the labor market, with an historically low unemployment rate. This has kept initial claims for unemployment benefits and hours worked in the green.
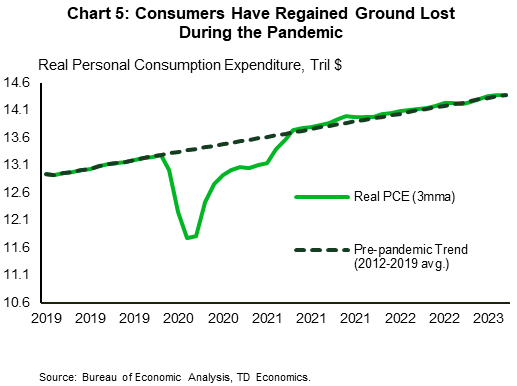
The strong labor market and sizeable excess savings nest egg built up in the pandemic have kept personal consumption expenditure humming along. While the indicator shifted into the yellow zone as of March 2022, this movement too should be interpreted with caution given the surge in consumer spending in 2021 as a result of significant fiscal stimulus during the pandemic. This resulted in significant base effects in the year-on-year measure in 2022. Real consumer spending is currently growing at a pace slightly below its long-run average, which is consistent with higher interest rates and a slowing economy. The level of real consumer spending has regained its pre-pandemic trend and there are few signs it will weaken significantly anytime soon (Chart 5).
This is not to say that consumers do not face elevated risks. They do. Namely from inflation and the looming resumption of student loan repayments in October. However, consumers have so far been able to navigate the headwinds without succumbing to the pressure. Recent data on retail spending suggests they may be able to continue doing so (see here).
The Silver Lining
We have gotten warning signals before from the LEI in the past where the economy has not tipped into recession and managed to emerge unscathed. Between April 2015 and November 2016 for example, industrial production, ISM manufacturing and core capital goods new orders were in the danger zone, but economic activity picked up and a recession was avoided. Whether or not, that will be the case this time, time will tell. But it shows that downturns in the production side of the economy, as we are experiencing now, don’t always lead to recessions.
Bottom Line
There are indicators currently giving a recessionary warning, but the LEI’s warning signal must be taken with a grain of salt. It is consistent with our forecast for very slow growth in the U.S. economy in the coming quarters (see forecast). We agree that the risk of recession is elevated, given it would only take a modest sized negative shock to tip the economy into recession. However, we think it is premature to forecast a recession based on this signal given that some areas of the index, like housing and parts of the manufacturing sector, are likely to pick up in the coming quarters. While other shifts like delinquency rates are normalizing from pandemic lows. Meanwhile, labor market indicators are a long way from recessionary conditions.
The fact that the leading index is currently suggesting that a slowdown is on the way is what the Federal Reserve is seeking to engineer. The central bank needs to slow economic activity enough, to bring inflation to heel. The question is whether they will be able to apply the brakes just right, to slow inflation to the 2% target, without sending economic growth into the red. It is a close call, but the unusual nature of the current cycle could make a “soft landing” more likely.
End Notes
Disclaimer
This report is provided by TD Economics. It is for informational and educational purposes only as of the date of writing, and may not be appropriate for other purposes. The views and opinions expressed may change at any time based on market or other conditions and may not come to pass. This material is not intended to be relied upon as investment advice or recommendations, does not constitute a solicitation to buy or sell securities and should not be considered specific legal, investment or tax advice. The report does not provide material information about the business and affairs of TD Bank Group and the members of TD Economics are not spokespersons for TD Bank Group with respect to its business and affairs. The information contained in this report has been drawn from sources believed to be reliable, but is not guaranteed to be accurate or complete. This report contains economic analysis and views, including about future economic and financial markets performance. These are based on certain assumptions and other factors, and are subject to inherent risks and uncertainties. The actual outcome may be materially different. The Toronto-Dominion Bank and its affiliates and related entities that comprise the TD Bank Group are not liable for any errors or omissions in the information, analysis or views contained in this report, or for any loss or damage suffered.
Download
Share: