Highlights
- As businesses get hit with a combination of higher costs, declining profits, higher interest rates, and tighter credit conditions, private nonresidential business investment is expected to slow.
- The short-term cyclical uncertainty doesn’t negate several structural forces remain supportive of capital spending. Among them are increased reshoring activities, the transition to cleaner energy sources, opportunities for public-private partnership in infrastructure investment.
- These structural shifts could lend support to business investment over the medium-term and present an upside risk to our forecast.
It is a truth universally acknowledged that a significant slow-down in economic activity is coming in 2023. As private enterprises get hit with a combination of higher costs, declining profits, and higher interest rates, and tighter credit conditions business investment growth should be minimal at best. Frankly, in the ordinary course of the unfolding slow-down, the Fed’s aggressive tightening would be more than enough to induce a decline in business spending. But, as we have learned, there is nothing ordinary about today’s economy, and several factors may play a role in firms’ decisions to continue spending at a solid pace.
Cyclical Headwinds
Nonresidential private business investment measures what companies spend on fixed assets that are used in the process of production. Despite its relatively humble 15% share of GDP (v. 70% for consumption), business investment contributes to long-term economic growth by increasing the productive capacity of the economy, which can improve productivity, and hence, living standards. Business investment is strongly influenced by the business cycle, with a recession reducing investment spending and an economic expansion leading to increased investment to meet stronger demand. For example, in the wake of the global financial crisis, business investment plummeted by 17.6% from its peak – a decline it took 14 quarters to recover from. In contrast, the pandemic-related peak-to-trough decline was milder at 10.3% and the recovery took only five quarters.
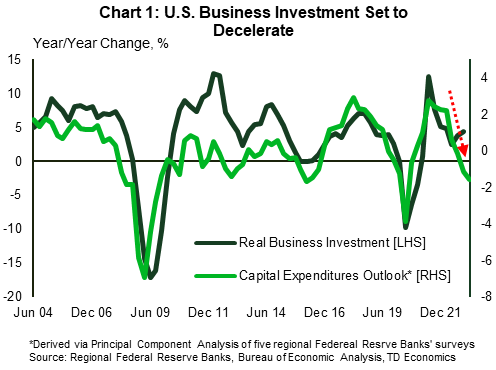
At the end of 2022, capital spending intentions across the regional Fed surveys point to near zero or even negative year-over-year growth in real non-residential investment in the fourth quarter (Chart 1). Instead, investment has held up surprisingly well, finishing 2022 with 4.3% year-on-year growth. This suggests that sentiment indicators might be giving us a false signal, at least for now. The effects of higher interest rates are only starting to be felt by business borrowers, while the recent crisis of confidence in small- and medium-sized banks, could create additional challenges by limiting credit availability for new business spending. That’s why strong business investment growth of last two years is unlikely to be sustained. Still, we expect a mild downturn rather than a collapse, as we don’t expect a full-blown recession. The anticipated two quarters of contraction in nonresidential business investment of the second half of 2023 should still result in tepid 0.6% growth on a Q4-over-Q4 basis (see our Quarterly Economic Forecast). In this paper, we get into some details of underlying structural dynamics that should help support investment in certain areas.
Intangibles Grow, but Investment Gap Remains
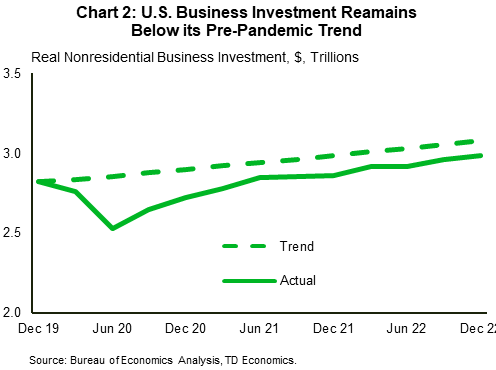
At the fore is an argument of a pandemic-related investment gap. Despite the post-crisis rebound, investment spending hasn’t recovered relative to its pre-pandemic trend (Chart 2). According to our estimates, there remains about a $415 billion, or about 3%, gap in real nonresidential business investment relative to pre-pandemic trends.
This loss partially speaks to the reallocation of investment among categories. Three quarters of the total gap in investment is accounted for by structures. Structures investment has fallen $300 billion short of its pre-pandemic trend – three quarters of the total gap in investment estimated (Chart 3).
Given the nature of the pandemic economic shock, it’s not surprising that companies had less need to for buildings and instead prioritized spending on new equipment to build a new remote work and e-commerce infrastructure. Also, past research has shown that structures investment is affected the most by economic uncertainty, which was elevated due to the unprecedented situation of a pandemic. But even in equipment spending there is a divergence in categories: as spending on information processing equipment increased, transportation equipment fell behind. As a result, despite a healthy bounce back, business spending on equipment remains below its pre-pandemic trend. We estimate the gap to be roughly $35 billion as of Q4 2022 (Chart 3).

Complementing investment in computing power, spending on software surged, growing at an average annual rate of 12%. This type of investment had already been growing at a fast rate of 9% prior to the pandemic, but remote work was a catalyst to front-load purchases in the early days of the pandemic. Meanwhile, there was no impact on investment in research and development (R&D), which continued to grow at an average annual rate of 5.5% (the same rate as before the pandemic). As a result, investment in intellectual property products (IPP) is the only category that has risen above the pre-pandemic trend (Chart 3).
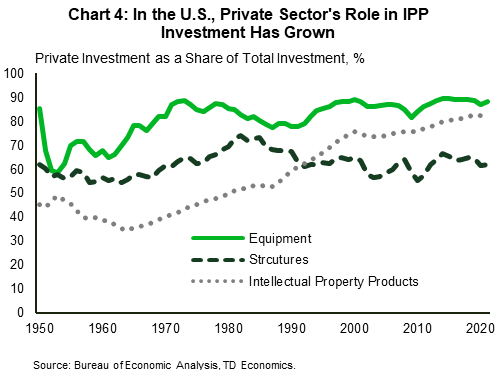
The relative outperformance of IPP investment is not new and reflects a broader shift in the economy where production processes for many sectors became more digital and less reliant on the use of capital structures and equipment. In the five years preceding the pandemic, IPP investment’s average annual growth was 6.7% vs. 1.1% and 2.4% of investment in structures and equipment, respectively. Importantly, this outperformance ensued without a significant boost from federal funding or tax incentives. Since the 1980s, the share of U.S. private sector IPP investment surpassed that of the federal government and the gap continues to widen (Chart 4). In contrast, the government contribution to investment in structures remained relatively stable over time, highlighting its importance in fostering infrastructure investment (i.e., more “traditional” capital such as highways, bridges, water lines, sewage pipelines, power plants etc.) As we discuss below, greater public infrastructure investment may provide a significant boost to productivity and promote private investment in structures.
Structural Catalysts for Investment
Looking over the medium term, there are structural forces that are supportive of capital spending, despite the short-term cyclical uncertainty and weak business sentiment. For instance, continued supply chain disruptions are accelerating investments in reshoring production to the U.S. Similarly, firms that are trying to remain competitive, need to promote investment in radical innovation in transportation, energy sources, new consumer goods and production technologies. Finally, recent legislative initiatives, such as the CHIPS and Science Act, the Inflation Reduction Act (IRA), and the Infrastructure Investment and Jobs Act (IIJA), should support growth private spending.
Reshoring
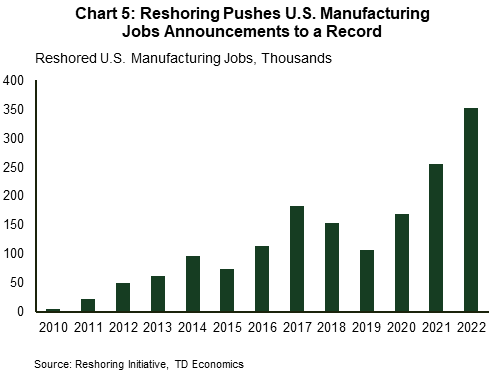
The pandemic exposed the benefits of local production and incited companies to ramp up reshoring efforts, increase domestic spending and solicit foreign direct investment. By bringing production back to the U.S., businesses can reduce delays and the additional costs associated with overseas shipping and help to increase their resilience. According to the Reshoring Initiative’s forecast, in 2022 the private and federal push for domestic supply of essential goods will result in a record 350k jobs announcements, up from 265k in 2021 (Chart 5).
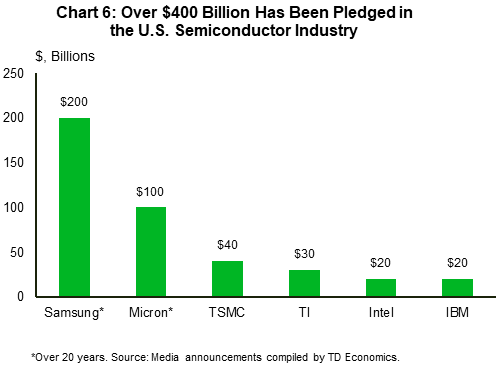
A large share of these estimates comes from reshoring activities in the semiconductor industry propelled by the $280 billion spending outlined in the CHIPS and Science Act, passed last August. Under this act, roughly $50 billion will be allocated to increasing domestic manufacturing through R&D and production over the next five years. An additional $24 billion will be spent on the manufacturing tax credit for investments in semiconductor manufacturing and processing equipment. The rest of it is allocated to various government agencies to jump-start R&D and commercialization of new technologies (i.e. quantum computing and artificial intelligence), creation of regional high-tech hubs and an expansion of the STEM (Science, Technology, Engineering, and Mathematics) workforce.
While the full effect of increased government spending on business investment will take time to transpire, the first private sector spending announcements weren’t long in coming. In the summer of 2022, Samsung announced a proposal to invest $200 billion to build 11 new chip manufacturing plants in the U.S. over the next 20 years. The announcement doesn’t have specific construction plans yet and was motivated by the expiration of tax incentives in the state of Texas, where the proposal was submitted. A more concrete plan for long-term investment was submitted in October by Micron when it announced an up to $100 billion investment over the next 20-plus years in the U.S. largest semiconductor fabrication facility in Clay, New York. The first phase investment of $20 billion is planned by the end of this decade.1 The investment is expected to create up to 50,000 new jobs. According to our estimates, more than $400 billion in investment over the period of 20 years has been pledged so far (Chart 6).
Clean Energy Transition

Another potential driver of business investment is the transition to cleaner energy sources. Governments have increasingly brought in incentives, such as tax credits and subsidies to encourage businesses to transition to clean energy. Most notably, the Inflation Reduction Act (IRA), signed into a law shortly after the CHIPS and Science Act, contains $500 billion in new spending and tax breaks allocated to green initiatives. The IRA is in part designed to stimulate investments in domestic manufacturing, promote the acquisition of essential materials domestically or from countries with free trade agreements, and initiate the R&D of new cutting-edge technology, such as carbon capture and storage, and clean hydrogen.
Most visibly, the U.S. battery production is expected skyrocket, as the IRA established a tie between an electric vehicle’s eligibility for tax credits and the domestic content of its battery pack. To qualify for a consumer tax credit, an increasing portion of the battery must be made in the U.S. each year. As a result, several car and battery manufacturers already announced plans to build new battery plants with an estimated $14 billion worth of investment so far (Chart 7).
In addition, the IRA is expected to stimulate clean energy investment. According to recent report by the lobby group American Clean Power, over $40 billion in domestic clean energy investments have been made in three months after the Act was signed.2
Increased Focus on Infrastructure
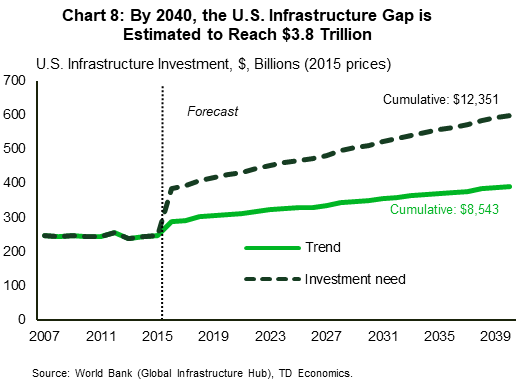
Another source of stimulus comes from the 2021 Infrastructure Investment and Jobs Act (IIJA), which provides $550 billion of new federal spending to be allocated over five years. Some of its incentives center around the net zero transition overlapping with incentives described above (for example, the IRA includes financing and grants to assist in building transmission facilities and a smart grid investment program, included in the IIJA). Others are solely focused on infrastructure improvements. According to the World Bank Global Infrastructure Hub the United States’ infrastructure investment needs to be $12.4 trillion between 2016 and 2040.3 That’s compared to the estimated current pace of around $8.5 trillion, implying a cumulative investment gap of about $3.8 trillion (Chart 8). These estimates include basic infrastructure sectors (i.e. energy, transport, and water structures), as well as digital infrastructure (i.e. telecommunication assets), but exclude social infrastructure (i.e. hospitals, schools, fire stations etc.).4
As previously mentioned, public investment plays the most prominent role in structures investment in general and, in particular, infrastructure investment. But increased public investment doesn’t necessarily lead to crowding out of private spending. Research suggests that public capital raises the marginal products of private inputs, which leads to incentives to accumulate more private capital.5 More recent studies confirm that public investments can accelerate technological innovation through investments in research and development, encouraging productivity and long-term economic growth.6 Importantly, infrastructure spending is estimated to have one of the highest fiscal multipliers. The Congressional Budget Office (CBO) estimates an additional dollar of public infrastructure spending results in an increase in output ranging between 50 and 220 cents.7
All said, even though the IIJA won’t fill the gap estimated by the World Bank, it may create opportunities for public-private partnership, potentially opening the door for greater private investment in certain infrastructure sectors in the future. Specifically, the law provides investment tax credits for companies that invest in qualified infrastructure projects (such as roads and bridges) and supports investment through loan guarantees and other financing options.
Other Structural Factors
Other factors could lend support to business investment over the medium-term. First, changes in the geopolitical order fueled an increase defense spending, which is on track to reach its highest level since the peaks during the Iraq and Afghanistan wars. This spending will benefit private military contractors. Relatedly, geopolitical instability highlighted the importance of cyber-risk management, underlining the criticality of increased private spending on cybersecurity, which, according to McKinsey, is expected to grow by more than 12% annually.8
In addition, the U.S.’s ageing population may help boost capital spending, although we must be more careful in assessing its effects on the economy. On the one hand, population ageing, and slower labor force growth argues for slower economic growth and less investment in the long term. On the other hand, an ageing population may increase demand for certain products and services, leading to increased investment in production and operations in the medium term. Furthermore, it can reinforce the need of technological progress, supporting more spending on research and development and increased automation.
Bottom line
Sentiment indicators are pointing to a slow-down in business investment. Our forecast calls for very modest 0.6% Q4/Q4 growth in 2023, followed by an uptick to 2% in 2024. But despite the cyclical headwinds, a number of structural forces are supportive of capital spending in the medium-term. Companies’ reshoring efforts, the transition to cleaner energy, and increased spending on infrastructure are expected to increase domestic manufacturing and spur private investment in other areas. The full effect of these tailwinds on business investment will take time to transpire and is not fully incorporated in our estimates, and as such present a welcome upside risk to our forecast.
End Notes
- https://investors.micron.com/news-releases/news-release-details/micron-announces-historic-investment-100-billion-build-megafab
- https://cleanpower.org/blog/clean-energy-companies-are-investing-in-america/
- Estimates for infrastructure investment needs and gaps for all G20 countries can be found here: https://outlook.gihub.org/
- As categorized by Bennett (2020). See: https://www.bea.gov/system/files/papers/BEA-WP2020-12.pdf
- Pereira, Alfredo M. and Rafael Flores De Frutos, 1999. “Public Capital Accumulation and Private Sector Performance. https://www.sciencedirect.com/science/article/abs/pii/S0094119098921246
- Ramey, Valerie A., 2016. “The Macroeconomic Consequences of Infrastructure Investment.” https://www.nber.org/system/files/working_papers/w27625/w27625.pdf
- https://www.crfb.org/sites/default/files/managed/media-documents2022-02/CRFB%20Comparing%20Fiscal%20Multipliers.pdf
- https://www.mckinsey.com/capabilities/risk-and-resilience/our-insights/cybersecurity/new-survey-reveals-2-trillion-dollar-market-opportunity-for-cybersecurity-technology-and-service-providers.
Disclaimer
This report is provided by TD Economics. It is for informational and educational purposes only as of the date of writing, and may not be appropriate for other purposes. The views and opinions expressed may change at any time based on market or other conditions and may not come to pass. This material is not intended to be relied upon as investment advice or recommendations, does not constitute a solicitation to buy or sell securities and should not be considered specific legal, investment or tax advice. The report does not provide material information about the business and affairs of TD Bank Group and the members of TD Economics are not spokespersons for TD Bank Group with respect to its business and affairs. The information contained in this report has been drawn from sources believed to be reliable, but is not guaranteed to be accurate or complete. This report contains economic analysis and views, including about future economic and financial markets performance. These are based on certain assumptions and other factors, and are subject to inherent risks and uncertainties. The actual outcome may be materially different. The Toronto-Dominion Bank and its affiliates and related entities that comprise the TD Bank Group are not liable for any errors or omissions in the information, analysis or views contained in this report, or for any loss or damage suffered.
Download
Share: