Heat Check: Comparing Canada and
US Housing Markets
Sri Thanabalasingam, Senior Economist | 416-413-3117
Date Published: May 13, 2021
- Category:
- U.S.
- Real Estate
Highlights
- Housing markets in Canada and the US are on a tear. Home price and sales metrics show that while the US market is hot, Canada’s is hotter.
- At a high level, there are a number of commonalities driving housing activity in both countries. But there are factors unique to Canada that are fueling the country’s outperformance such as stronger population growth, less scarring from the ‘08 housing crash, and greater fears of missing out.
- Looking ahead, Canadian housing dynamics could follow the US given that America is further ahead in the vaccine rollout and reopening of the economy. Still, Canada may see continued outperformance given that its market may be more fertile ground for FOMO (or “fear of missing out”) and increased speculation. A larger deterioration in affordability before and during the pandemic poses a greater downside risk over the medium term.
Housing markets in Canada and the US are sizzling. Recent headlines have used superlatives to describe housing market conditions in both countries and the data do back this up. Still, a closer look reveals some interesting distinctions as well.
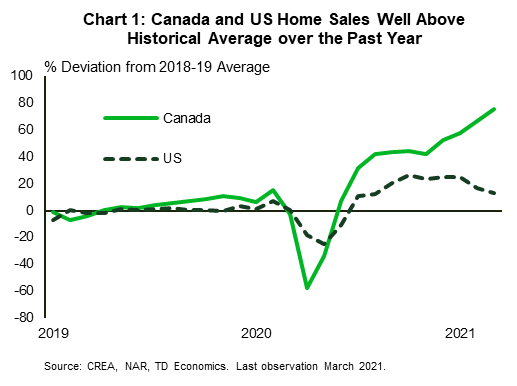
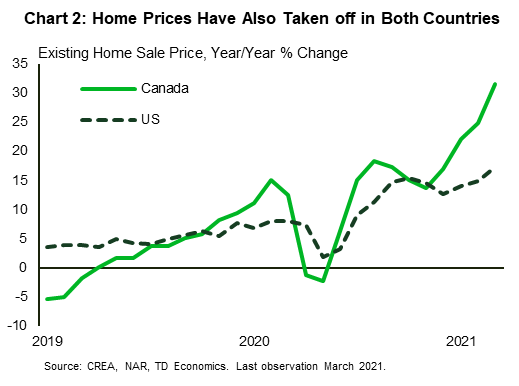
Home price and sales metrics show that while the US market is hot, Canada’s is hotter. For example, existing home sales, which make up the majority of overall sales in both countries, is well above historical averages, but Canadian home sales have outperformed (Chart 1). As of March 2021, home sales in Canada were 75% higher than the average over 2018 and 2019, while it was 13% above in the US1. Likewise, home prices also spiked. In Canada, the average home sold was 32% more expensive than what it was a year ago, and it was 17% higher stateside (Chart 2).
Similar Housing Demand Conditions in Canada and US
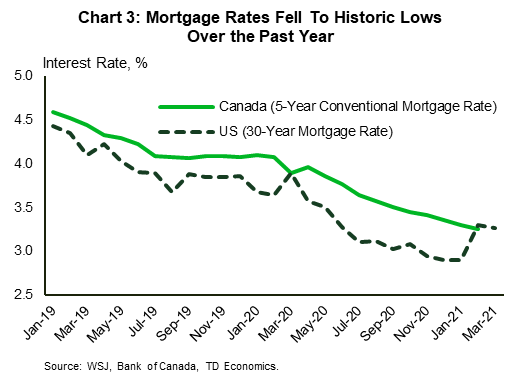
From a high level, the list of commonalties across markets during the pandemic is longer than the areas of difference, particularly on the demand side. Perhaps the most influential demand-side driver has been historically low mortgage rates. Responding to the impacts of the pandemic, the Bank of Canada and the Federal Reserve slashed rates and enacted large quantitative easing programs early last year, resulting in a sharp drop in borrowing costs (Chart 3). Given that the US conventional mortgage rate is a 30-year rate compared to Canada’s 5-year benchmark, borrowing costs fell faster in America as flight to safety flows lowered longer term yields at the onset of the pandemic2.
Lower borrowing costs meant more affordable homes, especially for individuals higher up the income spectrum whose employment was relatively less impacted by the pandemic. Indeed, with work from home policies in place, and city life coming to a stand-still, many households moved from smaller homes in urban cores to larger ones in the suburbs. This “race for space” phenomenon boosted housing markets in Canada and the US in 2020.
Another demand-side commonality relates to demographics. Cheap borrowing conditions also appear to have unleashed pent-up homeownership demand among the respective large cohort of millennials on both sides of the 49th parallel. In the US, the homeownership rate among 25 to 34 year-olds was around 40% in early 2020, 7 percentage points lower than the average in the early 2000s. Similarly, in Canada, according to a recent Royal LePage survey3, the homeownership rate for a comparable age cohort was just under 40% prior to March 2020, which was about 9 percentage points lower than the historical average. The sudden drop in mortgage rates helped more individuals in this cohort become homeowners for the first time. Indeed, the same Royal LePage survey reported that of the millennials who had said they were homeowners, 25% purchased their homes since March 15, 2020.
Excess savings was another factor that fueled housing activity in both countries. Households accumulated an extraordinary amount of savings through the pandemic period either for precautionary reasons or because they were limited in spending options. In Canada, this totaled around $200 billion last year, while in the US it was about $1.6 trillion. These funds helped some households dip into the real estate market this past year.
Canadian Housing Activity Sprinting Ahead of The US
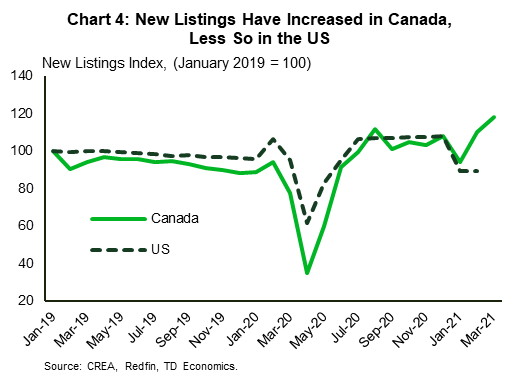
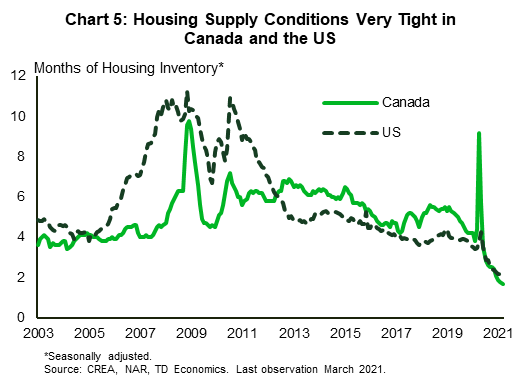
But the pickup in housing activity in Canada has been far stronger than that in the US. As shown in Charts 1 and 2, sales and prices have sprinted ahead, and the gap is widening. One reason for Canada’s advantage on the sales front is that there has been a greater supply response as Canadians have been more enthusiastic in listing their homes relative to Americans (Chart 4)4. This has not satiated homeownership demand, however. Housing inventories are at historical lows (Chart 5) and prices are rising faster. This suggests that factors other than low inventories are also at play in driving up Canadian home valuations.
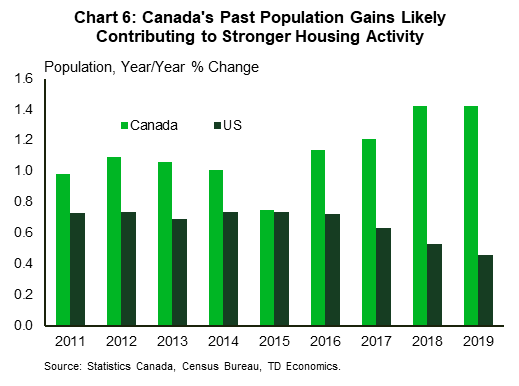
A compelling explanation for the outperformance in Canadian housing activity – both pre- and post-pandemic – surrounds stronger population gains. Over the past decade, Canada’s population has grown faster than the US’ with an acceleration occurring from 2016 to 2019 (Chart 6). While an important driver of the recent increase was non-permanent residents, specifically international students (see report), it supports future homeownership demand as many of these people choose to make Canada their permanent home. Indeed, since the pandemic struck, the government turned its attention to granting permanent residency to those already in Canada. The Canada Experience Class program, which provides a pathway for temporary workers or international students to permanently settle in Canada, barely skipped a beat, admitting 25,000 people last year, broadly in line with the 2016 to 2019 average.
Another differentiating aspect of the Canadian housing market is that there is less scarring from the 2008 housing crash in Canada compared to the US. Average home prices declined by an extraordinary 12% during the downturn in the US, but for Canada, the peak decline was only 0.5%. There’s no denying that housing has been a great bet for the last 20 years in Canada (see report). This is probably why Canadians have been hit with the fear of missing out, or FOMO, bug a lot harder than Americans.
FOMO has resulted in prospective homebuyers, who may have preferred to buy in later years, pulling forward their housing purchase decisions either because of low mortgage rates, or to get ahead of future price increases, adding to the housing frenzy. This appears to have been more of a driver in Canada.
The fear of missing out not only lends itself to prospective home buyers pulling forward homeownership plans, but it can also stoke increased speculative activity. Sharp sustained increases in home prices can draw in potential real estate investors aiming to reap the benefits of these gains. While much of the activity in 2020 appears to be from home buyers looking to live in the home, recently, there are signs that speculators are contributing to price growth. The Bank of Canada has chimed in stating that there are indications of excess exuberance in the Canadian housing market. This could perhaps partly explain why home prices in Canada have grown at roughly double the US rate over the past few months5.
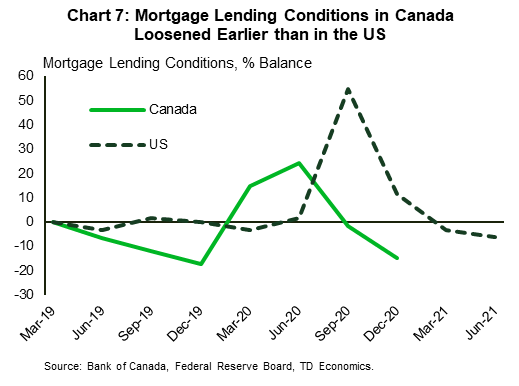
Lastly, looser mortgage financing conditions may have contributed to stronger housing activity in Canada (Chart 7)6. According to senior loan officer survey data, mortgage lending conditions in the US were tightened to a greater degree relative to Canada last year. In recent quarters, financing conditions have been loosened significantly stateside so that there has been convergence. Still, easier access to mortgage financing through much of 2020 could have played a part in Canada’s housing market outperformance.
Monitoring US Housing Will Be Helpful for Assessing Canadian Prospects
Looking ahead, Canadian housing dynamics could follow the US given that America is further ahead in the vaccine rollout and reopening of the economy. Almost 60% of adults have received at least one dose in the US — it’s around 50% in Canada — prompting an easing of restrictions across many states. As a result, pandemic-induced trends such as the race for space could phase out as people return to urban cores.
According to mobility data, this may already be occurring in US cities. Unacast, a cellphone tracking company, said in a recent report that large cities in New York were gaining residents through the first two months of 2021. This would have important implications for housing activity as more people may opt to rent instead of purchasing a home. As noted in our recent report, rental demand is gradually normalizing in urban cores. At the same time, however, continued low borrowing costs and a strong economic recovery could support home sales and prices.
It’s not immediately clear how US housing activity will evolve over the remainder of 2021 but a shift in trends stateside could foreshadow developments north of the border. That said, there are factors unique to Canada. If FOMO persists or if speculators become more important players, Canadian housing activity could continue outpace the US in the near term. But this would further worsen affordability issues in Canada, implying a greater downside risk over the medium term, especially if policymakers seek to implement measures to cool housing demand. A strong recovery in immigration in 2022 and beyond, could soften the blow. Much is uncertain. But for now, housing markets are continuing to sizzle in Canada and the US.
End Notes
- The 2018-19 period was chosen as the historical comparison as existing home sales were relatively stable during this period across both countries and also provides a recent comparison.
- It’s worthwhile noting that in recent months, the gap between US and Canadian mortgage rates has closed owing in part to stronger growth expectations pushing up longer-term yields.
- See https://marketing.rlpnetwork.com/Communications/Royal_LePage_2021_Demographic_Survey_table.pdf
- US data run up to February, and the recent drop could be due to weather impacts. Going forward, we could see an increase in listings, but this would likely do little to bridge the gap with Canadian home sales.
- We cannot pin down the extent of speculative activity in Canada and the U.S. due to data limitations.
- The US lending conditions series used in Chart 7 is whether credit standards on Government-Sponsored Enterprise eligible residential mortgages has tightened in the last three months.
Disclaimer
This report is provided by TD Economics. It is for informational and educational purposes only as of the date of writing, and may not be appropriate for other purposes. The views and opinions expressed may change at any time based on market or other conditions and may not come to pass. This material is not intended to be relied upon as investment advice or recommendations, does not constitute a solicitation to buy or sell securities and should not be considered specific legal, investment or tax advice. The report does not provide material information about the business and affairs of TD Bank Group and the members of TD Economics are not spokespersons for TD Bank Group with respect to its business and affairs. The information contained in this report has been drawn from sources believed to be reliable, but is not guaranteed to be accurate or complete. This report contains economic analysis and views, including about future economic and financial markets performance. These are based on certain assumptions and other factors, and are subject to inherent risks and uncertainties. The actual outcome may be materially different. The Toronto-Dominion Bank and its affiliates and related entities that comprise the TD Bank Group are not liable for any errors or omissions in the information, analysis or views contained in this report, or for any loss or damage suffered.
Download
Share: