U.S. Multifamily CRE: Still Soft Fundamentals and an Uneven East Coast
Admir Kolaj, Economist | 416-944-6318
Date Published: May 14, 2026
- Category:
- U.S.
- Real Estate
Highlights
- A broad-based recovery in multifamily CRE remains elusive: vacancies remain elevated, and rent growth is flat as the market gradually absorbs the post-pandemic supply push.
- Concessions in newly delivered buildings are encouraging trade-ups into newer, higher-quality spaces – pressuring occupancy in older, stabilized stock.
- Multifamily vacancies are likely to drift a bit higher, before rolling over later in 2027 as the remaining supply pipeline clears.
- East Coast conditions remain uneven: large Northeast metros are generally more stable, while Southeast metros – where population growth has cooled for a change – remain on weaker footing and are still absorbing elevated pipelines.
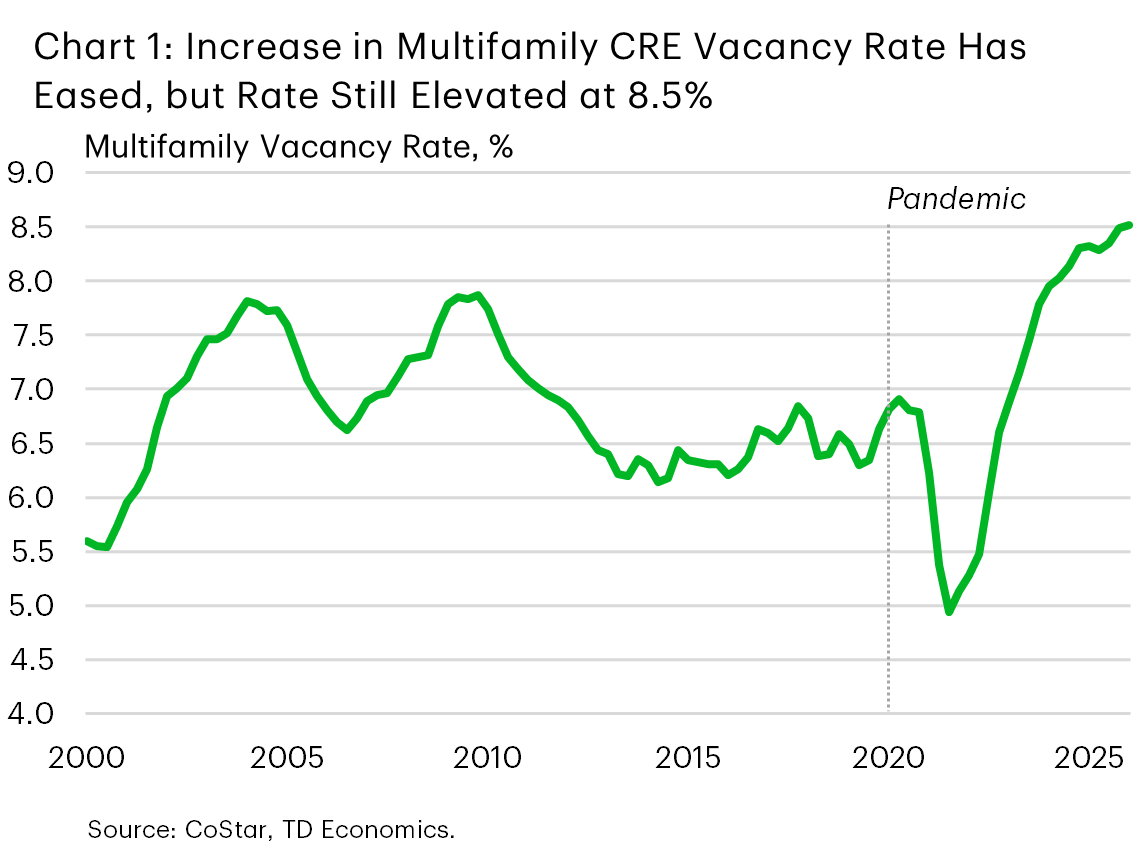
After a historic wave of apartment deliveries pushed the national multifamily vacancy rate sharply higher, a more recent cooling in completions has helped slow the pace of deterioration. Even so, talk of stabilization – let alone recovery – would be premature. Fundamentals remain soft: vacancies remain elevated, rent growth has stalled, while many markets continue to rely on concessions to support leasing (Chart 1).
Scratching beneath the surface reveals several important themes. For starters, the rent-versus-buy gap is keeping some households in the renter pool for longer, supporting demand at the margin. Meanwhile, concessions in newly delivered buildings are encouraging trade-ups into newer, higher-quality spaces – pressuring occupancy in older, stabilized stock. At the same time, multifamily CRE conditions remain highly local. Across large East Coast metros, a clear north–south divide remains evident, with several Northeast markets faring better than their Southeast counterparts. Looking ahead, however, there are indications that this geographic divide will become less pronounced as supply continues to cool – albeit at different paces – across parts of the region.
Supply wave is easing, but market conditions still soft
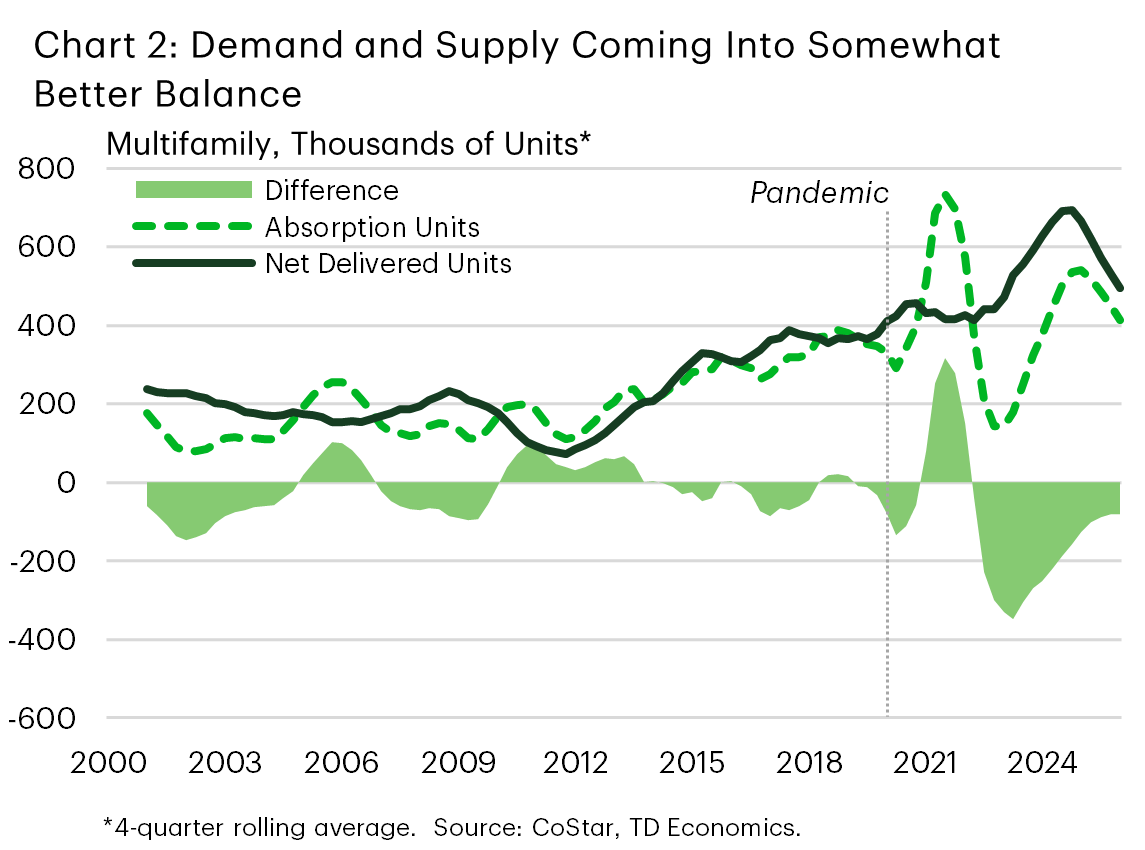
The U.S. multifamily supply cycle has clearly turned and the market appears to be moving off the worst of the correction. The number of units under construction is down from a peak of just under 1.2 million in mid-2023 (as estimated by CoStar; about 6% of inventory) to just under 600 thousand today or 2.8% of existing stock. Annual net deliveries, meanwhile, peaked at just under 700 thousand units in 2024, falling to roughly 530 thousand in 2025, and are expected to fall under 400 thousand this year (Chart 2).
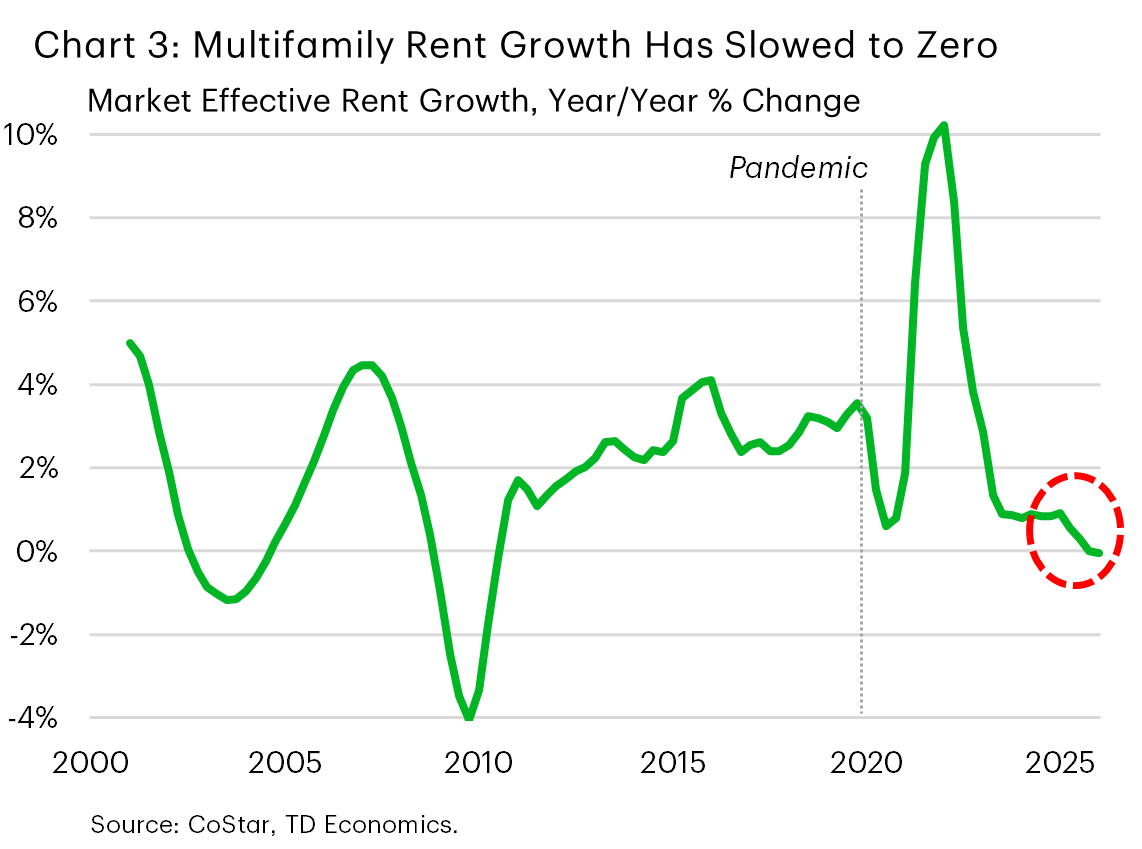
With supply cooling, the market appears to be moving off the worst of the correction, though supply continues to outstrip demand, thus keeping the vacancy rate elevated and rent growth flat (Chart 3). National vacancy is running at 8.5% – up only a modest 0.2 percentage points from the start of last year. This slower climb is a sharp contrast to the surge that occurred between 2021 and 2024 and may look like an early stabilizing signal. However, with additional supply still in the pipeline, this steadiness may prove temporary.
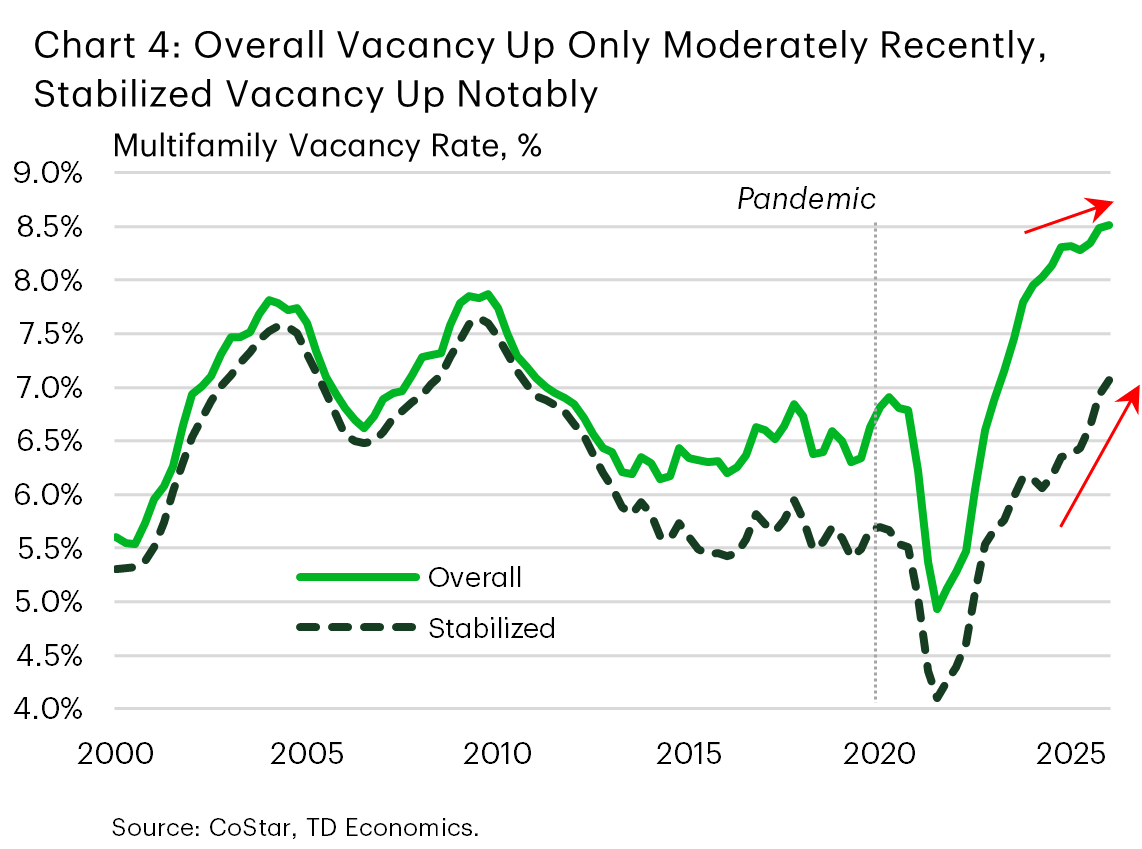
A key nuance is that while headline vacancy has slowed, stabilized vacancy – which encompasses only mature properties and excludes newly delivered units – continues to edge higher. This reflects a more competitive environment in tune with increased choice for renters. Concessions remain widespread, particularly in markets that have recorded the largest concentration of recent deliveries. Incentives are improving lease-up performance in newly delivered, higher-end buildings, but they are also pulling demand away from existing product. As a result, headline vacancy may look rather stable while stabilized vacancy continues to trend higher (Chart 4). The same dynamic shows up across the quality spectrum: elevated 4/5 Star vacancy is being worked down through aggressive pricing and concessions, while 3 Star properties face tougher renewal conditions and incremental vacancy pressure as renters trade up.
Outlook: Vacancy likely to drift a bit higher before improving later next year
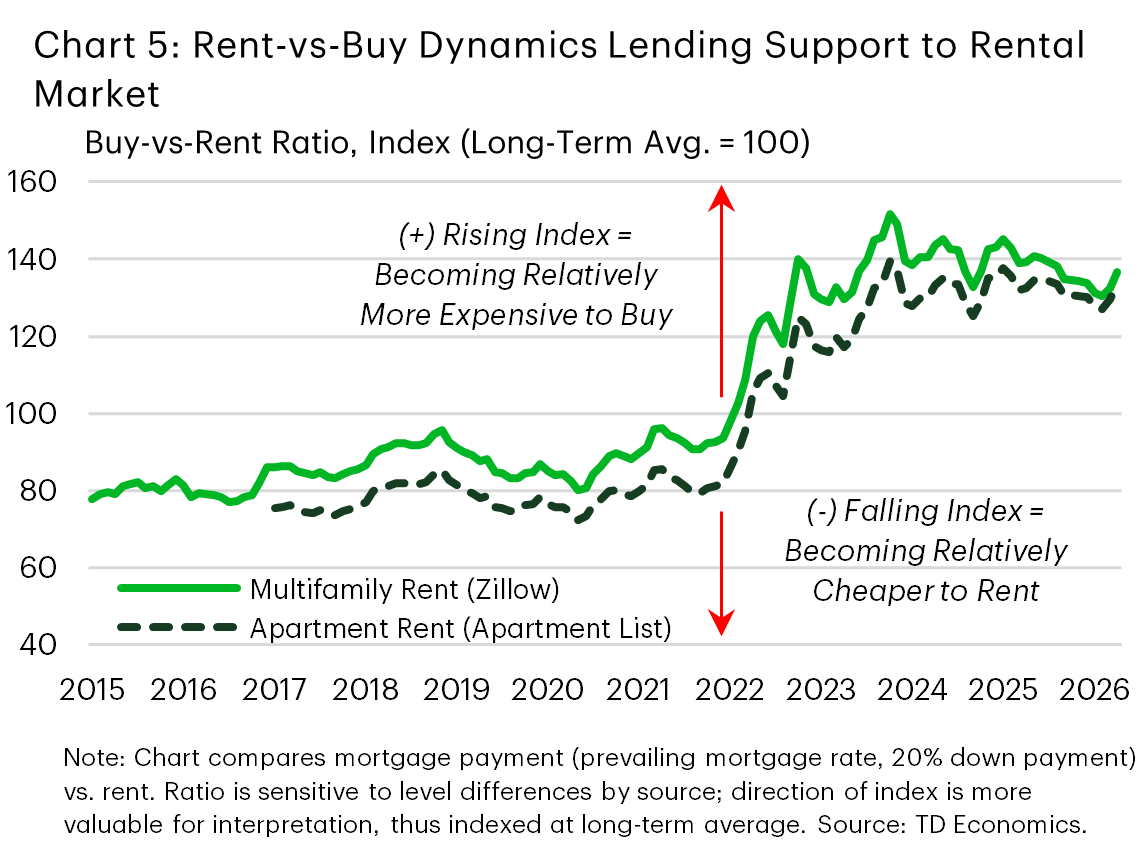
When it comes to the absorption of rental stock, the theme is one of slower – though still decent – demand compared to recent years, on the back of cooler job and population growth. The latter is underpinned by a sharp reduction in immigration. That said, demand is getting some help from the ownership side of the housing market. With mortgage rates still high relative to the pre-pandemic period, and home prices elevated, the monthly cost of owning remains well above renting across a wide set of metros. This shift in the buy-versus-rent ratio is keeping some would-be buyers in the renter pool longer, providing a backstop to absorption (Chart 5).
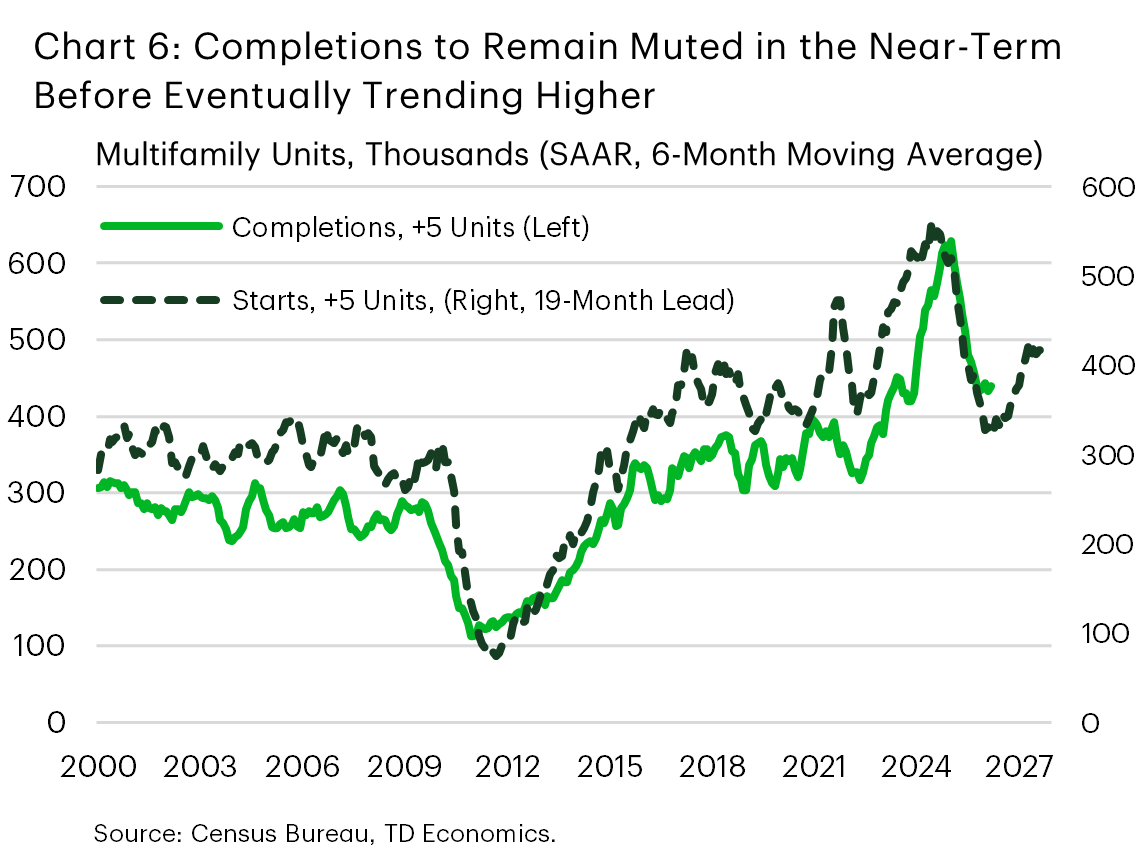
On the supply side, completions are also cooling – a trend that carries hope for conditions to firm over the near term. But while supply is likely to head lower over the near-term, there are signals that this downshift may not be long-lived. Multifamily starts have trekked higher since mid-2024 and are up by over 25% since reaching its trough. With typical start-to-completion timelines in mind (about 19 months when it comes to large multifamily projects of more than 5 units), completions are expected to pick up again moderately around the turn of next year (Chart 6). As a result, vacancy risks remaining skewed to the upside into late-2026 and early-2027, with the rate expected to drift up modestly from current levels before it begins to cool again late next year as supply pressures fade. This backdrop argues against a quick, broad-based rebound in rent growth, which we anticipate won’t improve much beyond the low single digits over the forecast horizon.
East Coast Dichotomy: A North-South Split…
Table 1: U.S. Multifamily CRE - Northeast Metros Holding Up Better
Table 1 compares long-run averages versus the latest reading (Q1-2026) for U.S. multifamily metrics across selected East Coast metros, including vacancy rates, rent growth, price growth, and construction pipelines (units under construction as a share of inventory). The table shows vacancy rates are generally higher in the selected Southeast metros—both historically and currently—than in their Northeast counterparts. Rent growth is relatively stronger in the Northeast and softer across the Southeast metros shown, with price growth trends broadly reflecting a similar pattern. Construction pipelines are most elevated in several Southeast markets, particularly Miami, Charlotte, and Tampa, indicating greater near-term supply pressure in those areas.
| East Coast Metros | Vacancy Rate | Rent Growth | Price Growth | Under Construction as a % of Inventory |
||||||||
| LT Avg | Q1 '26 | Diff. | LT Avg | Q1 '26 | Diff. | LT Avg | Q1 '26 | Diff. | LT Avg | Q1 '26 | % Diff. | |
| U.S. | 6.9 | 8.5 | 1.6 | 2.1 | 0.0 | -2.1 | 5.8 | 1.0 | -4.8 | 2.9 | 2.8 | -4.6 |
| Boston | 4.9 | 6.5 | 1.6 | 2.2 | -0.1 | -2.3 | 6.6 | 0.4 | -6.2 | 4.4 | 4.7 | 7.1 |
| New York | 3.1 | 2.9 | -0.2 | 1.8 | 2.3 | 0.5 | 5.9 | 1.2 | -4.7 | 2.3 | 2.8 | 24.4 |
| Northern NJ | 5.1 | 6.3 | 1.3 | 1.8 | 1.1 | -0.8 | 5.9 | 6.8 | 0.9 | 2.8 | 4.4 | 53.8 |
| Philadelphia | 6.3 | 7.3 | 1.0 | 2.0 | 1.8 | -0.1 | 5.7 | 1.3 | -4.5 | 2.2 | 1.9 | -15.9 |
| Wash. DC | 6.4 | 8.5 | 2.0 | 2.2 | -2.1 | -4.3 | 5.4 | 1.2 | -4.2 | 3.8 | 2.3 | -40.5 |
| Charlotte | 8.1 | 12.5 | 4.4 | 1.0 | -2.4 | -3.4 | 6.0 | -0.3 | -6.2 | 6.8 | 7.0 | 3.7 |
| Atlanta | 9.1 | 11.7 | 2.6 | 1.5 | -1.2 | -2.7 | 5.1 | 0.5 | -4.6 | 3.7 | 2.9 | -20.6 |
| Orlando | 7.9 | 10.8 | 2.8 | 2.3 | -2.0 | -4.3 | 6.5 | -1.2 | -7.7 | 5.7 | 4.6 | -19.5 |
| Tampa | 7.8 | 10.7 | 2.9 | 2.7 | -4.5 | -7.2 | 6.5 | -2.1 | -8.5 | 3.7 | 5.5 | 47.5 |
| Miami | 5.6 | 7.3 | 1.8 | 2.4 | -0.7 | -3.1 | 7.3 | 3.2 | -4.1 | 4.5 | 7.0 | 55.9 |
Looking at large East Coast metro areas in detail, a dichotomy is visible, with multifamily CRE conditions showing a clear north-south split (Table 1 summarizes the metro scorecard).
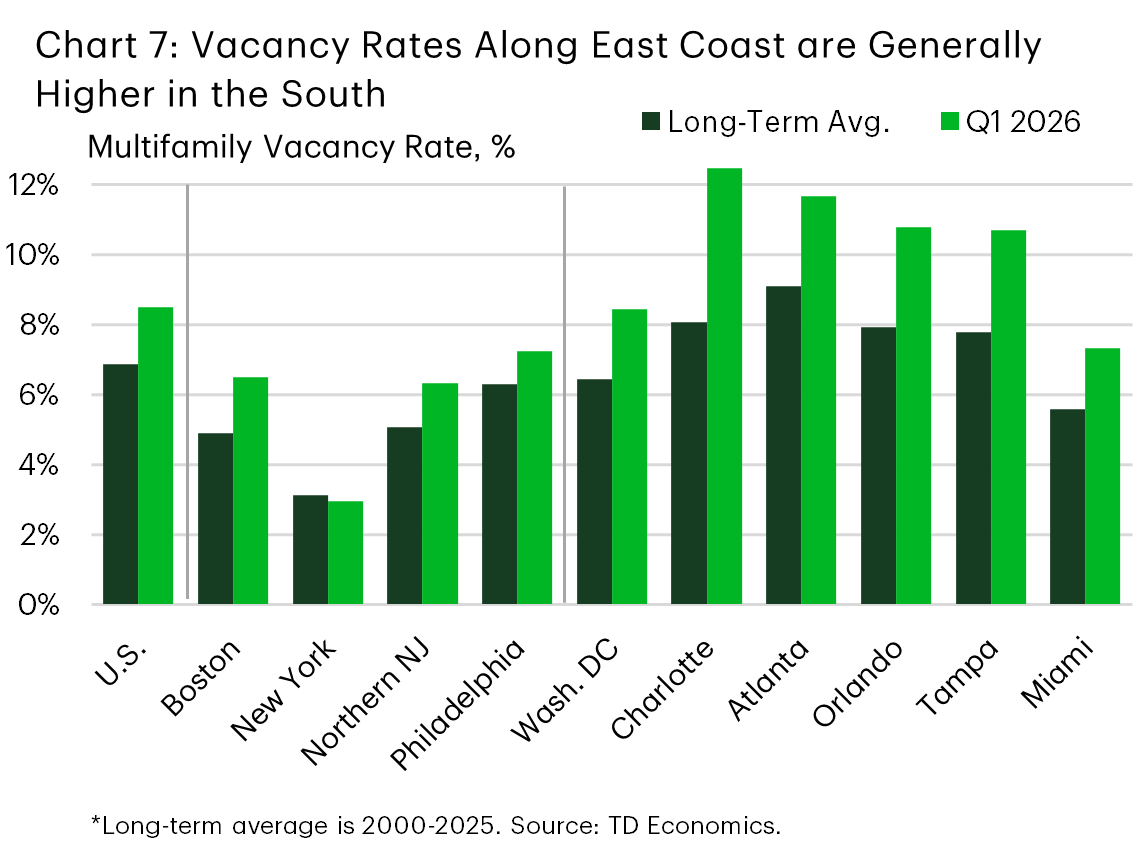
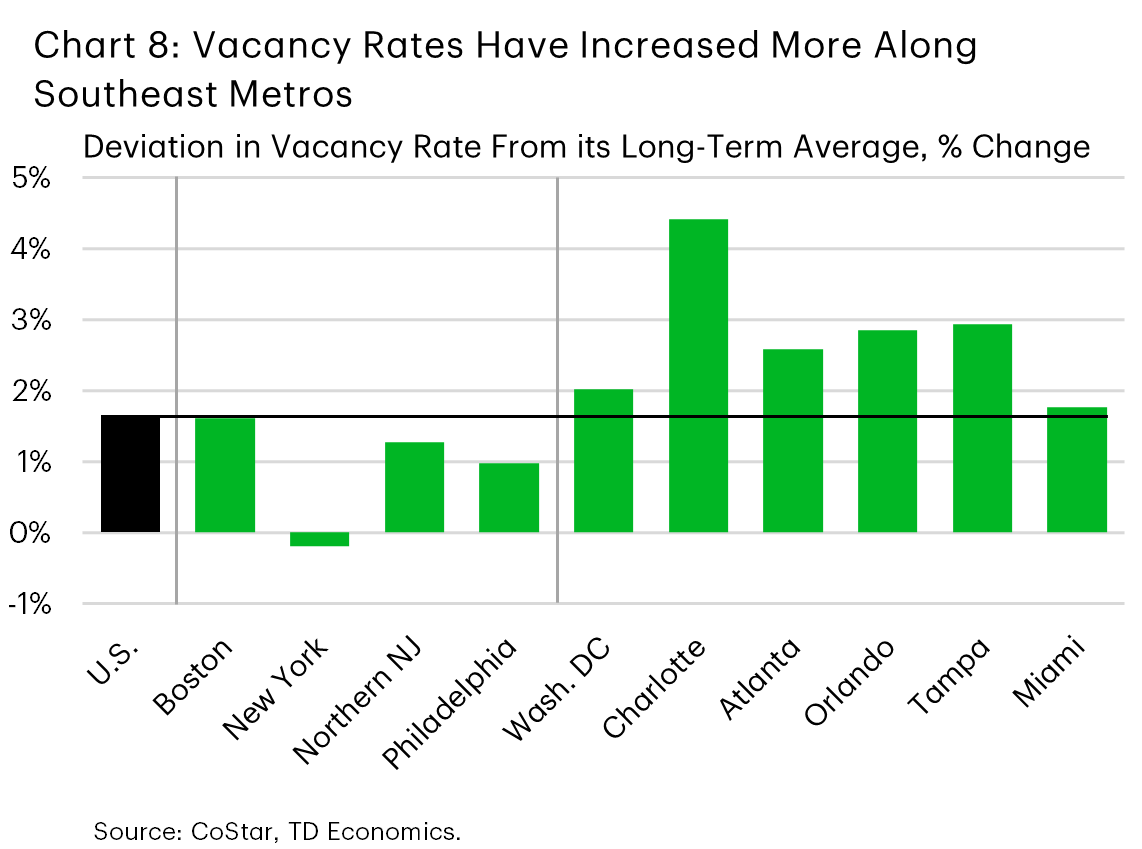
Indeed, the four large Northeast markets examined in this report show lower vacancy rate pressures than their six Southeast counterparts. To be clear, this is not just from a vacancy level perspective – vacancy rates have tended to be lower in the Northeast compared to the Southeast over time, a theme still in place today (Chart 7). What is more relevant is the deviation from long-run norms. Southeast metros have seen a larger jump in their vacancy rates vis-à-vis long-term trends, compared to their northern counterparts, even as the vacancy rate in places like Boston and Northern New Jersey (NJ) has trekked a bit higher more recently (Chart 8). This north-south split is reflected in rent growth, which is holding up better among Northeast metros (Table 1).
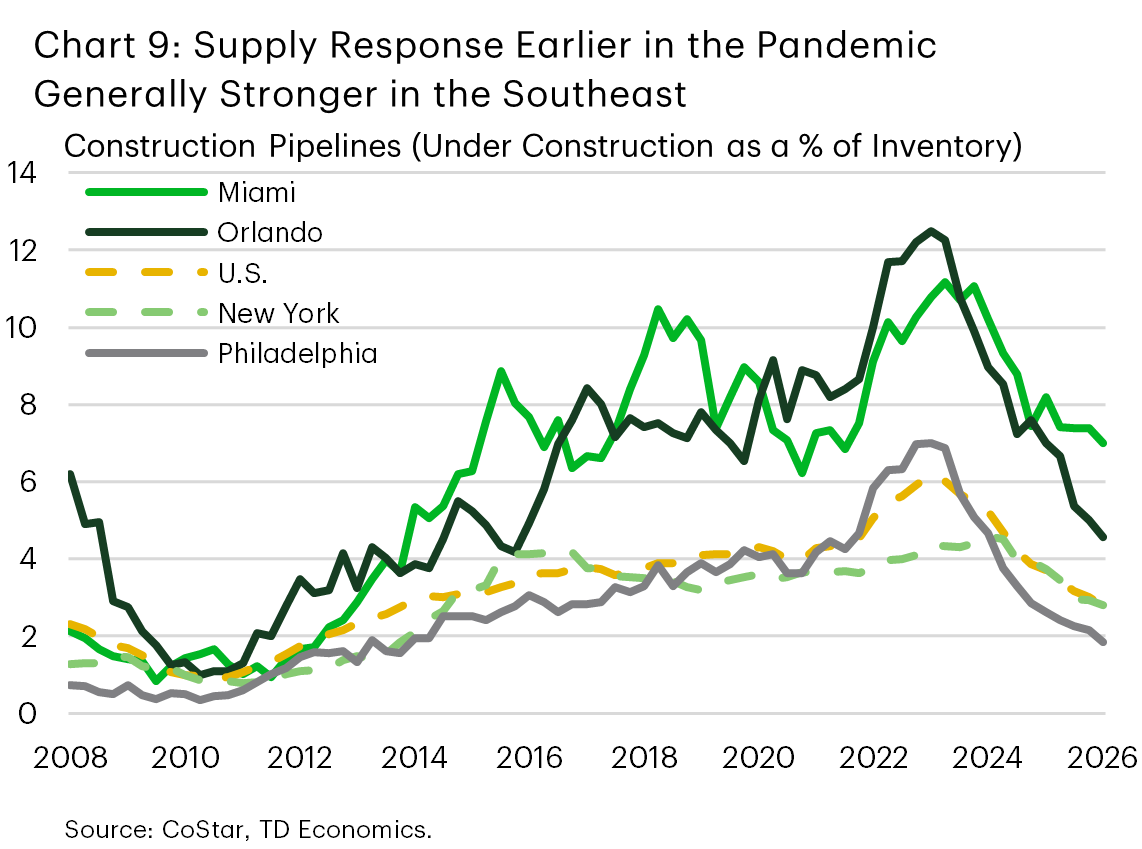
The dichotomy can be partly explained by shifting population trends. In the early phases of the pandemic, Northeast metros were generally losing residents to other parts of the country, whereas Southeast metros were generally at the receiving end. This meant that the planned supply could be increased more aggressively in the South (Chart 9). More recently though, the flow of ‘domestic’ migrants to the Southeast has slowed noticeably (see our report here). Meanwhile, a sharp slowdown in international migration is an added headwind. This has left elevated supply pipelines in the Southeast generally more exposed to new deliveries, compared to the more conservative approach taken by builders in the Northeast.
… Should Fade in Time
Supply pipelines across East Coast metros have been shifting lower, in line with the national trend. This downshift will help make the absorption of new units more manageable, reinforcing the medium-term stabilization theme. That said, the cooldown is happening at different speeds. The key takeaway is that, with population growth generally slowing, markets with still-large apartment pipelines are likely to face a longer stretch of elevated vacancy and concession-led leasing. By contrast, markets where pipelines are much leaner or have slowed sharply should see deliveries cool more quickly and are likely to stabilize sooner. Case in point: Atlanta and Orlando, where construction pipelines have cooled sharply and are running below pre-pandemic trends, appear to be among the first markets for some stabilization in conditions.
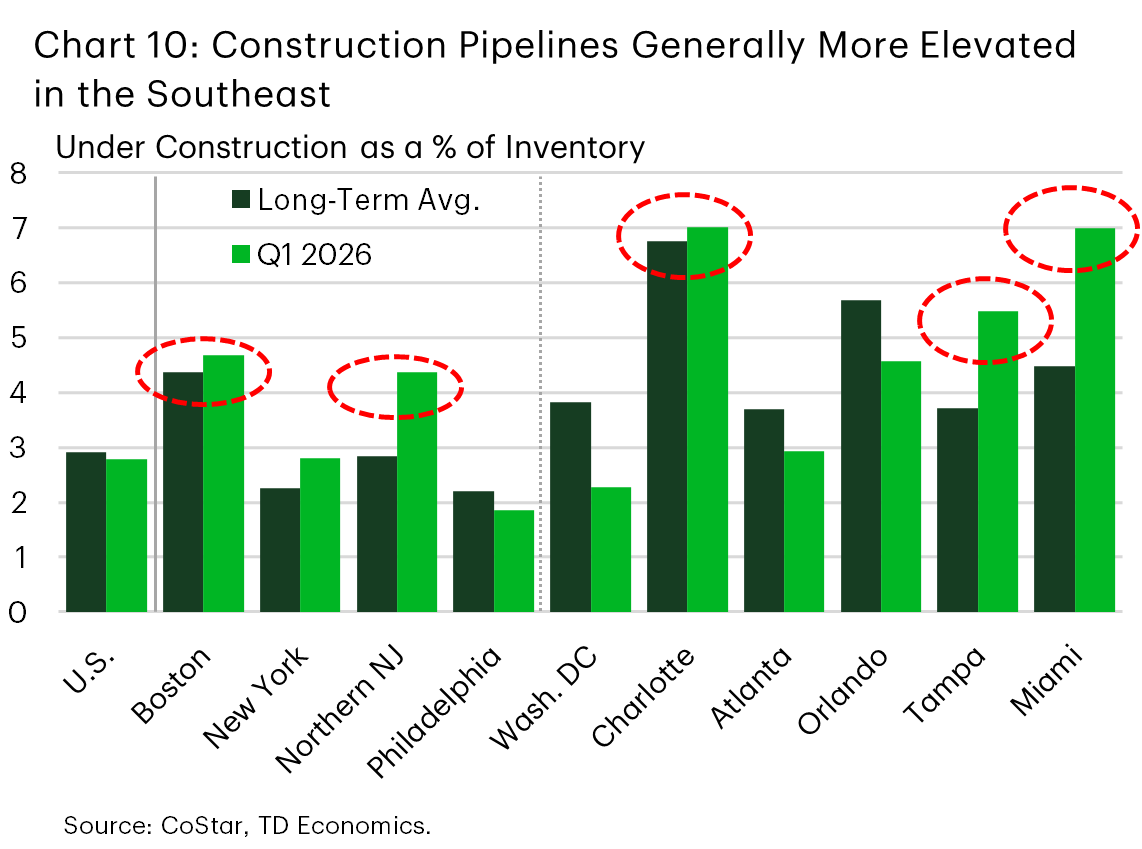
Charlotte and Miami stand out at the other end of the spectrum, with these markets having the largest pipelines in the group (about 7% of existing inventory) – suggesting that supply-related vacancy pressure could persist for longer. However, between the two, Charlotte is still seeing solid population growth, which is running near 2% year-on-year. This is far stronger than in Miami where – following a solid performance during 2022-23 – population growth has slowed sharply, posting a modest contraction last year. Employment trends tell a similar story, with payroll growth holding up much better in Charlotte. As a result, despite similarly elevated pipelines, conditions in Charlotte (which has the highest vacancy rate in the group at 12.5%) should begin to firm up sooner compared to Miami, whose comparatively lower 7.3% vacancy rate will likely take a bit longer to trend down. Tampa is another notably-exposed market with supply under construction the equivalent of 5.5% of inventory – the third highest among the group (Chart 10). Meanwhile, further up the coast, the supply pipelines of Boston (4.7%) and Northern NJ (4.4%), while generally much lower than their Southern counterparts, remain above both the national average and historical norms. This suggests that conditions in these markets have the potential to loosen slightly over the near term (more so in Northern NJ) and that the pace of improvement will be more muted compared to their regional peers with much leaner pipelines, like Philadelphia. At one point, Philadelphia had nearly 25 thousand units under construction, but that number has now cooled to only 7 thousand or 1.9% of inventory – a level that will be more easily digestible. While D.C. may also appear to fit this mold from a supply perspective, with its construction pipeline having slowed sharply and now sitting well below historical norms, weak demand fundamentals – partly tied to federal government cutbacks – suggest that the market will continue to struggle to digest inventory, with progress likely to be slow.
Looking at multifamily permitting data as an additional forward-looking supply signal reveals that the East Coast metros examined in this report have generally not recorded notable increases in permits in recent quarters. If anything, multifamily permitting activity has generally trended lower. New York is the only exception, with this market having recorded an uptick recently. This should put some modest upward pressure on the Big Apple’s construction pipeline, which has been shrinking consistently since early 2024, with the number of units under construction as a share of inventory falling from 4.6% to a more manageable 2.8%. For the region as a whole, however, the latest data suggests that, unlike the national trend (refer back to Chart 6), an eventual upturn in supply over the forecast horizon is not yet in the cards.
Bottom Line
The U.S. multifamily market appears to have moved off the worst of its correction, but the near-term backdrop remains soft. Vacancies remain elevated, and rent growth has stalled, reflecting a supply wave that is being absorbed only gradually. While there are signs that conditions may be steadying, we think it is premature to declare stabilization. With supply set to pick up again moderately into next year, vacancies will likely push a bit higher from current levels before trending lower later next year. Any improvement in effective rents is likely to be gradual as the remaining supply pipeline clears.
On the East Coast, the story remains uneven. Today’s data still reflect a clear north–south split. Larger Northeast metros are generally more stable, while several Southeast growth markets are still absorbing relatively large pipelines amid cooler population growth. Looking ahead, this divide may become less pronounced. While Southeast metros with still-large construction pipelines, such as Miami, Charlotte and Tampa will likely face a longer period of elevated vacancy, rapidly shrinking pipelines in the region should help drive vacancy rates lower. At the same time, there is scope for conditions to loosen moderately in a couple of large Northeast markets – primarily Northern NJ, with more limited pressure in Boston – as the pace of deliveries from somewhat elevated pipelines could run slightly ahead of absorption in the quarters ahead.
Disclaimer
This report is provided by TD Economics. It is for informational and educational purposes only as of the date of writing, and may not be appropriate for other purposes. The views and opinions expressed may change at any time based on market or other conditions and may not come to pass. This material is not intended to be relied upon as investment advice or recommendations, does not constitute a solicitation to buy or sell securities and should not be considered specific legal, investment or tax advice. The report does not provide material information about the business and affairs of TD Bank Group and the members of TD Economics are not spokespersons for TD Bank Group with respect to its business and affairs. The information contained in this report has been drawn from sources believed to be reliable, but is not guaranteed to be accurate or complete. This report contains economic analysis and views, including about future economic and financial markets performance. These are based on certain assumptions and other factors, and are subject to inherent risks and uncertainties. The actual outcome may be materially different. The Toronto-Dominion Bank and its affiliates and related entities that comprise the TD Bank Group are not liable for any errors or omissions in the information, analysis or views contained in this report, or for any loss or damage suffered.
Download
Share: