Surging Mortgage Rates Hit U.S. Housing Affordability, Market Shows Early Signs of Cooling
Admir Kolaj, Economist | 416-944-6318
Date Published: April 11, 2022
- Category:
- U.S.
- Real Estate
Highlights
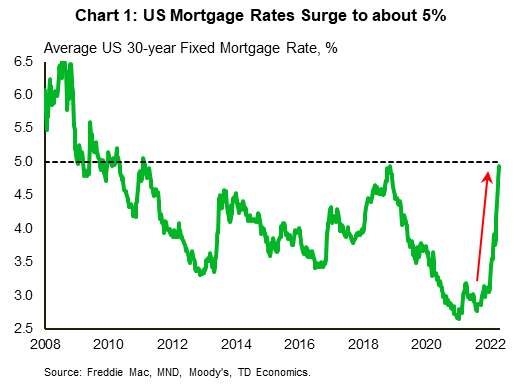
- The Fed's recent pivot into ever more hawkish territory has resulted in sharp move up in borrowing costs. The average 30-year fixed mortgage rate, which sat at a little over 3% at the end of last year has increased to around 5%.
- A buyer purchasing a median-priced home for $360,000 at the end of last year, would now need to put around an additional $300 toward their monthly mortgage payment based on the higher mortgage rate alone. Factoring in recent price gains into the calculation sends the tally even higher.
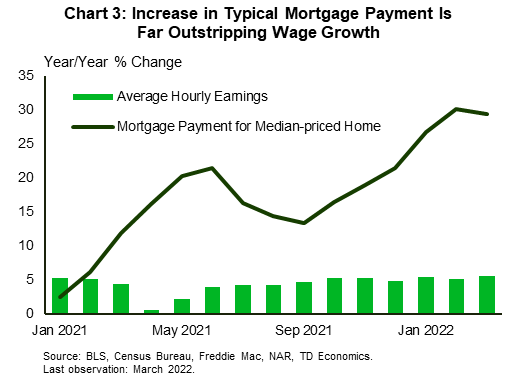
- The mortgage payment for the purchase of a median-priced home is up around 30% from year-ago levels. This is far higher than nominal wage growth, resulting in a steep reduction in housing affordability.
- Softer showings among several indicators, such as pending home sales, mortgage purchase applications, home tour trends, together with an increase in share of sellers that are lowering their asking price suggest that higher rates are taking a toll on demand and that the still-hot U.S. housing market may be cooling.
In a report released in early March, we took a deep dive into the U.S. housing market (see "A Bit More Supply, Higher Rates to Cool U.S. Housing Market This Year" here). Among the key takeaways from that note was the fact that higher interest rates would weigh on housing affordability and take a toll on housing demand. Since then, the Federal Reserve has taken an even more hawkish turn than anticipated.
Through a series of speeches, Fed officials have signaled a faster pace of rate hikes and a quicker start to balance sheet reduction than previously anticipated as a means to tackle accelerating inflation. Market odds now heavily favor 50 basis points hikes at the next two FOMC meetings. Amidst this rising interest rate backdrop, mortgage rates have continued their sharp ascent, rising more than a full percentage point since our March report. The average 30-year fixed mortgage rate, which hovered at a little over 3% at the end of last year, is now around 5% (Chart 1). The only other time rates have been this high in recent history is in late-2018 and early-2011.
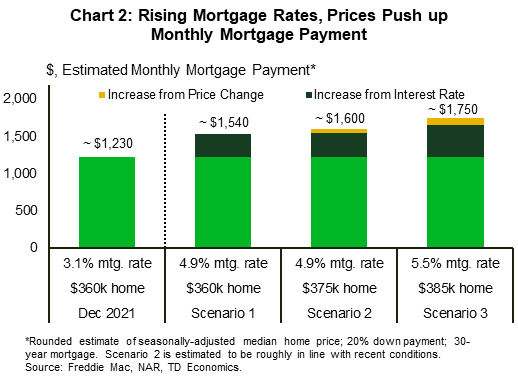
The sharp run up in mortgage rates means that a buyer purchasing a typical home with a median value of around $360,000 at the end of 2021 would now have to pay roughly an additional $300 per month as a result of higher interest rates alone, all else equal (Chart 2). Of course, with inventory levels still near record lows, home valuations have also continued to increase over the last few months. Factoring in the price increase into the calculation, the increase in the monthly mortgage payment reaches about $370 (around $4400 per year) compared to the end of 2021 (see Scenario 2 in Chart 2). For some prospective buyers, the higher rate environment will mean that they have to dig deeper into their budget and cut out some non-essential expenditures. Others, however, won't be able to quality for a mortgage at these higher rates altogether, thereby taking some steam out of demand.
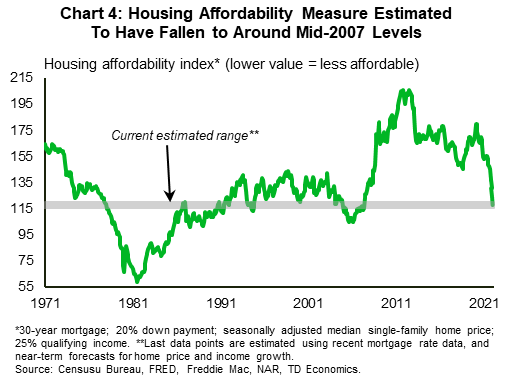
Homebuyers are receiving some support from a tightening labor market. Job openings remain at historic highs, and a falling unemployment is encouraging decent (nominal) wage growth. Looking past inflation for a moment, wage growth as measured by average hourly earnings is running at a little over 5% year-on-year – an improvement from its 3% pace before the pandemic. The Atlanta Fed wage tracker points to a slightly better 6% pace as of March. Even so, the increase in the size of a typical mortgage payment for the purchase of a median-priced home is up around 30% year-on-year – far outstripping wage growth (Chart 3). The result is a steep reduction in affordability, which we estimate to have fallen to around mid-2007 levels recently (Chart 4).
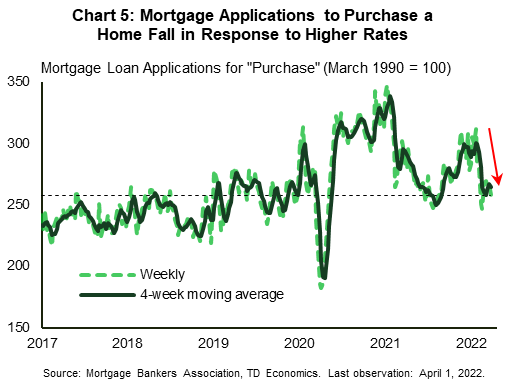
Reduced affordability is taking a toll on housing demand – a narrative corroborated by a number of indicators. For instance, the National Association of Realtors (NAR) pending home sales index fell for the fourth straight month in February and is approaching a two-year low. The index tracks the number of home purchase contracts signed and is a near-term leading indicator for existing home sales. Meanwhile, mortgage applications for the purchase of a home (i.e., excludes refinances) have also headed lower over the last several weeks and are down around 15% from the end of February and close to 10% from year-ago levels (Chart 5).
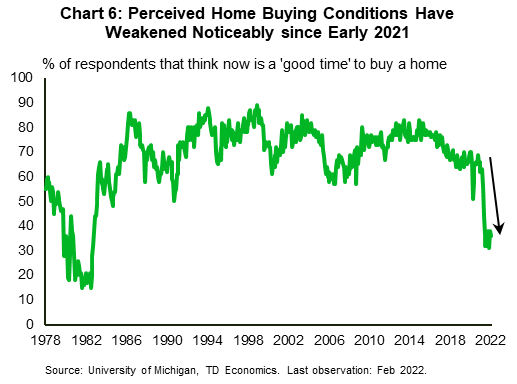
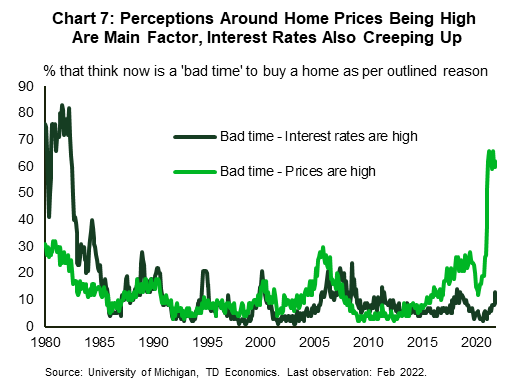
Sentiment measures echo a similar narrative. Up to the start of last year, perceptions around homebuying conditions were still fairly positive, with almost two-thirds of respondents to the University of Michigan consumer survey believing that it was a 'good time' to buy a home, and only a little more than a third believing that it was a 'bad time' to buy. Fast forward to today and the roles have been swapped. The vast majority of respondents, roughly two thirds, now believe that it is a bad time to buy (Chart 6). Digging deeper as to the reasons behind this, the perception that 'prices are high' appears to be the driving factor (Chart 7). To this end, a recent Dallas Fed analysis found signs that house prices are "increasingly out of step with fundamentals". The report only examines activity out to the third quarter of 2021; prices have risen further since then. Rising interest rates are also behind the belief that now is not a good time to buy a home (Chart 7). Data for the latter, however, only extend to February 2022. Given that mortgage rates have continued to rise sharply since then, we would expect the interest rate factor to play a bigger role in weakening perceived homebuying conditions in the near-term.
Softer showings in alternative measures of market activity and buyer interest, such online home searches and home tours, together with an increase in share of sellers that are reducing their asking price after putting their home on the market (see analysis here and here) are some additional early signs that the housing market may be moderating.
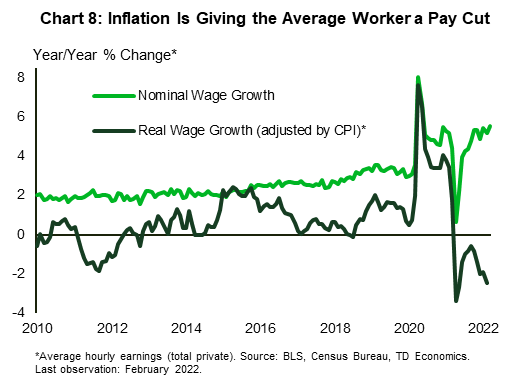
Besides the rising cost of housing, both when buying and renting – market measures show year-on-year rent growth is up in the double digits, a factor that is also making it harder to save for down payments – household budgets are also being squeezed by broad-based prices increases. Higher prices for items such food, energy and transportation are taking a bigger bite out of consumers' wallets. Accounting for inflation, wage growth is in fact in negative territory in year-on-year terms (Chart 8 in the appendix).
Bottom Line
All of these factors reinforce the notion that the still-hot U.S. housing market is in for a moderation. While we expect home sales to tread lower over the rest of the year and price gains to decelerate, the fact that housing inventory remains at record lows suggests that home price growth is likely to remain well in positive territory in annual growth terms. That said, the future path of rates, which besides affecting homebuyer budgets can also have important implications for investor activity, bears careful watching. In a scenario where borrowing costs were to continue their recent sharp ascent – rather than our more moderate base-case scenario – price expectations will weaken further and could encourage investors to divest from residential real estate holdings. According to data from Redfin, investors snapped up one in seven homes sold across America last year – the most in at least two decades. In markets with hot price growth, such as Atlanta, Charlotte and Miami, investors snapped up a staggering one quarter of all homes sold last year. Strong investor presence in a market can accentuate price pressures both on the way up – as it has likely happened over the past year – and on the way down.
Appendix
Disclaimer
This report is provided by TD Economics. It is for informational and educational purposes only as of the date of writing, and may not be appropriate for other purposes. The views and opinions expressed may change at any time based on market or other conditions and may not come to pass. This material is not intended to be relied upon as investment advice or recommendations, does not constitute a solicitation to buy or sell securities and should not be considered specific legal, investment or tax advice. The report does not provide material information about the business and affairs of TD Bank Group and the members of TD Economics are not spokespersons for TD Bank Group with respect to its business and affairs. The information contained in this report has been drawn from sources believed to be reliable, but is not guaranteed to be accurate or complete. This report contains economic analysis and views, including about future economic and financial markets performance. These are based on certain assumptions and other factors, and are subject to inherent risks and uncertainties. The actual outcome may be materially different. The Toronto-Dominion Bank and its affiliates and related entities that comprise the TD Bank Group are not liable for any errors or omissions in the information, analysis or views contained in this report, or for any loss or damage suffered.
Download
Share: