Don’t You Forget About Me
U.S. Inflation Risks In The Post-Pandemic World
James Marple, Managing Director & Senior Economist | 416-982-2557
Date Published: January 27, 2021
- Category:
- U.S.
- Forecasts
- Financial Markets
- Consumer
Highlights
- After falling precipitously through the pandemic, inflation is now on the mend. With rebounding energy prices, the year-on-year change in the Consumer Price Index (CPI) is likely to move above 3% in the spring of this year.
- As economic activity normalizes, inflation could well maintain some heat. Pass through of higher costs by businesses most impacted by the pandemic appears likely and ramping up capacity after several months of shutdown could be difficult in the face of rapidly improving demand.
- The real risk to inflation comes from the significant amount of monetary and fiscal stimulus. This has allowed households to amass record levels of savings while their spending is restricted by the reality of the pandemic. A rapid deployment of this “excess saving” once restrictions ease later this year poses upside risk to both economic growth and inflation.
- Over the medium-term, the outlook for inflation will depend on the path of fiscal and monetary policy and, in particular, how effectively current extraordinary supports are unwound. The Fed has changed its strategy to allow inflation to temporarily overshoot its 2% target. It may get more than it bargained for.
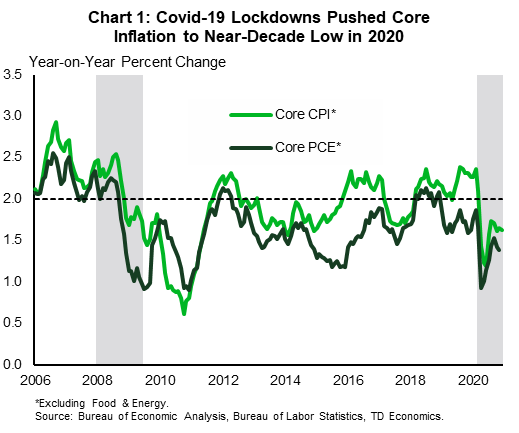
The Covid-19 pandemic took a cleaver to inflation. At the height of the crisis in May, the year-on-year change in the U.S. Consumer Price Index (CPI) fell to just 0.1%. The Fed’s preferred measure, the Personal Consumption Expenditures (PCE) Index, held up only slightly better at 0.5%.
Much of the headline volatility reflected plunging energy prices, but core prices (excluding food and energy) were not spared either. Core inflation rates for both CPI and PCE measures were cut in half relative to the pre-crisis period (Chart 1).
Inflation has picked up in the months since, and thanks to a firming in both core price growth and rebounding energy prices, the CPI measure is likely to surpass 3% by the second quarter of this year. Beyond that, our forecast calls for CPI inflation to hover between the 2.0% and 2.5% mark as the economy continues to recover.
The risks to this outlook, however, are increasingly to the upside. Households have accumulated a significant amount of saving through the pandemic that could be spent in short order once the health crisis subsides, pushing economic growth above our expectations. With many business costs likely to be higher in the post-pandemic world, and consumers having the wherewithal to absorb them, this may lead, at least temporarily, to a continued acceleration in price growth and growing concerns around overheating.
Ultimately, the outlook for inflation will depend on how effectively fiscal and monetary policy makers unwind the policies they have put in place to support the recovery. The Fed’s new policy strategy is to allow inflation to move above its objective for a period of time in order to make up for past weakness. With another round of fiscal stimulus likely still to come, odds are growing that they will get.
Rebounding Energy Prices to Show Up in Higher Inflation in the Spring
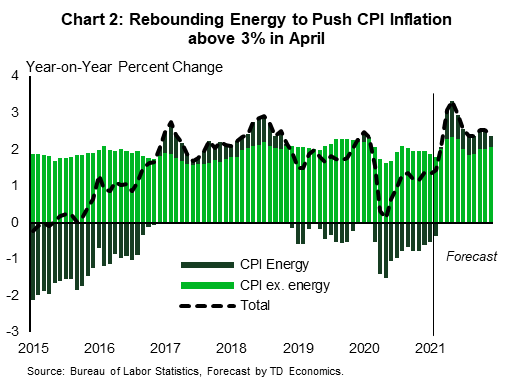
As it often is, the biggest factor pulling down inflation during the pandemic-led recession was plunging energy prices. As demand for all kinds of travel dried up, the energy price index fell almost 20% from the start of the year. At its trough in May, the energy index subtracted a full 1.5 percentage points from CPI inflation.
Since, then energy prices have been on a slow mend. The West Texas Intermediate (WTI) benchmark price recently moved above the $53 a barrel mark, within three dollars of its year-ago level. Even if it remains where it is, this represents a 200% gain from the trough in April (when it averaged just $16 a barrel). The price of oil is likely to gain further traction as the global economy recovers (see report). As a result, the energy component of consumer price indexes will switch from a negative force on price growth to a significant positive one. By the late spring, we expect energy to add a full percentage point to CPI inflation (Chart 2).
Food prices, on the other hand, have seen above-average gains since the start of the pandemic. As dining out all but ceased, demand for food consumed at home rose, pulling prices up with it. At the same time, shutdowns at meat packing plants caused a sharp jump in meat prices. Meat prices edged lower in the months hence as production returned to normal, but overall food prices have remained elevated. Food prices were up 3.9% year-on-year in December, down from a peak of 4.5% in June. As a result, the contribution to overall inflation has edged only modestly lower from a peak of 0.6 percentage points to 0.4 points.
Given that the onset of higher prices coincided with the start of the pandemic, and price growth moderated in the months that followed, its impact on year-on-year inflation is likely to taper off at the same time that energy picks up in the spring. Still, agricultural commodity price indexes have shot up at the start of 2021, suggesting that food price inflation could pick up once again.
As Depressed Service Sectors Normalize, Core Inflation Will Pick Up
While these factors explain much of the recent volatility in consumer price inflation, the majority of the consumer basket is made up of “core” goods and services. Within services, the pandemic’s impact has been near universally negative (with the exception of home entertainment services), as economic activity has been shut down or extremely curtailed due to the pandemic.
The biggest downward drag on services prices has been transportation services, which fell sharply, due mainly to declining airline fares. Since troughing in May, however, transportation service prices have been recovering in fits and starts. The resurgence in the pandemic has once again grounded a considerable amount of air travel, but vaccine rollout should allow for a robust rebound, just in time for the busy summer period. With older citizens the first to receive vaccines, they could give a jump start to travel demand, helping push price growth even further.
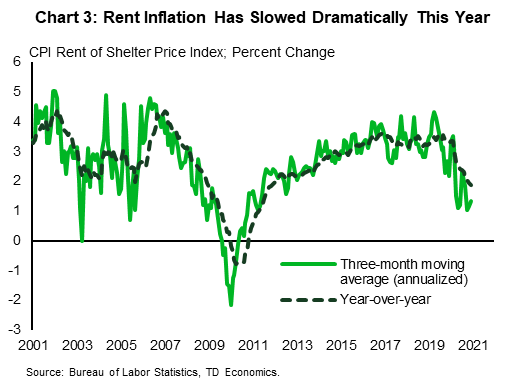
The other category within services that has softened considerably, but more gradually, is housing services. The biggest component here is rents. Prior to the pandemic, rental price growth was one of the most consistent sources of upward pressure on core inflation, averaging over 3% a year from 2016 through 2019. While still positive, it is now growing under 2% year-on-year and averaged just 1.3% (annualized) in the final three months 2020 (Chart 3).
The decline in rent growth reflects the disproportionate impact of the recession on employment and housing demand in core urban areas. Even while homeowner demand has strengthened, in more dense urban centers like New York City, rents are falling outright. Vaccines should lead to a recovery in rental demand, which should also get an added boost from the return of students as in-class college resumes in urban campuses across the country. Still, this element of the CPI index is one of the slowest moving and shows a considerable amount of persistence. As such, it is likely to continue to have a dampening effect on inflation measures over the next several months, though one that lessens over time.
Goods Prices Moving in Both Directions, But Mostly Up
Unlike services, consumer spending on goods is already above pre-crisis levels. While retail sales have pulled back as restrictions tightened and income supports diminished at the end of last year, in December the level of sales was still 5.5% above its pre-pandemic January peak. Indeed, retail sales are even higher than the pre-crisis trend. On a year-on-year basis, sales were up over 7.0% on a fourth-on-fourth quarter basis in 2020, up considerably from 3.9% in 2019.
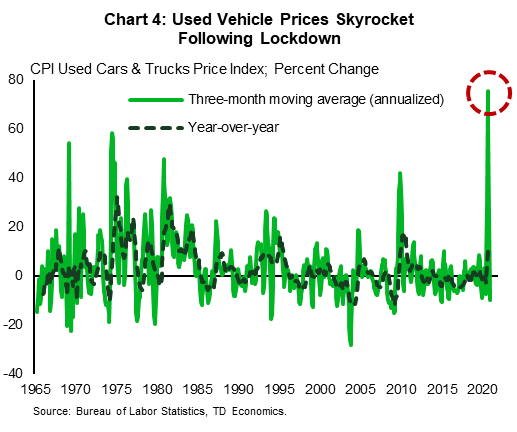
Two goods categories are worth calling out for their strong pandemic price response – used vehicle prices and apparel. On the upside, used car prices skyrocketed in the months following the first lockdown. This was both a supply and demand story. On the supply side, shutdowns and delays in new vehicle production cut into vehicle supply. On the demand side, low borrowing costs, government income supports and a reluctance to use public transportation no doubt contributed to gains in sales. Still, the extent of the jump in prices has been extraordinary – the three months from July through September saw the strongest period of used vehicle prices on record (Chart 4). Used car prices edged lower in the final three months of 2020 and with supply and demand looking more balanced, price growth should prove more subdued going forward.
On the downside, apparel prices plummeted early in the pandemic as retail shopping fell off a cliff. From March to May, apparel prices fell nearly 9%. Much like transportation, prices have been in recovery mode since then, but are still down 5% from February. In fact, apparel prices, like other durable goods, have been a deflationary force on consumer prices. The price index peaked in the late 1990s, as globalization and reductions in shipping costs allowed for two decades of slowly declining prices. However, the pandemic has also put pressure on this area of the economy. Shipping costs have risen steeply in recent months, in part due to the pandemic slowing traffic at major ports. This will likely show up in higher consumer prices for imported goods like apparel in the months ahead.
Putting it all together, the near-term outlook for price growth will reflect the cyclical recovery, and indeed, the year-on-year measures capture much of the recovery already in train. Price growth will look the strongest relative to the trough in the spring, when this “base effect” pushes the CPI headline measure above 3% and the PCE measure to around 2.5%. At the same time, core CPI inflation is likely to top 2.5% and core PCE to get close to the 2% mark in the second quarter.;
High Savings Suggest Upside Risks to Growth & Inflation as Health Crisis Passes
The potential for inflation to push even higher exists within this normalization narrative. Some of the still-depressed sectors of the economy will have lower capacity once the pandemic has passed. While business failures have been muted thanks to government supports, many have been closed for months and rehiring workers and ramping up capacity may not occur as quickly as demand returns. Capacity pressures are already being noted in Purchasing Managers Indexes. The latest IHS Markit Services PMI data release noted the fastest rate of service sector cost inflation “since data collection began in October 2009.”1
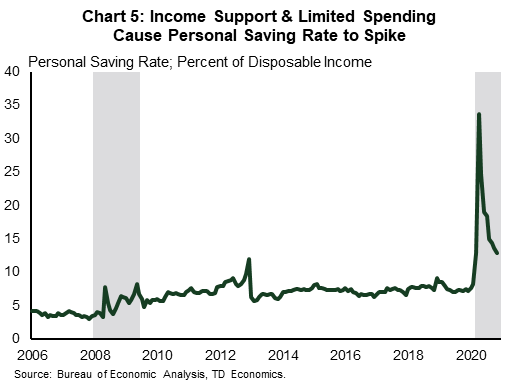
Importantly, the end of the health crisis will come as households have amassed historically high levels of saving. In November, the personal saving rate sat at 12.9%, up from 7.6% in January of last year (Chart 5). Congress passed another round of substantial income supports at the end of 2020. With the additional income, the saving rate will jump again in early 2021, likely surpassing the 20% mark.
We know from private spending data (see report) that the decline in spending has been more pronounced among higher income individuals, and therefore the saving rate among these groups is likely also larger. This is confirmed in deposit data, where cash-equivalent deposits are up the most relative to income for higher-income decile groups. This increase in deposits suggests a large amount of pent up potential spending as restrictions are eased. Should this be unleashed in short order, our forecasts for spending growth will prove too conservative. However, to get a full sense of the upside risk to growth and inflation we must build in the potential for even greater stimulus in the year ahead.
Biden’s Stimulus Plan Would Push GDP Above Pre-crisis Trend
In addition to the $2.3 trillion CARES Act and $900 billion Coronavirus Relief & Recovery Supplemental Appropriations Act (CRRSA), on January 14th now-President Biden proposed an additional $1.9 stimulus package that would include another $1 trillion in direct supports to households (split between $1,400 checks, unemployment insurance top ups and various other income supports). As we note in a recent report, there is some uncertainty about how quickly this money makes its way into the economy, but it will certainly raise the growth rate even higher above our baseline expectations.
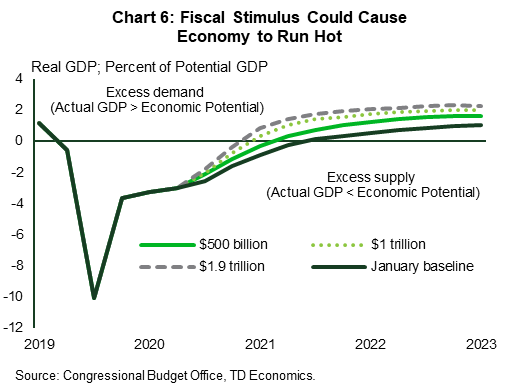
As noted, the full $1.9 trillion package appears unlikely to pass the slimmest of majorities in Congress, but in order to get a sense of what a package between $500 and $1.9 billion might do to inflation, we consider how projected GDP would compare to its full employment potential (as estimated by the Congressional Budget Office), as well as how it would compare to our pre-crisis forecasts for GDP. In the former case, the full $1.9 trillion package would lead projected GDP to run roughly 2.5% above its potential level (Chart 6). A positive output gap of this size is relatively rare, last estimated to have occurred in the 1970s, a period followed by accelerating and eventually double-digit inflation. Even in the case of a smaller $500 billion stimulus, the economy could be pushed into modest “excess demand” territory.
Pre-pandemic forecasts offer another benchmark. Before the health crisis and lockdowns hit, expectations were for steady, if relatively moderate growth around the 2% mark over the next several years. Comparing projected GDP under any new stimulus scenario shows a level of activity that would exceed these pre-recession expectations. The gap is not as large as using a potential output estimate because it does not account for the possibility of scarring caused by the pandemic. But, even under this more generous assumption, the economy will likely push into overheating territory. In the period where the gap is largest – 2022 through 2023 – some upward pressure on inflation should be expected.
The other way of gauging capacity pressures and economic slack is the unemployment rate. At 6.7% in December, the unemployment rate is currently well above its pre-crisis level of 3.5%. In fact, accounting for the number of people who have dropped out of the labor force entirely since February, a truer measure of unemployment is likely close to 9%. Nonetheless, even starting from this higher level, the rate of job growth that would be associated 6% economic growth, would be enough to bring the unemployment rate back to its pre-crisis level by the end of this year, and push even lower in 2022. By any measure, once the health crisis is over, with significant fiscal stimulus the economy could be running hot.
Indeed, running these estimates through our models, which account for measures of slack as well as stable inflation expectations (more on this to follow), core PCE inflation could be expected to push above the 2.5% mark. CPI inflation would likely move even higher, given the consistent positive gap with PCE inflation. While CPI is not the Fed’s preferred measure, it is used to price Treasury inflation-protected securities and this could well show up in higher nominal bond yields.
These estimates are far from certain, and the relationship between the output gap and inflation has been muted in recent decades. Still, with so much liquidity available just as restrictions on demand are lifted, this suggests the potential for higher inflation, at least until it garners a response from policymakers.
{related-articles-row}
Expectations Are Well Anchored…For Now
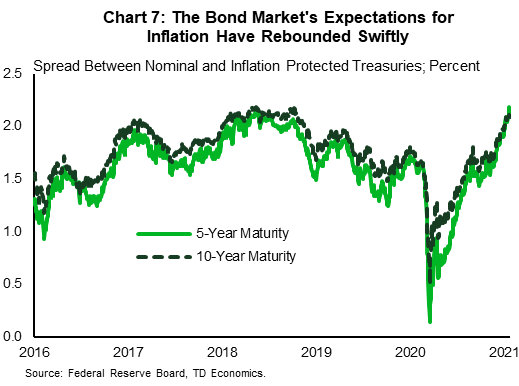
As noted, all of this assumes inflation expectations remain relatively well anchored. Expectations for inflation have begun to creep up in financial markets. Perhaps most noticeably, the spread between nominal bond yields and inflation-protected bonds – a proxy for market expectations of average inflation over the life of the bond – have increased across tenors. At the ten year maturity, the spread has risen a full percentage point from just north of 1% in June, to over 2% in January (Chart 7).
Market pricing for 2% inflation is exactly where the Fed would like it to be – consistent with their long-run objective. The real question mark is what happens to expectations if actual inflation begins to trend above the 2% mark for any meaningful period of time. The Federal Reserve’s new policy strategy commits to allowing some overshooting of inflation in order to make up for past weakness, but it has not specified how much above 2% or how long it will tolerate it. This more reactive/less pre-emptive policy marks an important break from the past. Anticipation that the Fed would nip any inflationary pressures in the bud before they got going likely helped keep both inflation expectations and actual inflation in check even in modest excess demand conditions. Without it, expectations for inflation could move higher.
At this point, in order to keep inflation on a stable path, the Federal Reserve may need to put its money where its mouth is and raise interest rates. However, given significantly higher levels of government borrowing, this could very quickly put pressure on financial conditions. Balancing on this tightrope between maintaining steady growth and inflation will be no easy task. The lesson of the 1980s was that once inflation expectations become unmoored, reining them in could require a painful economic adjustment.
Bottom Line
While the health crisis continues to rage, vaccine rollouts offer the potential to finally move the economy back to normal. Alongside the potential for even more stimulative fiscal policy, investor sentiment has shifted away from downside risks to growth and toward the potential inflationary consequences of the policy supports behind it.
There is little current evidence of inflation spiraling out of control. Indeed, the pandemic continues to weigh on prices in several areas, including air travel, accommodation, and clothing. Nonetheless, inflation will move up as the economy normalizes and with added cost pressures following the pandemic, could well come in higher than economists’ and financial analysts’ relatively sanguine expectations.
Admittedly, past calls for a material acceleration in inflation have not borne fruit. The current situation, however, is unlike that of the past. Household balance sheets are in better shape than they were coming out of the financial crisis. Income supports are larger and more progressive than any past policy responses. The combination of fiscal income supports and near one-for-one Treasury purchases by the Federal Reserve has successfully created Freidman/Bernanke’s vaunted helicopter money drop.2 The year-on-year growth in the highest powered money (demand deposits, checking deposits and currency) is more than seven times its past peak growth following the global financial crisis.
The American economy has already performed better during second (and now third) waves of lockdowns and could continue to surprise on the upside. With the arrival of vaccines, activities like air travel, concerts, full capacity indoor dining will return, along with the jobs that support them. With the amount of excess savings ready to be deployed and the confidence to deploy it, the next task for policymakers may well be sopping it up rather than piling it on.
End Notes
- https://www.markiteconomics.com/Public/Home/PressRelease/adc517110a0e4375b768010f191f9a5d
- Bernanke referenced Milton Freidman’s helicopter money drop in a speech in 2002: https://www.federalreserve.gov/boarddocs/Speeches/2002/20021121/default.htm#f8
Disclaimer
This report is provided by TD Economics. It is for informational and educational purposes only as of the date of writing, and may not be appropriate for other purposes. The views and opinions expressed may change at any time based on market or other conditions and may not come to pass. This material is not intended to be relied upon as investment advice or recommendations, does not constitute a solicitation to buy or sell securities and should not be considered specific legal, investment or tax advice. The report does not provide material information about the business and affairs of TD Bank Group and the members of TD Economics are not spokespersons for TD Bank Group with respect to its business and affairs. The information contained in this report has been drawn from sources believed to be reliable, but is not guaranteed to be accurate or complete. This report contains economic analysis and views, including about future economic and financial markets performance. These are based on certain assumptions and other factors, and are subject to inherent risks and uncertainties. The actual outcome may be materially different. The Toronto-Dominion Bank and its affiliates and related entities that comprise the TD Bank Group are not liable for any errors or omissions in the information, analysis or views contained in this report, or for any loss or damage suffered.
Download
Share: