Highlights
- Substantial income support programs have enabled American families to avoid financial hardship during the unprecedented downturn caused by the COVID-19 pandemic.
- On aggregate, income support programs have more than replaced the loss of employment compensation, while forbearance programs have stalled deterioration in household credit metrics.
- Healthy balance sheets going into the pandemic and a strong rebound in asset prices helped overall household net worth to reach new highs by the end of 2020.
- Despite progress in aggregate trends, lower-income families remain financially vulnerable to economic setbacks. Their financial well-being will remain dependent on income supports until the economy shows sustainable signs of healing.
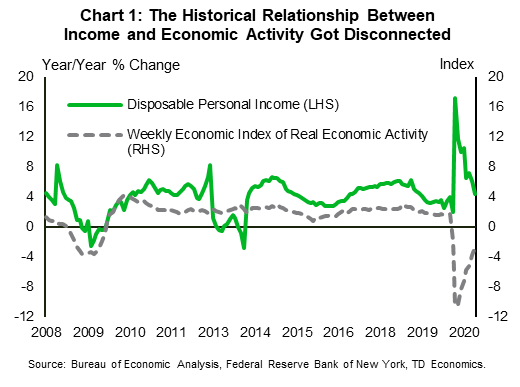
The economic downturn caused by the COVID-19 pandemic has been unlike any in recent history. The unprecedented nature of the crisis and policy response has complicated the task of measuring the financial health of American households. Perhaps most notably, the usual relationship between economic activity (GDP) and personal disposable income (PDI) has broken down. As real GDP contracted by the most on record in the second quarter, PDI did the exact opposite, growing by the most on record (Chart 1).
The substantial income support enacted by the Coronavirus Aid, Relief, and Economic Security (CARES) Act was the major reason for this decoupling. At the same time, government forbearance programs and lockdowns reduced household expenses and helped alleviate the financial strain typically evident in recessions.
As these programs waned at the end of last year so did economic momentum, building uncertainty for financially vulnerable households. Fortunately, with the enactment of the second round of income supports, the majority of families adversely impacted by COVID-19 should be able to avoid financial distress.1 However, longer-term household financial health will depend on the speed of economic recovery and the timeliness and scope of future government programs.
Income Support Programs Helped Families Cope with the Crisis
Over the past nine months, substantial income support programs have enabled American families to avoid financial hardship. The support extended through the CARES Act came in two types of social benefits – economic impact payments (EIP) and expanded unemployment insurance. Since April, the federal government has provided approximately $270 billion in EIP through one-time tax credits of $1,200 per adult and $500 per child (progressively phased out for higher income households).2 These supports were recently augmented under the Coronavirus Response and Relief Supplemental Appropriations (CRRSA) Act of 2021. “EIP-2” – payments of $600 per adult and qualifying children – have already begun making their way to households and are expected to provide an additional $165 billion worth of direct stimulus by the end of January 2021.3
The government also expanded unemployment insurance (UI) programs by topping up benefits, supporting workers who were ordinarily ineligible for the UI and extending benefits beyond their typical duration. Since April, these programs allocated over $370 billion to support incomes of those who lost jobs due to the pandemic.4 The new CRRSA Act provides an additional $120 billion in unemployment benefits over the period of almost three months. The bill includes supplemental unemployment insurance of $300 per week, a new provision that provides an extra $100 per week to workers with mixed earnings, as well as extensions of the Pandemic Unemployment Assistance (PUA) and Pandemic Emergency Unemployment Compensation (PEUC) programs to March 14, 2021.
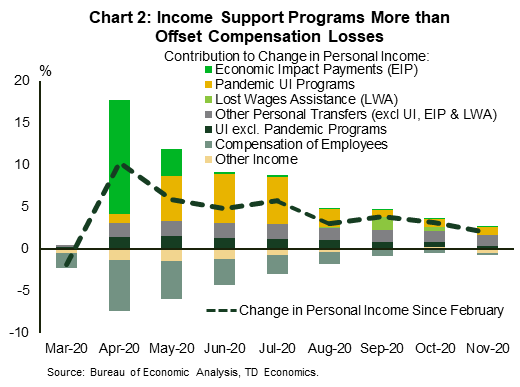
As a result of these income supports, most families were made better off than they had been prior to the pandemic (Chart 2). In fact, among advanced economies, only Canada has been more generous in supporting household income. Unemployment benefits replaced 121% of the earnings of a typical working family in comparison to only 40% under the regular unemployment insurance program.5 The program design is also progressive. For instance, the original unemployment insurance replacement income rate was greater for families in the bottom quartile (around 230 percent) relative to that of families in the top quartile (60 percent), while the EIP replaced approximately 26% of earnings in the bottom quartile and 3% of earnings in the top income quartile.
Personal income hit a recent peak in April when the bulk of the first EIP was paid out, but it will jump again in January with a disbursement of the EIP-2. Thanks to extended unemployment insurance, income has remained above its pre-pandemic levels even as payments ceased.
Still, the aggregate numbers only tell part of the story. For almost 14 million of Americans receiving unemployment benefits, government programs are main financial lifeline. Many of these workers are low income with little financial buffer. According to Opportunity Insights, as of October 2020, employment among low-wage workers was down close to 20% from the start of the year, compared to high-wage workers who gained 1.2%. By December, it was estimated to have worsened to 24.5%, while high-wage workers were still up 0.8%.
Unfortunately, with a new wave of infections and lockdowns, the labor market recovery appears likely to deterorate even further, bringing private compensation down with it. As a result, until business restrictions are lifted, government income support programs will remain vital to American families’ financial well-being.
{related-articles-row}
Lockdowns Put a Cap on Household Expenses
At the same time that support programs raised income, household expenses declined. At the peak of the lockdowns in April, personal consumption expenditures were 18% lower than pre-pandemic levels. Unlike past recessions, this decline was driven by shutdowns rather than falling income. Just as unique, the decline was mainly attributed to services. Goods spending has more than recovered and is currently 7% above February levels, but services are still 7% below.
Consistent with this trend, spending by high-income households declined more and recovered slower than spending by low-income households, especially in the early stages of the recovery.6 This is partially explained by the inability of high income individuals to spend as they usually would on travel and entertainment, but also to the positive impact of income support programs on the consumption of low-income families.7 Indeed, the difference in spending between high- and low-income households began to narrow at the end of 2020, as a result of the pullback in expenditures at the low end as support measures expired. It could well widen again in the near-term due to the combination of renewed income supports and more extensive lockdowns.
Over the longer-term, the overall gap between aggregate spending and income should close, but only once there are tangible signs that the health crisis is averted, businesses can reopen their doors and people feel safe again to travel, dine at restaurants, go to concerts, etc.
Income has Peaked but Elevated Saving Rate Could Maintain a Floor Under Spending
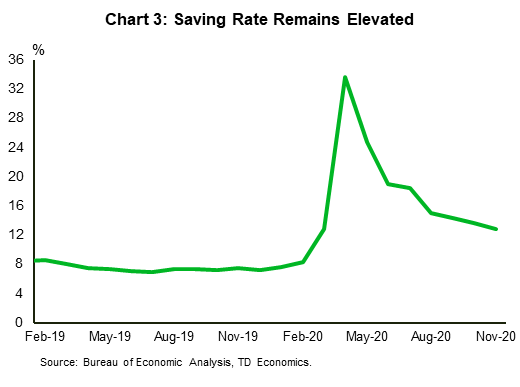
A key implication of this widening gap in income and spending is that many households have built up significant nest eggs. The personal saving rate remained elevated at 12.9% in November, down from an unprecedented 33.6% in April (Chart 3).
Still, these savings are not equally distributed across households. According to 2019 Survey of Consumer Finances, only 36.5% of families in the 20th percentile of income had liquid savings before the recession. This compared to 59.6% of the mid- and 85.2% of high-income families, respectively. Given that low-income families saved a smaller share of their stimulus payments (31.2%) relative to high-income families (40.8%), they also have a higher risk of running out of rainy-day funds and facing financial difficulties sooner than their more affluent neighbors.
Consumer Finances Show Few Signs of Stress
Thus far, there are few signs of financial hardship in consumer credit metrics. Household debt has increased, while delinquencies, foreclosures and bankruptcies remain historically low (although, auto and bankcard delinquencies have ticked higher since the summer). This is due to income supports, but also to forbearance programs. Specifically, the CARES act provides relief for federally or GSE-backed (Fannie Mae or Freddie Mac) mortgages and student loans, which account for 62% and 82% of their respective markets.
Families with mortgage debt can apply for a relief from mortgage payments for up to 360 days without additional fees, penalties or interest. Upon mortgage reinstatement, borrowers could establish a repayment plan instead of paying the forborne amount in a lump sum. The program expired on December 31st. As of December 13, 2.7 million loans (5.5% percent of all mortgages) remain in COVID-19-related forbearance plans.8
Payments on federally-backed student loans have also been suspended since March. Any voluntary payments processed before January 31, 2021 – the program deadline – are applied to principal, helping students pay down their loans faster. CARES mortgage and student loan forbearances must be reported as current to Credit Servicing Agencies.9 Although the new CRRSA Act does not extend existing forbearance programs, we may well see additional relief measures closer to the expiry date. For example, the U.S. Department of Education has already extended the federal student loans forbearance program three times.
Other personal credit products, such as auto loans or credit cards are not covered by the CARES Act, but some lenders have stepped in to offer deferred payment schemes or temporary reductions of interest and principal payments during the pandemic.
Households benefited from these programs in two major ways. First, deferred debt payments gave families breathing room to funnel these funds to other expenditures – such as groceries, paying down other credit balances, or socking the cash away for when payments are reinstated. This behavior was reinforced by the cash assistance programs noted above.
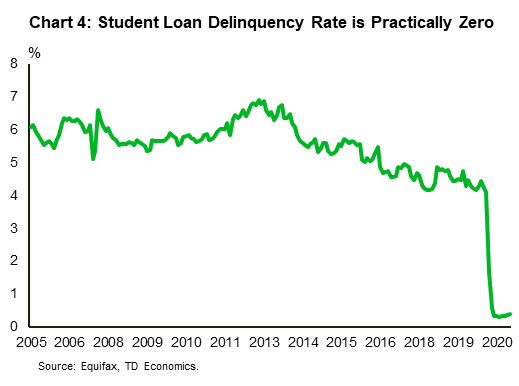
Secondly, forbearances helped improve households’ credit score by freezing derogatory reporting. For example, the student delinquency rate dropped from an average of 5.5% to 0.3% (practically zero), not what you would expect during a typical recession (Chart 4). Similar trends can be observed in delinquency and charge-off rates of other consumer credit products.
Consumer Net Worth Recovered
Another reason for the resilience of household finances was the strength of balance sheets going into the COVID-19 outbreak. By the end of 2019, household and non-profit organizations’ net worth reached a record high of $118.3 trillion – an 96% increase from the trough of the Global Financial Crisis (GFC). The decade-long wealth expansion was attributable to both house and equity price growth.
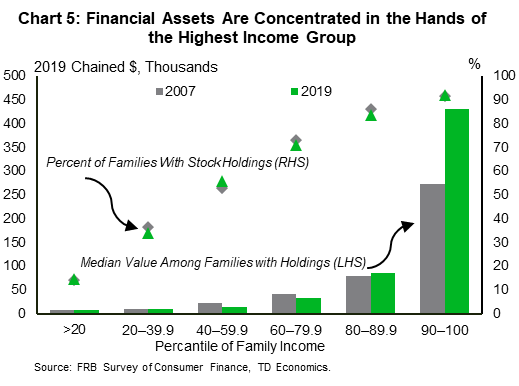
Still, similar to the savings story, there are wide disparities under the surface. While homeownership rates increased universally across income percentiles from 2016 to 2019, they remain below pre-GFC levels for all but the highest income cohort. The evolution of financial wealth distribution is even more striking. Financial assets are concentrated in the hands of the highest income group (Chart 5). This reflects systematic differences in portfolio composition over the past several decades and is likely to further exacerbate wealth inequality as households recover from the crisis.
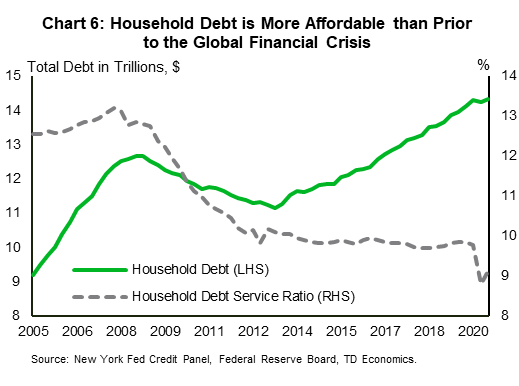
Relative to asset growth, debt accumulation has been modest even as it reached an all-time high of $14.1 trillion in early 2020. In real terms, by the end of February, household debt was five percent lower than its peak at the end of 2008, with mortgage debt 10% below its historical highs. Unlike the run up to 2008 housing crisis, recent debt growth was more affordable thanks to declining service costs, a function of both falling interest rates and rising personal disposable income (Chart 6). The debt-to income ratio tells a similar story. Even while rising to 129% in the third quarter (from 122%), it is still more than 11 points lower than the average over the past ten years.
As a result, in comparison to the GFC, American families were in a better financial position to face this recession. The 6% reduction in household wealth in the spring of 2020 was short-lived and has been more than made up in the months since. By the end of September, household and non-profit organizations’ net worth reached a new high of $124 trillion – up almost 8% from a year earlier. This was driven by an 8% year-on-year increase in financial assets, powered by a 13% jump in corporate equity. As in the past, gains are unequally distributed. According to the 2019 Survey of Consumer Finances, only 15.2% of Americans have direct ownership of individual stocks, while approximately 51% invest in the market through retirement accounts.
Delinquencies Likely to Pick Up as Support Programs End
A key question is whether the recent trend of low household delinquency rates can remain in place in the coming months. Pre-emptive policy intervention muted the relationship between default rates and macroeconomic variables such as the unemployment rate. Should measures expire while the unemployment rate is still elevated, credit delinquency is likely to increase.
According to a study conducted by the Federal Reserve of Richmond, the aggregate delinquency rate for three credit products – credit cards, student loans and mortgages – could rise from 2.3% in 2019 to 3.9% by 2025.10 In a “favorable scenario” (that mostly closely resembles the recovery we are currently experiencing) the aggregate delinquency rises more modestly, to 2.6%. The study concludes that the biggest reduction in delinquency rate is achieved by mortgage forbearance, then by student loan forbearance, and lastly by fiscal transfers.
The deterioration in credit quality is likely to hit lower income households hardest. According to the Census Bureau’s early-November Household Pulse Survey, 9.6% of households were not caught up on mortgage or rent and 13.8% expressed little or no confidence in their ability to pay next month’s payment.11 For households with incomes less than $35,000 per year the response was almost three times as high. This explains why the recent round of income supports is so important to mitigating downside financial risks.
Bottom Line
Ultimately, the trajectory of consumer finances will be determined by the depth and duration of the health crisis. The good news is that vaccines are already being distributed. By the summer, consumers may be able to return to pre-pandemic activities, accelerating the recovery in businesses operations, especially those most affected by social distancing. This normalization should in turn secure a return of employment and personal income stability.
In the meantime, the signing of CRRSA Act on December 27 is a delayed Christmas miracle for many American families. The package provides a new round of direct payments and an extension of unemployment benefits until March 14, as well as additional relief measures that support low-income families by providing funding to food support services, childcare and rental assistance, and grants for businesses in low income communities. These supports should go a long way to avoiding a rise in credit delinquencies and financial hardship among those most directly impacted by the pandemic. Nonetheless, the economy will remain vulnerable to setbacks. Policy makers should continue to keep abreast of the latest data and be ready to implement timely and adequate support until the crisis is firmly in the rear-view mirror.
End Notes
- Under the Coronavirus Response and Relief Supplemental Appropriations (CRRSA) Act of 2021
- The first round of EIP is generally $1,200 per adult, and $500 per child, progressively phased out for higher income households. Payment reductions of $5 per $100 of adjusted gross income over $75,000 for single, childless adults, $112,500 for single adults with children and $150,000 for couples. Final figures will be reported after November 21st – the registration deadline for those who have not yet received their payment yet.
- For more information see: https://www.irs.gov/newsroom/treasury-and-irs-begin-delivering-second-round-of-economic-impact-payments-to-millions-of-americans
- As of November 2020, approximately 74% (or $282 billion) was allocated through the Pandemic Unemployment Compensation Payments (PUC), 20% (or just over $74 billion) was sent through Pandemic Unemployment Assistance (PUA) and 6% (or approximately $24 billion) was provided by the Pandemic Emergency Unemployment Compensation (PEUC). Additionally, the Lost Wages Assistance (LWA) program, signed by President Trump approximately $35 billion in unemployment support once the PUC expired in July.
- Neil Bhutta, Jacqueline Blair, Lisa Dettling, and Kevin Moore. 2020. “COVID-19, the CARES Act, and Families’ Financial Security” National Tax Journal 73(3): 645-672
- For more information see: https://www.brookings.edu/wp-content/uploads/2020/06/Cox-et-al-conference-draft.pdf
- For more information see: https://libertystreeteconomics.newyorkfed.org/2020/10/how-have-households-used-their-stimulus-payments-and-how-would-they-spend-the-next.html
- For more information see: https://www.mba.org/2020-press-releases/december/share-of-mortgage-loans-in-forbearance-remains-flat-at-554-percent
- To be reported as current, mortgages past-due must be brought up to date before entering the forbearance program. Student loans are reported current irrespective of their pre-forbearance status.
- In the baseline scenario the peak unemployment reaches 20% lasting 4 quarters, with medium recovery, average individual unemployment duration 30 weeks. In the favorable scenario, peak unemployment is 10% lasting 2 quarters, with fast recovery, average individual unemployment duration 20 weeks. See https://www.richmondfed.org/-/media/richmondfedorg/publications/research/working_papers/2020/wp20-02.pdf
- Household Pulse Survey (HPS) is an experimental survey collecting information on how the coronavirus pandemic is impacting households across the country. https://www.census.gov/data/tables/2020/demo/hhp/hhp18.html
Disclaimer
This report is provided by TD Economics. It is for informational and educational purposes only as of the date of writing, and may not be appropriate for other purposes. The views and opinions expressed may change at any time based on market or other conditions and may not come to pass. This material is not intended to be relied upon as investment advice or recommendations, does not constitute a solicitation to buy or sell securities and should not be considered specific legal, investment or tax advice. The report does not provide material information about the business and affairs of TD Bank Group and the members of TD Economics are not spokespersons for TD Bank Group with respect to its business and affairs. The information contained in this report has been drawn from sources believed to be reliable, but is not guaranteed to be accurate or complete. This report contains economic analysis and views, including about future economic and financial markets performance. These are based on certain assumptions and other factors, and are subject to inherent risks and uncertainties. The actual outcome may be materially different. The Toronto-Dominion Bank and its affiliates and related entities that comprise the TD Bank Group are not liable for any errors or omissions in the information, analysis or views contained in this report, or for any loss or damage suffered.
Download
Share: