Commodities Quick-Take
Marc Ercolao, Economist | 416-983-0686
Date Published: May 12, 2026
- Category:
- Canada
- Forecasts
- Commodities & Industry
Highlights
- Energy markets have diverged sharply. Crude oil prices remain elevated amid persistent supply disruptions related to the U.S-Iran conflict. Meanwhile, North American natural gas prices are comparatively subdued despite global LNG tightness.
- Base metals are finding a floor despite macro headwinds. Uneven global demand and restrictive financial conditions are being offset by increasingly binding supply constraints, particularly for copper and aluminum, helping keep prices on the firm side into 2026.
- Gold’s rally has paused as higher real rates cap upside, but ongoing geopolitical risks and solid central‑bank demand should provide downside support. Silver prices should roughly follow suit.
- Ample grain inventories are limiting near‑term wheat price gains, but fertilizer disruptions, weather risks, and easing trade frictions for canola skew medium‑term risks modestly higher.
- Lumber markets remain range‑bound. Soft U.S. housing activity is restraining demand, while structural supply reductions and ongoing trade barriers are helping put a floor under prices.
Crude Oil – Conflict Continues to Reshape Price Path
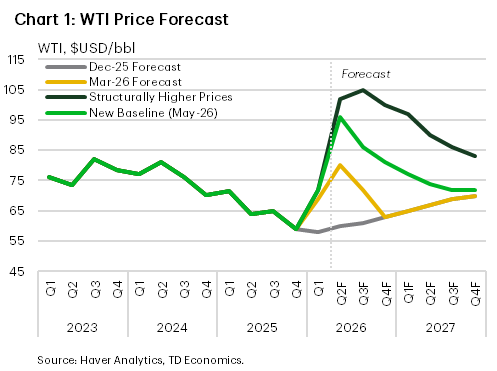
The U.S.–Iran conflict has sent shock waves through energy markets, resulting in one of the biggest supply shocks to crude oil markets on record. Since the start of the war, the WTI benchmark price has risen by over 40%. Volatility also remains elevated as headlines around escalation, ceasefire discussions, and maritime security in the Strait of Hormuz continue to whipsaw market sentiment. While the recently announced U.S.-Iran memorandum of understanding modestly increases the probability of near term de-escalation, markets remain unconvinced that any normalization of oil supply will be swift.
Our updated oil price forecast assumes that de-escalation efforts ultimately work to cap upside risks, but that supply disruptions persist for several months even if traffic through the Strait resumes as early as May. Under this baseline, crude prices are expected to average around $96/bbl in the second quarter, before easing gradually toward $80/bbl by year end (see forecast table at the end of the report). Further out, prices are likely to continue drifting lower into 2027 as supply builds and demand growth cools.
This profile reflects the view that normalization will be gradual rather than immediate. Even with a partial resumption of traffic, heavy backlogs, damaged infrastructure, and operational lags are expected to constrain exports for an extended period. Strategic stock releases have helped cushion the initial shock but remain temporary and insufficient to fully offset lost Middle Eastern volumes. Elsewhere, non OPEC supply continues to edge higher and spare capacity exists within OPEC+, yet markets remain focused less on headline capacity and more on the timing and credibility of barrels actually returning to market, keeping risk premiums elevated in the near-term.
At the same time, higher prices are beginning to affect demand. Early signs of lower demand are emerging, particularly outside North America, and are most evident in more price sensitive segments such as jet fuel, diesel, and petrochemical feedstocks, with Asia showing the clearest signs of strain. In fact, both the IEA and EIA have lowered their 2026 global oil demand growth forecasts, suggesting this shock is permeating beyond the supply side.
For Canada, elevated global oil prices remain broadly supportive for near term growth, with WCS prices rising alongside WTI. Though the discount has widened slightly due surging WTI prices, it remains roughly within historical norms. Stronger outright prices are boosting corporate profits and incomes across the energy sector, providing a cushion as momentum elsewhere in the economy softens. Governments are poised to benefit, with federal and provincial coffers likely to see notable revenue windfalls from higher royalties and tax receipts. Canada is well positioned, as improved export capacity increases access to global markets amid heightened demand for secure supply. While spare capacity is limited, producers have scope to incrementally lift output and exports, allowing Canada to help fill part of the global supply gap.
Natural Gas – A Tale of Two Markets
U.S. natural gas prices have remained calm amid the U.S.-Iran conflict. Henry Hub prices have drifted modestly lower in recent weeks to ~2.80/MMBtu despite heightened volatility across the broader global energy markets. We expect Henry Hub prices to average around $3.60/MMBtu in 2026. With North American markets well supplied and limited LNG export capacity, there is little price upside anticipated for 2027.

U.S. production continues to trend higher, supported by solid shale output and rising associated gas volumes from oil directed drilling, particularly in the Permian Basin. According to the EIA’s April 2026 Short Term Energy Outlook, production is expected to rise by roughly 2% in 2026, extending last year’s gains. Combined with relatively mild winter weather, this has left inventories in a comfortable position. Working gas storage also ended the 2025–26 withdrawal season about 3% above the five year average, and injections through the summer are expected to rebuild inventories toward the upper end of historical ranges. U.S. LNG terminals are already operating near capacity, which will limit increases in U.S. exports in the near term, preventing global disruptions from materially tightening domestic balances.
Natural gas markets outside North America tell a different story. Global markets have been affected primarily through disruptions to Qatari LNG exports, which normally account for roughly one fifth of globally traded LNG. Damage at key facilities and lingering maritime risks have persistently constrained flows, pushing Asian spot prices higher and reducing flexibility for Europe ahead of the storage refill season. European benchmark (TTF) has also risen sharply, albeit remaining well below 2022 peaks. Elevated spreads between Henry Hub and international benchmarks are likely to persist until global LNG supply chains normalize.
Base Metals – Supply Constraints Limit Downside Despite Macro Headwinds
Base metals prices have stabilized after bouts of volatility earlier in the year, reflecting a balance between uneven global demand and increasingly constrained supply. While growth concerns, particularly across advanced economies, continue to weigh on cyclical demand, supply-side limitations are providing a meaningful floor for several key metals as the cycle extends into 2026.
Demand conditions remain mixed. China continues to anchor global metals consumption, but the recovery there remains uneven, with persistent property sector weakness offsetting strength tied to grid investment, manufacturing upgrades, and clean energy deployment. Elsewhere, restrictive financial conditions have tempered construction activity and capital spending in North America and Europe. Looking ahead, expectations for easing financial conditions should help prevent a renewed deterioration in demand, though a sharp rebound appears unlikely.
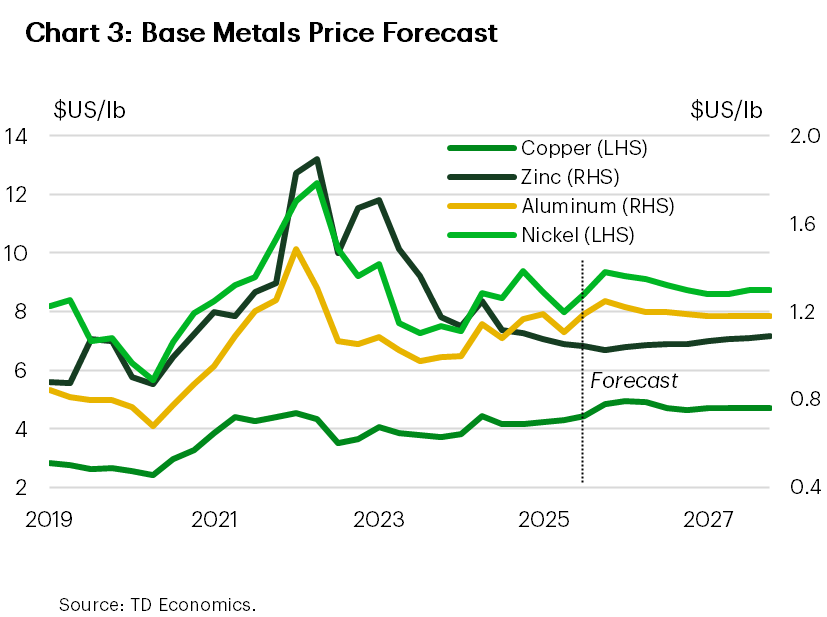
Against this backdrop, supply dynamics remain the more decisive driver, particularly for copper. Ongoing mine disruptions and long development timelines continue to constrain supply growth. As a result, copper markets remain structurally tight, even with modest demand growth. Near-term macro shocks could keep copper prices uneven, before supply constraints provide firmer support next year.
Aluminum markets are also being underpinned by supply discipline. China’s production remains constrained by environmental and capacity limits, while elevated energy costs continue to restrict the full restart of idled smelting capacity in other regions. These constraints should help keep aluminum prices firm, with any easing likely to be gradual as supply responds slowly.
Recent impacts from the U.S.–Iran conflict are having some, albeit limited, implications for base metal supply. Nonetheless, it remains an important macro risk. A sustained energy price shock that lifts inflation expectations and keeps interest rates restrictive would likely weigh on cyclical metals through weaker industrial demand and higher carry costs. In such an environment, base metals have historically underperformed. At the same time, higher energy prices reinforce supply discipline, particularly for energy intensive metals such as aluminum, and raise the likelihood that any price weakness proves temporary rather than structural.
Elsewhere, the outlook across the complex is more mixed. Zinc prices have rebounded from earlier lows but face headwinds from softer manufacturing demand and improving mine supply. Nickel markets have shifted more bullish as key producer Indonesia deliberately tightened supply in late-2025. Prices have reset higher in 2026 and are likely to stay supported even in the absence of a strong demand impulse.
Precious Metals – Geopolitics Meets Rates Rally
After rallying to record highs near US$5,500/oz in late January, gold prices have retraced about 15%, as higher-for-longer rate expectations and a stronger U.S. dollar outweighed safe-haven demand. While the escalation of the Middle East conflict initially supported prices, the dominant driver has been the policy response to rising inflation risks. Energy related supply shocks linked to the war have pushed markets to dial back expectations for Fed easing, lifting real yields and increasing the opportunity cost of holding assets like gold. This distinction helps explain recent price consolidation. Although gold typically benefits from higher inflation, its upside is limited when central banks actively lean against inflation through restrictive policy and elevated real rates.
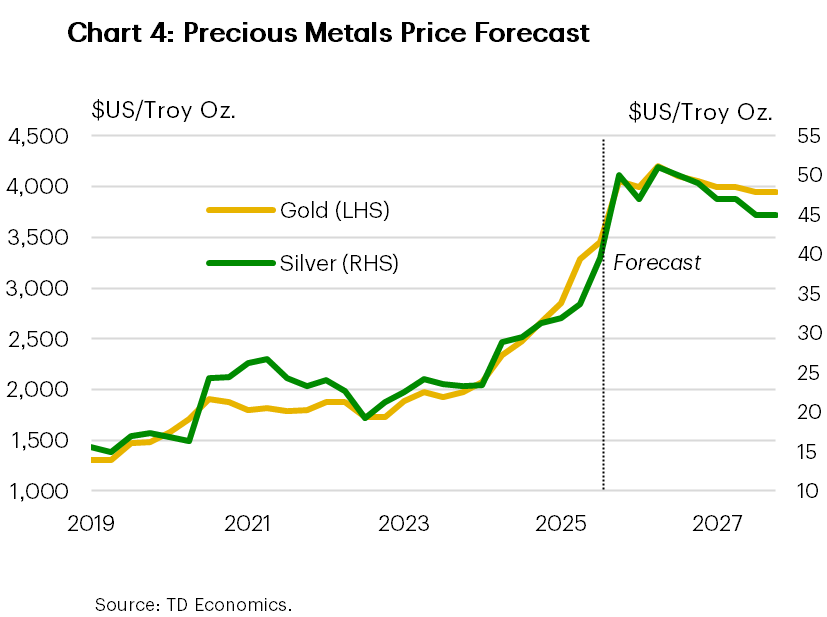
That said, gold continues to benefit from solid structural support. While the pace of central bank purchases has cooled from recent peaks, buying remains historically elevated and broadly based, providing a durable downside buffer to prices. Looking ahead, we expect gold to gradually firm in the second half of the year as crisis conditions stabilize, inflation signals soften, and the U.S. dollar loses momentum. Consistent with this view, gold is expected to average $4,800/oz over the coming quarters.
Silver has broadly mirrored gold’s direction, but with greater volatility, reflecting its dual role as both a precious and industrial metal. On the supply side, physical markets remain tight, with mine output constrained, extending a multi year structural deficit. However, silver’s heavier exposure to global growth – with industrial uses accounting for roughly half of demand – has left prices more sensitive to shifts in rate expectations and macro sentiment.
While higher energy prices and inflation uncertainty offer some indirect support, tighter financial conditions risk weighing on industrial demand, limiting silver’s upside relative to gold. As a result, we expect silver prices to broadly track gold over the forecast horizon, but with wider swings, depending on the balance between industrial demand resilience and evolving monetary policy expectations.
Agriculture – Risks Tilting Higher
Wheat futures have pushed higher in 2026 following a largely disappointing performance last year. Recall, global production surged in 2025, with major harvests in the EU, Russia, Canada, and South America pushing stocks to multi year highs and pressuring markets with abundant supply. The recent price increase, which at roughly $6.20/bushel, is near a two-year high, comes as futures markets incorporate risk to supplies related to the U.S.-Iran conflict. Combined with poor growing conditions in the U.S., we expect wheat prices to grind higher over the coming quarters, reaching $6.50/bushel by year-end.

The conflict has materially tightened global fertilizer markets, with 30–40% of urea and ammonia transiting the Strait of Hormuz. Given fertilizers’ central role in crop production, sustained disruptions raise the risk of lower yields and higher global food prices. This may not have an immediate effect in 2026 as fertilizer inputs were largely secured earlier, but sustained cost pressures could weigh on next year’s yields, adding upward pressure to wheat prices with a lag.
What’s more, U.S. winter wheat conditions have deteriorated across parts of the Southern and Central Plains, with persistent dryness also threatening next year’s output. In combination with higher fertilizer and energy costs linked to the war, these factors skew medium-term risks to the upside. For now, healthy global wheat stock levels are sufficient enough to prevent a rapid rally in prices.
The canola outlook is also firmer compared to our prior outlook. Recent reductions in Chinese tariffs on Canadian canola seed and meal have eased a key demand headwind, while production is expected to edge modestly lower as yields normalize. Biofuel demand also remains a supportive medium term factor, underpinning canola oil consumption and providing a structural floor for prices. Taken together, these forces should help canola prices broadly keep pace with grains over the forecast horizon, averaging CAD$750/tonne in 2026, though elevated global oilseed supplies and lingering trade uncertainty are likely to cap upside.
Lumber – No Boom, No Bust
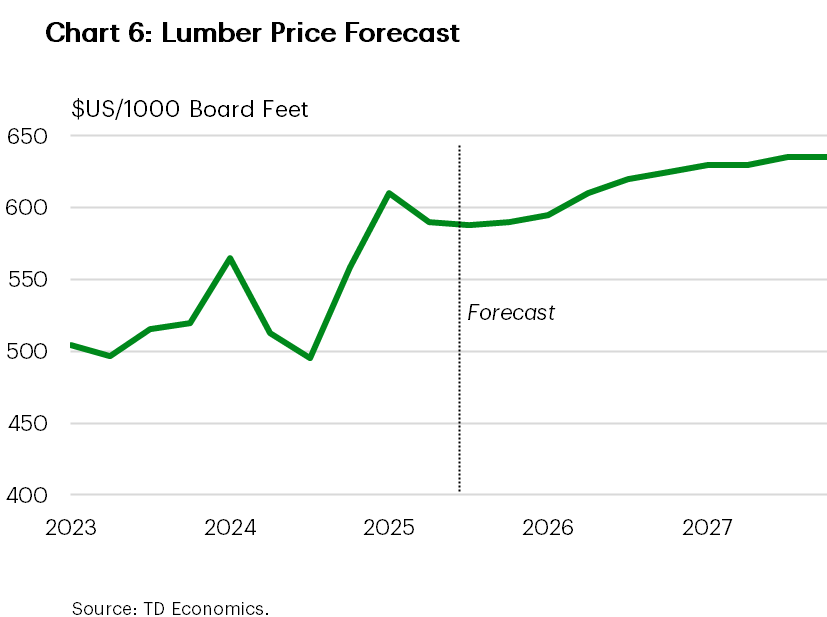
Lumber futures have rebounded modestly from late-2025 lows to $575/thousand board feet (tbf) but continue to trade well below pandemic-era peaks. Lumber markets appear to be stabilizing, and upside over the next 12–24 months is limited by subdued housing activity in the U.S.. While headline housing starts have jumped in recent months, single family construction – the most lumber intensive segment – remains under pressure amid elevated mortgage rates and weak affordability. As such, demand-side tailwinds look limited in the near-term.
At the same time, the supply backdrop has tightened meaningfully. Sawmill curtailments and permanent closures across Western Canada and parts of the U.S. have reduced effective North American capacity, leaving the industry less able to respond to even modest demand improvements. This structural shift will help put a floor under prices, particularly during seasonal construction upswings.
Trade policy remains a key swing factor for the price outlook. While U.S. authorities preliminarily reduced combined anti‑dumping and countervailing duties on Canadian softwood lumber from 35% to roughly 25%, the continued application of Section 232 tariffs keeps the effective border cost near 35% through at least August 2026. As a result, uncertainty around market access is likely to persist, limiting cross‑border flows and reinforcing elevated marginal costs across the North American supply chain.
Putting it together, our quarterly price profile assumes lumber futures remain broadly range‑bound around current levels, averaging roughly $600/tbf through 2026, before firming modestly into 2027 as housing activity gradually improves. Any sustained upside is likely contingent on a clearer rebound in single family construction or further tariff relief, developments that currently look more plausible in 2027 rather than this year.
Forecast Table |
|---|
| Commodity Price Outlook |
Disclaimer
This report is provided by TD Economics. It is for informational and educational purposes only as of the date of writing, and may not be appropriate for other purposes. The views and opinions expressed may change at any time based on market or other conditions and may not come to pass. This material is not intended to be relied upon as investment advice or recommendations, does not constitute a solicitation to buy or sell securities and should not be considered specific legal, investment or tax advice. The report does not provide material information about the business and affairs of TD Bank Group and the members of TD Economics are not spokespersons for TD Bank Group with respect to its business and affairs. The information contained in this report has been drawn from sources believed to be reliable, but is not guaranteed to be accurate or complete. This report contains economic analysis and views, including about future economic and financial markets performance. These are based on certain assumptions and other factors, and are subject to inherent risks and uncertainties. The actual outcome may be materially different. The Toronto-Dominion Bank and its affiliates and related entities that comprise the TD Bank Group are not liable for any errors or omissions in the information, analysis or views contained in this report, or for any loss or damage suffered.
Download
Share: