Will the U.S. Economy Ride the Blue Wave?
Leslie Preston, Director & Senior Economist | 416-983-7053
Date Published: January 19, 2021
- Category:
- U.S.
- Forecasts
- Government Finance and Policy
Highlights
- Since we published our last forecast there have been positive and negative developments in the U.S. economy, which on net have led to an upgrade to our forecast.
- A worsening in the pandemic saw activity fall more than we expected at the end of last year. At the same time Congress passed a $900 billion relief package, larger than what was assumed in our forecast.
- On top of these developments, a slim Democratic majority in the Senate increases the likelihood of substantially more fiscal relief this year. The degree of upside is highly uncertain, so we estimate a range of scenarios and their growth implications.
A lot has changed in the month since we published our forecast in December. The pandemic has worsened, and vaccine rollout has arguably not been as quick as we had hoped. Fortunately, Washington passed the $900 billion Coronavirus Relief & Recovery Supplemental Appropriations Act (CRRSA Act), which extends a lifeline to many out-of-work Americans and struggling businesses and has resulted in an upward revision to baseline growth in 2021. Overall, federal Covid-19 relief passed thus far has cost roughly $3.4 trillion, or about 16% of nominal GDP – an unprecedented response to a once-in-a-lifetime health crisis. Now that Democrats have won a fingertip hold on a Congressional majority, the Biden administration plans to add further assistance, and has a greater ability to implement its campaign priorities. Ultimately, what they can achieve is, as always, contingent on negotiations in Congress, but the probability has shifted enough that a more systematic analysis is due.
Ever since the Democrats won the Georgia Senate runoff elections on January 5th, markets have moved to price in faster growth and higher inflation due to expectations for a dramatic increase in fiscal assistance. Last Thursday, President-Elect Biden announced his first plan to help get the economy back on its feet and help bring the Covid-19 pandemic to an end. The American Rescue Plan totals $1.9 trillion dollars and includes direct assistance for households, spending to deal with the health crisis and funding for businesses, state and local governments to help cope with the ongoing hit to revenue from the pandemic (see Table 1 for a summary of key elements).
Table 1: Summary of Biden's American Rescue Plan
| Category | Amount ($, bn) |
|---|---|
| Direct Aid to Families | 1,000 |
| Direct payments of $1400/person who qualifies | 465 |
| Unemployment benefits ($400/week to Sept.) | 350 |
| Various including: rental & utility assistance, SNAP, larger child & earned income tax credits, child care | |
| Tackle Covid Crisis | 400 |
| Vaccination, testing, health care workers & paid leave | |
| Re-open Schools & Higher Education | 170 |
| Small Businesses, local communities and transit systems | 440 |
| State and local governments | 350 |
| Total | 1,840 |
President-Elect Biden has indicated that this is the first phase of his policy agenda. The second is expected later this year and would seek to implement more of his campaign commitments, such as funding for green infrastructure, higher education and health care. This would also likely include tax increases on higher income Americans and corporations to help offset the costs. (For more details on Biden’s election platform, see our earlier report). The details of this second phase are more uncertain and will likely depend on the course of the economy, the pandemic and how receptive Congress is.
In the meantime, the American Rescue Plan presents a material upside risk to our forecast for economic growth released in December. However, the degree of upside is highly uncertain. Democrats only have the narrowest majority in the Senate. They will need support from Democrat and Republican Senators to get the 60 votes required to avoid a filibuster. So far, some aspects of the plan – most notably the $1,400 checks to all modest income Americans – have proved less popular. It seems almost a foregone conclusion that the package will end up being negotiated down before it is passed.
Given the uncertainty, we have estimated the impact of three potential policy scenarios on our baseline forecast. The scenarios are as follows:
- Scenario 1 is the full $1.9 trillion plan as laid out last Thursday.
- Scenario 2 cuts the package roughly in half to $1.0 trillion. It excludes the $1,400 direct checks, reduces the amount of government spending and transfers to state and local governments are cut about in half.
- Scenario 3 amounts to $500 billion. It makes the emergency unemployment benefits slightly less generous, further reduces federal spending to combat Covid-19 and state and local governments receive very little funding.
$900 Billion Year-end Relief Bill Boosted Baseline Forecast
The CRSSA Act signed into law over the holidays was larger than we had assumed in our December forecast. Passage was highly uncertain at the time of our forecast, and, as such, we had assumed a $400 billion package. As a result, even before we estimate the potential upside risk to the outlook from the Biden plan, the baseline forecast has been upgraded to incorporate the extra spending.
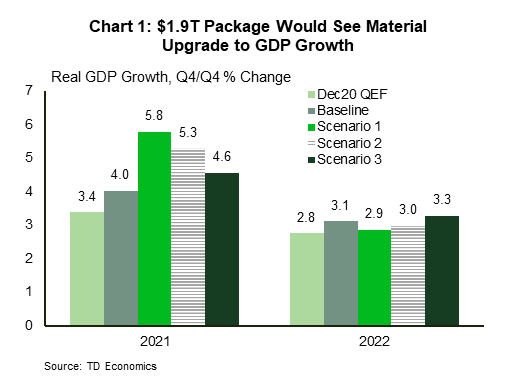
Partially offsetting the full impact of the CRRSA Act, economic activity slowed more than we had expected through the end of the year, reducing growth in the fourth quarter of 2020 and first quarter of 2021, before the impact of the CRRSA was added (Chart 1). On net, baseline real GDP growth is now expected to be 4% this year (on a Q4/Q4 basis), 0.6 percentage points higher than projected in December, even before we consider the upside risk from a potential American Rescue Act.
Assumptions Matter For Impacts, And Are Uncertain
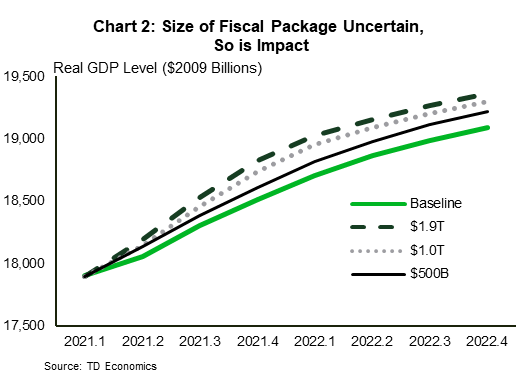
At this stage it is highly uncertain what elements of the Biden plan will see the light of day. As such, we have modelled top-line real GDP projections under three alternative scenarios (Charts 1 and 2). How much the various fiscal scenarios lift economic growth depends critically on various underlying assumptions. For example, in scenario 1, the economic impact of the $1,400 checks is determined by how much of the money is spent versus saved. It assumes that the checks are issued in Q2 2021, but are saved to a high degree, and the saving rate spikes in the quarter. The saving rate gradually returns to the baseline level by the end of 2022. How much consumers will spend is highly uncertain and depends on consumer confidence and the course of the pandemic. Ongoing restrictions and pandemic concerns could limit households’ desire and ability to spend.
All scenario results are influenced by how quickly the government spending measures roll out. We assume the package is passed in March, but that the peak spending occurs in the third quarter of 2021, and then tapers back to baseline spending by the end of 2022. Government spending will likely take a bit longer to ramp up than direct payments to individuals. This assumption may prove optimistic, however, given much of the funding is to ramp up the health response to the pandemic, spending could flow quickly.
The large $1.9 trillion package lifts growth by 1.8 percentage points in 2021 to an impressive 5.8%. Growth is lower than baseline in 2022, since activity is growing off a much higher base. This produces a so-called “fiscal cliff” next year, but note that real GDP still ends the year roughly 1.4 percentage points above the level assumed in the updated baseline. There is a similar phenomenon in the $1.0 trillion scenario. The $1.0 trillion package lifts growth by 1.3 percentage points in 2021 to 5.3%, and the $500 billion package by half a percentage point. And while growth will slow next year, projected output levels are still 1.1 and 0.7 percentage points above baseline respectively in Q4 2022.
These forecasts for 2022 carry more uncertainty. If the administration can pass another package of longer-term spending and tax hikes later in 2021, this will likely have a major impact on projected growth trends in 2022 and beyond. The impact will depend on the nature of the spending and tax increases.
Faster growth due to Biden’s American Rescue plan would lead to stronger employment growth, and likely a lower unemployment rate than would otherwise be the case. However, the level of the unemployment rate is even more uncertain as it depends on how labor force participation responds. Over the course of the pandemic, the labor force has shrunk by 3.9 million people. To be counted in the labor force you need to be actively looking for work, and understandably during the pandemic, this has been more difficult than in a typical recession for various reasons. The drop in the labor force has led to the unemployment rate falling faster than employment growth alone would imply. It is highly uncertain how quickly people will re-join the labor force, and what affect the various fiscal scenarios will have on participation.
Nevertheless, the substantial upgrade to the growth outlook – especially under Scenarios 1 and 2 –would yield reduced economic slack and likely stronger inflationary pressures than in our baseline forecast. This would have implications for monetary policy and could lead to the Federal Reserve tapering its current asset purchases earlier than currently expected (see recent FOMC minutes). However, the Fed has communicated that it won’t respond to signs of inflationary pressures in the same way as in the past. It will need more evidence of a fulsome recovery before it eases its foot off the accelerator. Our current forecast expects the Fed to remain on hold until 2024. If all these fiscal measures come to pass and the recovery continues without a hitch, the timing on that may need to be moved up by a couple of quarters. Bond yields have already moved to price in higher inflation driven by more expansionary fiscal policy. This could limit any additional increases once the size of the program is ultimately decided, and could result in disappointment, if the relief package ends up being on the smaller side.
These scenarios illustrate the range of possible economic impacts depending on what Congress may plausibly agree to. It is very early days, and it remains unclear what Republican Senators will support. We think it is most likely an eventual package could be somewhere between scenarios 2 and 3, or $500 billion and $1 trillion. President-elect Biden has indicated a preference for working on a bipartisan basis, but if GOP Senators are not open to negotiation, Democrats could choose to use the budget reconciliation process, as the GOP did for the Tax Cuts and Jobs Act in 2017. They can only use this once per fiscal year, and it would likely delay when the next round of relief would get passed.
Disclaimer
This report is provided by TD Economics. It is for informational and educational purposes only as of the date of writing, and may not be appropriate for other purposes. The views and opinions expressed may change at any time based on market or other conditions and may not come to pass. This material is not intended to be relied upon as investment advice or recommendations, does not constitute a solicitation to buy or sell securities and should not be considered specific legal, investment or tax advice. The report does not provide material information about the business and affairs of TD Bank Group and the members of TD Economics are not spokespersons for TD Bank Group with respect to its business and affairs. The information contained in this report has been drawn from sources believed to be reliable, but is not guaranteed to be accurate or complete. This report contains economic analysis and views, including about future economic and financial markets performance. These are based on certain assumptions and other factors, and are subject to inherent risks and uncertainties. The actual outcome may be materially different. The Toronto-Dominion Bank and its affiliates and related entities that comprise the TD Bank Group are not liable for any errors or omissions in the information, analysis or views contained in this report, or for any loss or damage suffered.
Download
Share: