Questions
- Given the delay of official data releases, what does private sector data tells us about the recent labor market performance?
- Is the labor market slowdown demand or supply driven?
- Is AI restraining hiring?
- Is the employment slowdown broad-based or is it limited to a particular sector?
- What does the recent labor market performance mean for the Fed?
Multiple influences have shaped the U.S. job labor market this year. The following Q&A summarizes major changes and addresses key questions.
Given the delay of official data releases, what does private sector data tells us about the recent labor market performance?
- After a long hiatus due to the government shutdown, official labor market data has begun to trickle in. So far, September’s payroll report has been released, as well as data on jobless claims through November 8th. September payrolls rose by 119,000—the strongest reading since April and a significant improvement relative to the average monthly gain of 18,000 over the prior three months. However, several factors are tempering the optimism: negative revisions to previous months, the narrow concentration of job gains, and the uptick in the unemployment rate, which rose to a new cyclical high. The conflicting signals suggests that (at best) the labor market has continued to move sideways through November.
- Even as reporting has restarted, data backlogs are expected to persist in the near term as statistical agencies continue to catch up. October payrolls will be released with November’s figures on December 16th. However, October’s household survey—which reports the unemployment rate—is not going to be published at all. In the meantime, alternative labor market data will continue to fill the void.
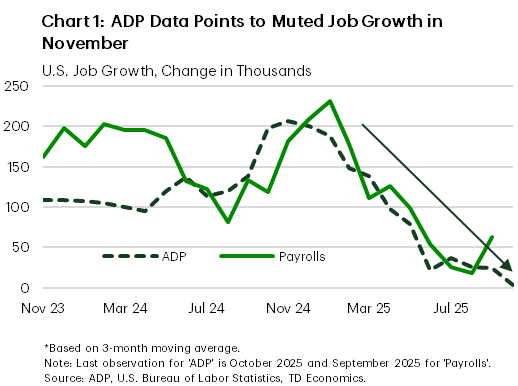
- The ADP private payrolls report is just one metric market analysts have been following. According to ADP, hiring picked up in October but remained modest, with employment rising by 42,000. It is worth noting that while ADP and payroll job performance have been closely aligned on a three-month moving average so far this year, the two surveys diverged somewhat in September (Chart 1). It is also important to note that ADP data does not account for government employment. Federal hiring is expected to decline significantly in October, as DOGE buyouts and impacts from the government shutdown are likely to exert a meaningful drag.
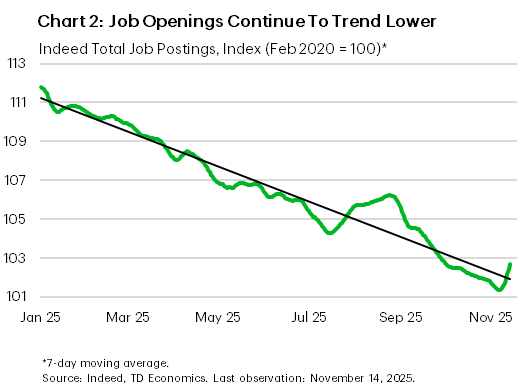
- The September Job Opening and Labor Turnover Survey (JOLTS) report is expected to be released with the November figures, though the new release date has yet to be announced. In the absence of JOLTS data, Indeed job postings have helped to fill the gap. They have shown a continued cooling in labor demand in recent months, which has been part of larger trend playing out over the past few years. However, there has been nothing in the data to suggest that the rate of decline in job postings has accelerated in recent months (Chart 2). In fact, in more recent weeks, openings have turned higher.
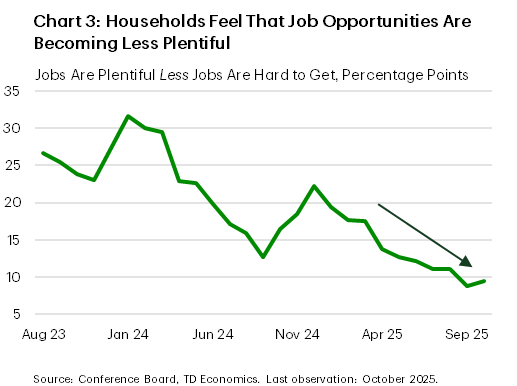
- The recent softening in labor market conditions is being internalized by households, with consumer confidence surveys showing an increasing number of Americans feeling pessimistic about employment prospects. In the Conference Board’s Consumer Confidence Survey, the spread between the share of respondents saying that jobs are plentiful versus hard to get sits near its lowest level since 2017 (outside of the pandemic) (Chart 3). In the University of Michigan Consumer Confidence survey, 64% of respondents expected the unemployment rate to be higher in the year ahead. This is up from 57% in July, and currently sits near levels not reached since the Great Recession.
- The downbeat consumer sentiment most likely reflects the direction and not necessarily the magnitude of the expected deterioration in joblessness next year. While the jobless rate rose to 4.4% in September – a cyclical high – it’s still low by historical standards. This is further corroborated by the fact that both initial and continuing jobless claims remained relatively low and range-bound through early November, even though the duration of unemployment has been trending higher.
- The bottom line is that the labor market performance doesn’t appear to have materially shifted since the Fed’s last meeting on October 28-29.
Is the labor market slowdown demand or supply driven?
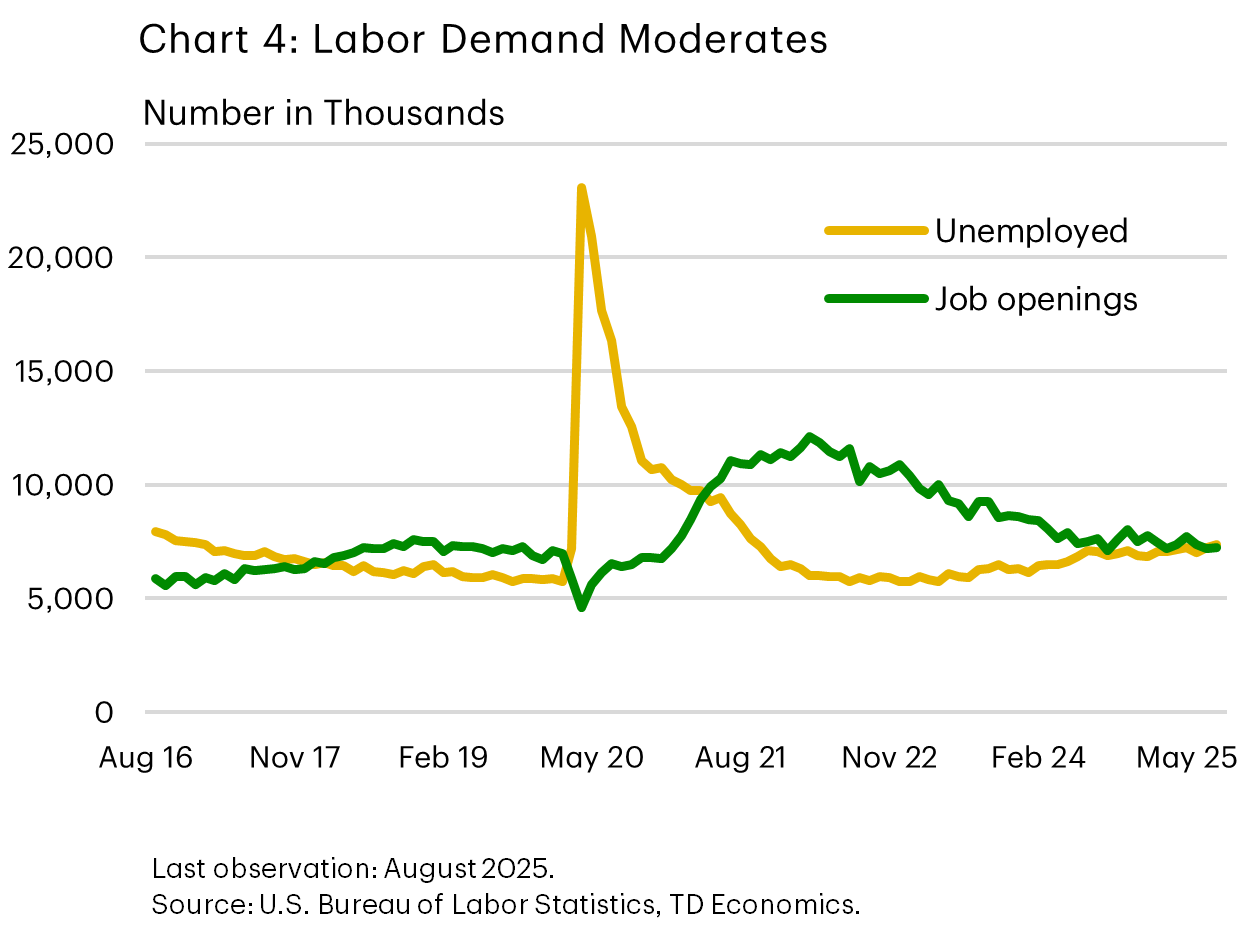
Both demand and supply factors are having an influence on the labor market. There is no doubt that demand for labor has cooled. This is evident in declining job openings – with the number of openings exceeding the number of unemployed actively looking for a job (Chart 4). However, a drop in labor supply – as a result of a significant tightening in immigration – is also working to restrain job growth. Labor force growth has slowed notably this year (Chart 5). Sectors such as hospitality, agriculture, construction, and manufacturing—which often rely more heavily on immigrant workers—have noted pressures on labor availability, as reported in several Federal Reserve district Beige Book summaries.1
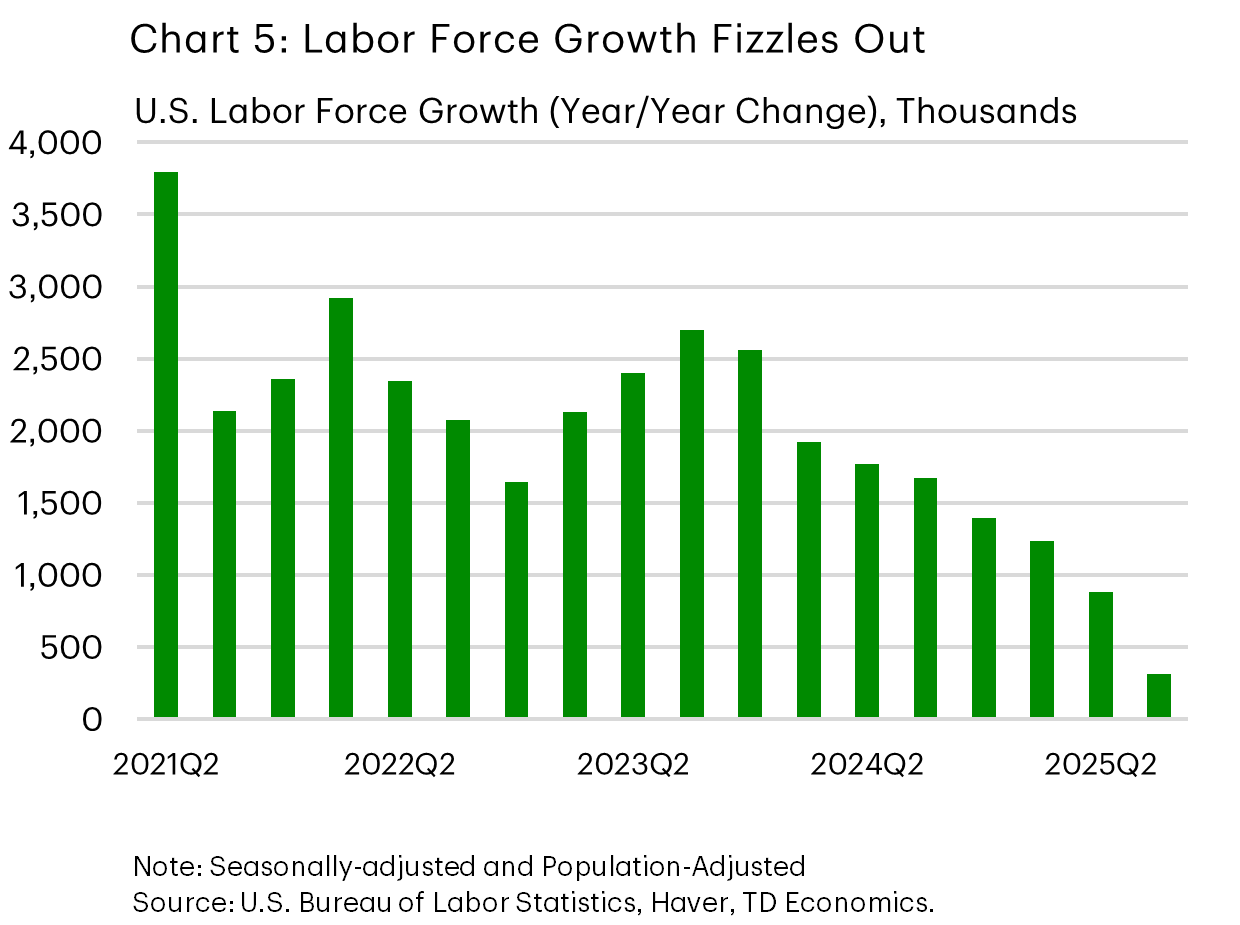
Due to the opposing forces on labor demand and supply, the unemployment rate has risen only slightly this year, even as job growth reached a near stall speed in the summer. The immigration-induced slowdown in labor force growth means that the economy needs to add far fewer jobs relative to prior years in order to hold the unemployment rate steady. We estimate that today’s ‘breakeven’ rate is around 45,000 jobs per month. Should immigration continue to slow into next year, the breakeven would fall even further – potentially as low as 30k.
All in all, a shrinking labor supply is masking weakness in the job market. Trends such as declining job openings, fewer quits and hires, and slowing wage growth all point to softer underlying demand. With the threshold for breakeven job growth now lower, sluggish hiring is less troubling than it would be if the labor force were expanding more rapidly.
Is AI restraining hiring?
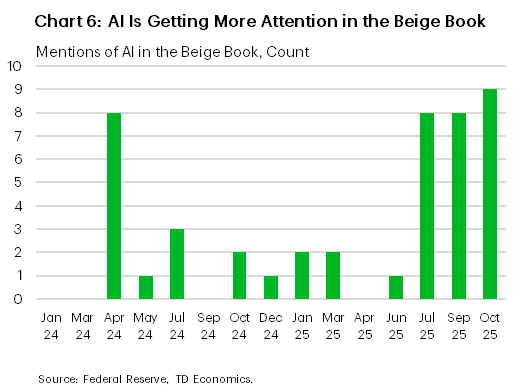
The potential impact of generative AI technologies on firms’ hiring decisions has been garnering lots of attention lately. While these are still early days for AI, adoption by businesses has been rising alongside expectations of AI-driven efficiencies. This is supported by anecdotal evidence from the Fed’s Beige Book (Chart 6) and academic research, which suggests that Generative AI technology is reshaping the U.S. labor market and is at least partially responsible for the softening in labor demand.2,3
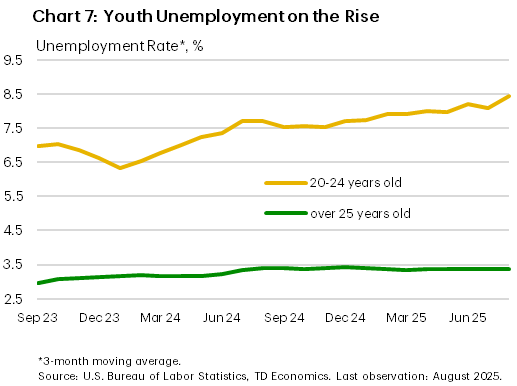
Researchers at Stanford find that hiring of early career and younger workers in most AI-exposed occupations (e.g., software developers and customer service representatives) has been negatively affected by acceleration in GenAI adoption, as were workers in roles where AI automates rather than augments human labor. Indeed, while the unemployment rate has remained relatively low and stable for workers older than 25 years over the past year and a half, it has been rising for younger workers (ages 20-24) (Chart 7).
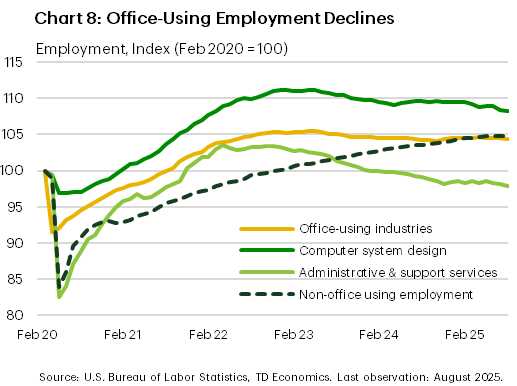
Office-using employment – which encompasses many industries with significant AI-exposure peaked in 2023 – shortly after ChatGPT was first publicly released in November of 2022 – and has been stagnating ever since. Industries such as information, administrative & support services, and computer system design have been shedding jobs, even as employment in other non-office using industries continued to grow (Chart 8). While in some of these industries – such as computer systems design – an argument can be made that employment growth was too rapid post-pandemic and the recent trend reflects some “right-sizing” by employers, generative AI is also likely influencing these shifts. In administration and support services—a sector filled with entry-level roles and tasks suitable for automation using GenAI—employment has now fallen below pre-pandemic levels.
Is the employment slowdown broad-based or is it limited to a particular sector?
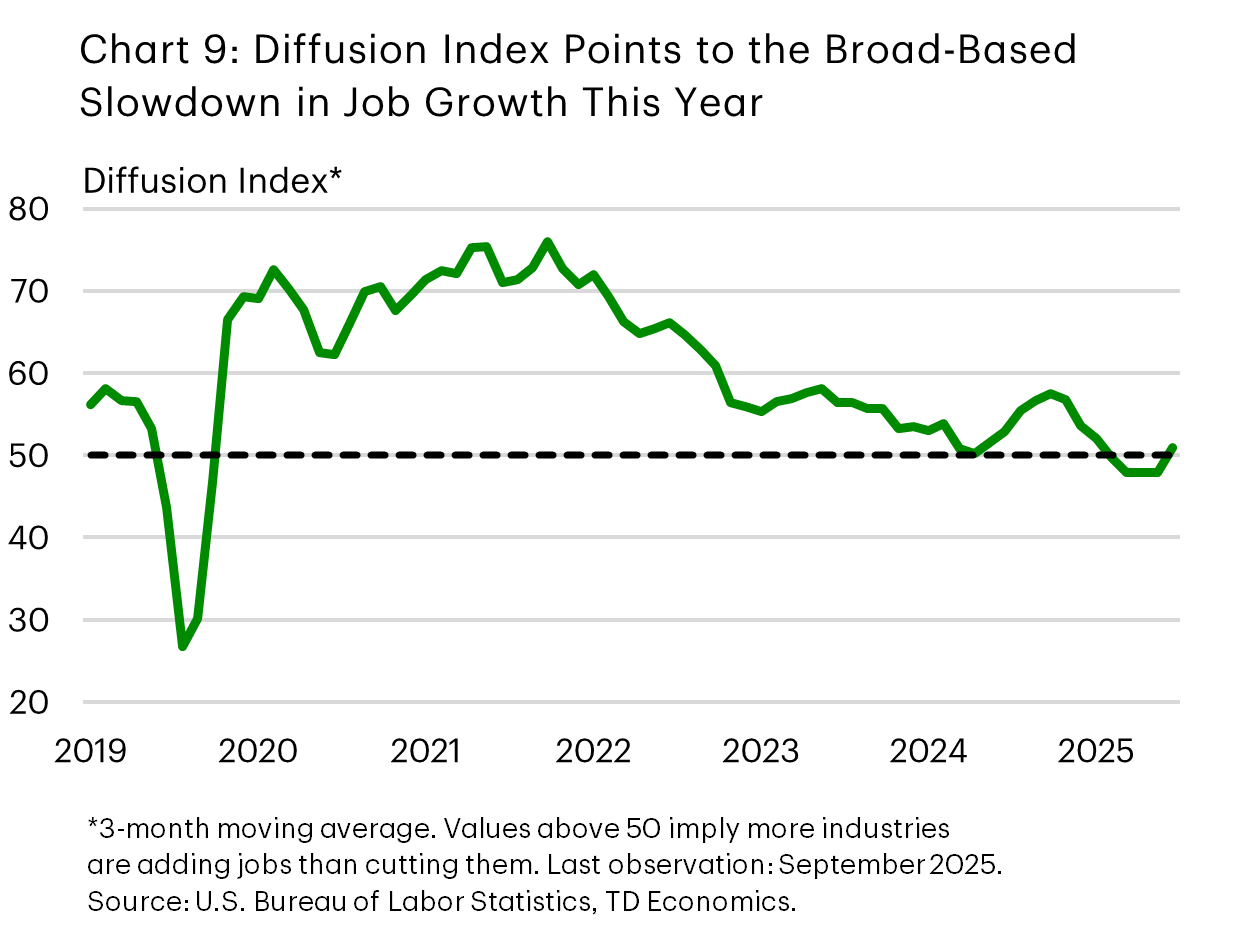
Although it may be tempting to pinpoint the slowdown in job creation to a single sector, the reality is that the U.S. labor market has faced numerous shocks this year, resulting in a broad-based deceleration. Even more stable industries like education and healthcare, are now exhibiting weaker performance. This trend is evident in the payrolls diffusion index, which has remained well below historical averages through much of this year (Chart 9).
However, the degree of the slowdown varies across sectors. While some industries are experiencing outright job losses, others are still growing, albeit at a slower pace. Sectors with high exposure to trade are faring worse than those with less exposure. Additionally, office-based industries that are more susceptible to generative AI and automation are underperforming. The government sector has faced direct impacts due to DOGE cuts. Furthermore, job growth in hospitality, agriculture, and construction has been hampered by labor shortages stemming from tighter immigration policies. Ultimately, combined with heightened economic uncertainty, these interconnected challenges—though distinct across industries—have collectively contributed to slower overall job creation this year.
What does the recent labor market performance mean for the Fed?
The Fed has taken note of the softening labor market in recent months, with worries overshadowing policymakers’ earlier concerns about the impact of tariffs on still elevated inflation. This prompted the Fed to deliver on two quarter-point insurances cuts in September and October. However, at the last meeting, Fed Chair Powell delivered a shot across the bow of markets (that had already fully priced another cut in December) by saying that it was “not a foregone conclusion – far from it.” This was in response to a significant divide among FOMC members regarding the need for a further reduction in December. The October meeting minutes underscored the lack of consensus, with many participants taking a more hawkish stance and seeing no justification for a December rate cut.
Unfortunately, the delayed September payrolls report did little to reconcile the divide among policymakers. Hawks were likely reassured by the better-than-expected job gains. However, policy doves could point to the negative revisions to prior months, the narrow concentration of job gains, and the uptick in the unemployment rate. Moreover, the delay in other official releases means that there will be no other jobs or inflation data until after the December FOMC. This won’t do much to bridge the gap within the committee.
Market pricing has been oscillating alongside the tone of remarks from the deluge of Fed speakers in recent weeks. After falling as low 30-40%, market-based probability for a December cut has since rebounded to around 80%. The Fed doesn’t tend to fight the market, so if odds hold at these levels, then a further trim in the policy rate on December 10th (to 3.50-3.75%) would be a good bet. The hawks might be brought on side if forward guidance set a higher bar around a further reduction in January.
If the Fed follows through with the December cut, we anticipate a lengthy move to the sidelines. We’re still of the mind that a resting place for the Fed funds rate is 3.25%, but the final two cuts would probably not occur until after the new Fed Chair is in seat.
End Notes
- Board of Governors of the Federal Reserve System. (2025, October 15). The Beige Book: Summary of Commentary on Current Economic Conditions by Federal Reserve District. https://www.federalreserve.gov/monetarypolicy/files/BeigeBook_20251015.pdf
- Brynjolfsson, E., Chandar, B., & Chen, R. (2025, August 26). Canaries in the Coal Mine? Six Facts about the Recent Employment Effects of Artificial Intelligence. Stanford Digital Economy Lab. https://digitaleconomy.stanford.edu/wp-content/uploads/2025/08/Canaries_BrynjolfssonChandarChen.pdf
- Hosseini Maasoum, S. M., & Lichtinger, G. (2025). Generative AI as Seniority-Biased Technological Change: Evidence from U.S. Résumé and Job Posting Data. SSRN. https://papers.ssrn.com/sol3/papers.cfm?abstract_id=5425555
Disclaimer
This report is provided by TD Economics. It is for informational and educational purposes only as of the date of writing, and may not be appropriate for other purposes. The views and opinions expressed may change at any time based on market or other conditions and may not come to pass. This material is not intended to be relied upon as investment advice or recommendations, does not constitute a solicitation to buy or sell securities and should not be considered specific legal, investment or tax advice. The report does not provide material information about the business and affairs of TD Bank Group and the members of TD Economics are not spokespersons for TD Bank Group with respect to its business and affairs. The information contained in this report has been drawn from sources believed to be reliable, but is not guaranteed to be accurate or complete. This report contains economic analysis and views, including about future economic and financial markets performance. These are based on certain assumptions and other factors, and are subject to inherent risks and uncertainties. The actual outcome may be materially different. The Toronto-Dominion Bank and its affiliates and related entities that comprise the TD Bank Group are not liable for any errors or omissions in the information, analysis or views contained in this report, or for any loss or damage suffered.
Download
Share: