Highlights
- As part of the debt ceiling deal, the U.S. Congress prevented any further extensions to the three-year moratorium on student debt repayment.
- As a result, over 27 million borrowers will be required to start making regular monthly student debt payments by October. The hit to household consumption could be as much 0.3 percentage points by mid-2024.
- This is happening at a time when delinquency rates across other consumer products are already showing some strain. Low unemployment, relatively low debt servicing costs, and some remaining excess savings buffer should limit the downside risk to the outlook. However, the cushion for the economy to absorb further shocks is becoming increasingly thin.
The three-year moratorium on student debt relief will soon be ending, which means over 27 million borrowers will soon resume regular monthly student loan payments. With delinquency rates for some household credit products already rising, and the labor market expected to cool through the second half of this year, is this the X-factor that will finally break the U.S. economy’s resilience? At this point, we don’t think so, but the cushion to absorb further shocks is becoming increasingly thin.
Research has shown that the moratorium on student debt created a ‘leverage effect’ where borrowers substituted the student loan relief in favor of increased holdings of other household debt (i.e., autos, credit card and mortgage). This problem was likely accentuated by last year’s announcement of the Biden Administration’s planned Student Debt Forgiveness Program, which potentially altered some household’s savings behavior and inadvertently put some borrowers in a more vulnerable position.
At a minimum, the end of the student debt moratorium poses a near-term headwind to household consumption and will likely pressure delinquency rates higher across a subset of borrowers. That said, household balance sheets remain healthy at the aggregate level, while debt servicing costs – despite having increased – also remain relatively low by historical standards. This should help mitigate a broader deterioration in credit quality and thereby limit the downside risk to the outlook.
Student Loans Go Back into Repayment in the Fall
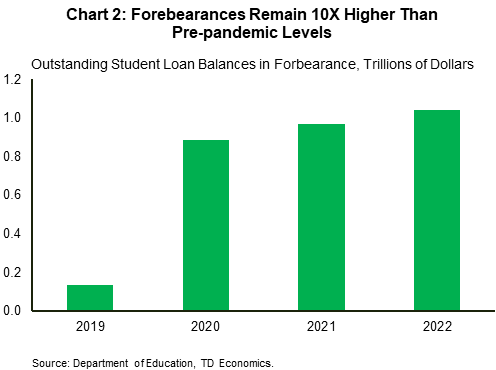
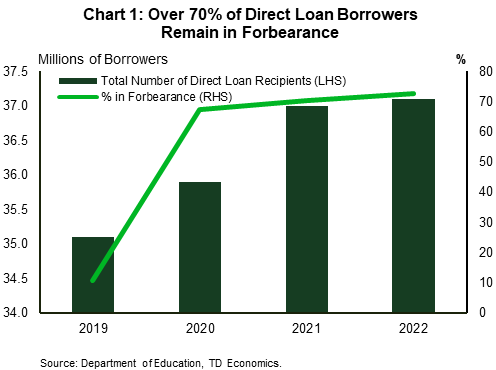
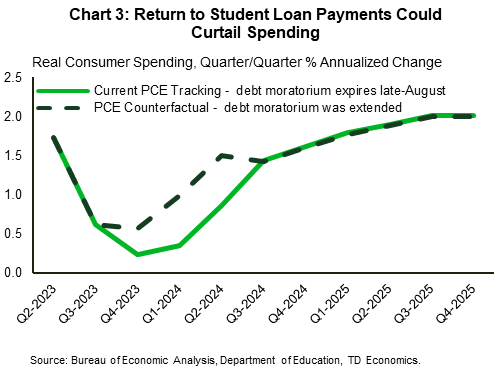
As part of the debt ceiling deal, Congress ended the three-year moratorium on student debt repayment. As a result, an estimated 27 million borrowers, out of a total 46 million student loan borrowers, will need to resume making regular student loan payments by October (Chart 1). The impact to the average borrower could be meaningful. Figures reported by the Department of Education show that nearly three-quarters of the $1.04 trillion outstanding Federal student loans are currently in forbearance (Chart 2). Of those, nearly a third are on an Income Driven Repayment plan, where monthly payments are capped as a percentage of the borrower’s income. The remaining two-thirds of borrowers hold a more traditional Direct Loan, which carry an average amortization of 10-years. Based on a crude estimate, the average monthly payment for the Direct Loan borrowers is around $350 per-month. However, this assumes that the debt is spread evenly among borrowers, which is not entirely accurate. For example, those that hold doctorates or other professional designations likely carry a much higher debt load. To account for this, we apply specific assumptions on debt holdings by income, alongside corresponding estimates of marginal propensity to consume, which yields an estimated hit of approximately $75B (annualized) to household consumption, or a reduction of roughly 0.3 percentage points by mid-2024 (Chart 3).
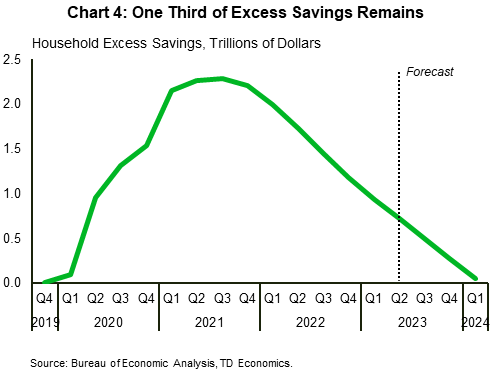
Admittedly, these estimates likely stand as a ‘worst case scenario’ as they effectively assume that no borrowers were forward looking and didn’t set aside any precautionary savings in anticipation of the forbearance program ending. We know households are still sitting on roughly a third of the 2.2 trillion in excess savings that were accumulated through the early stages of the pandemic (Chart 4). It’s not a stretch to assume that some of those funds have been reserved anticipating the moratorium would end at some point.
The only issue is that most of the remaining excess savings reside with higher income households. Moreover, there is growing evidence to suggest that a subset of borrowers increased leverage while student debt payments were on pause. In part, they were able to do this because the combination of relief measures through student and mortgage forbearances alongside the direct federal cash transfers all helped to improve most borrowers’ financial wellbeing and drive an overall increase in credit scores. A recent study done by the Consumer Financial Protection Bureau found that the lowest credit quality tiers, including deep subprime and subprime experienced the largest upward shift in credit scores, though higher tiers also saw some increase. These increased credit scores – particularly the transition out of subprime to prime – allowed individuals to access more credit or potentially even access other types of credit (i.e., auto, mortgage) that they may not have otherwise had access to.
A recent research paper published by economists at the Becker Friedman Institute for Research found that borrowers in forbearance saw their monthly payments drop by an average of $138 (or $1,656 annually). Instead of using that windfall to paydown existing debt, most went the other direction and added an average of $1,200 of mortgage, auto and credit card debt along with an additional $1,500 of student debt.
Last year’s announcement by the Biden Administration that they planned to forgive up to $20,000 in student debt for roughly 37 million borrowers may have also been a factor driving an increase in leverage. Borrowers may have taken on more debt under the belief that some share of student debt would be forgiven. However, the program’s fate is being challenged at the Supreme Court, and it could be overturned. This may have inadvertently put some borrowers in a more vulnerable position.
Signs of Strain Already Showing
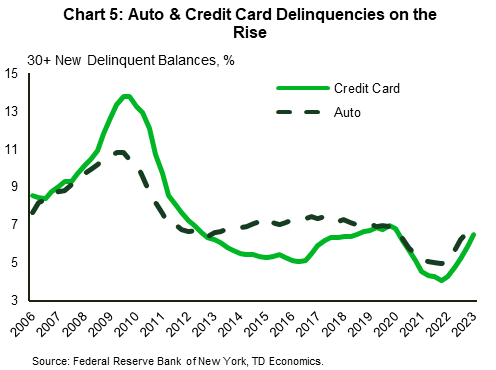
This is happening at a time when some strain in household credit quality has already started to emerge. New 30+ day delinquency rates for both credit cards and auto loans have jumped over the past year and are now back to pre-pandemic levels (Chart 5). While eye catching, much of the recent jump in delinquency rates can be attributed to a normalization of the various pandemic income support measures that have ended over the past year. However, the speed of the adjustment bears close watching.
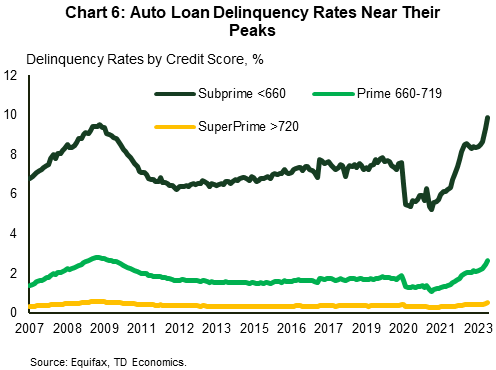
Cutting the data by FICO score shows delinquencies across all credit scores have been on the rise, though the most pronounced move has come from lower credit quality subprime borrowers (FICO < 660). In the case of auto loans, total delinquencies for subprime, prime, and super prime borrowers are all at, or near, their respective Global Financial Crisis (GFC) peaks (Chart 6). This is even though the unemployment rate sits near a historical low and is more than six percentage points below the GFC peak.
Some of the increase appears to be related to the fact that buyers simply stretched themselves too thin in recent years. New vehicle prices increased by more than 23% since the onset of the pandemic, while used car prices surged nearly three times that amount. While buyers who purchased early in the pandemic would have benefited from lower interest rates and only somewhat elevated prices, more recent buyers have been hit by the double whammy of paying top dollar at a time when financing costs have also reached multidecade highs. This has put a tremendous strain on buyer affordability, which is apparent in the
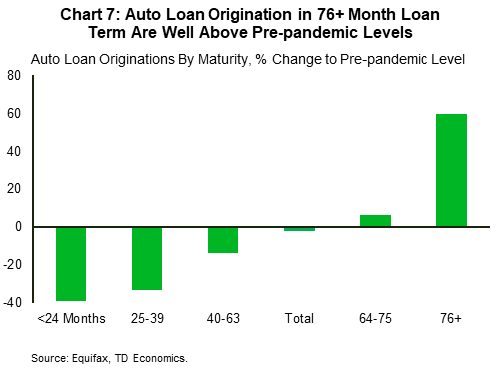 lending data. Though total lending volumes (i.e., the number of outstanding auto loans) remain below pre-pandemic levels, we have seen significant growth in loans carrying a 76+ month term. This is true across all FICO scores within this term. Meanwhile, lending volumes across nearly all other loan maturities remain below pre-pandemic levels (Chart 7). The fact that most individuals were needing to spread payments over increasingly longer terms suggests some buyers were likely stretched.
Of particular concern are those that purchased a used vehicle in late-2021 when prices peaked. With used vehicle prices having fallen by 16%, nearly all of these buyers would already be in a negative equity position – owing more on the vehicle than it’s worth. In the event of a default, they face a hit to their credit rating, and will be on the hook for the negative equity.
Turning to credit cards and ‘other’ personal loans, the recent increase in delinquencies is equally noteworthy. However, the rise is largely concentrated in the sub-prime category, while delinquencies in the prime and super-prime categories remain historically low. Cutting the data by age shows that younger borrowers have seen the biggest adjustment, which is not necessarily surprising given that these individuals are more likely to have a precarious income stream. They’re also more likely to hold student debt, which is concerning since these payments have been on hold. With student debt repayment resuming, there’s a good chance that this subset of borrowers will see a further rise in delinquencies as they become increasingly squeezed.
Debt Servicing Costs on the Rise
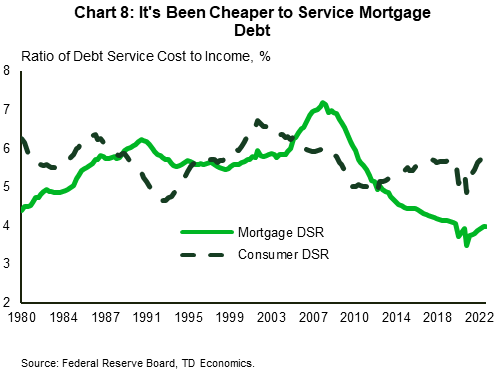
At this point, the risks still seem relatively contained. This is largely because debt servicing costs remain relatively low by historical standards. The combination of larger debt holdings and higher interest rates has meant that the minimum household debt payments have been on the rise – up 15% from its lowest point in Q2 2020 (Chart 8). While this increase is sizeable, it looks less forbidding when compared against household income using a measure known as debt service ratio (DSR). Relative to its trough in 2020, the DSR has increased by only 1.4 percentage points and remains a tenth of a percentage point below the pre-pandemic level and 3.5 percentage points below its historic peak. The sharp decline in the DSR during the pandemic always seemed unsustainable, making the recent rebound more likely a normalization, rather than a deterioration.
One caveat is that the DSR reflects the total obligations of the entire population, rather than the obligations of the typical household with debt. When we break it down by type of credit (i.e., mortgage and consumer debt service ratios) these measures show evidence of bifurcation in the household credit landscape. Homeowners are paying less to service debt than those who rent. Through the first two-years of the pandemic, mortgage rates fell to historically low levels, allowing homeowners to refinance at a rate that was about 120 basis points lower than the prevailing mortgage rate averaged over the two-year period preceding the pandemic. This helped many homeowners lower their monthly mortgage payments and improve cash flows for many years to come. In addition, rising house prices made it easier for some to take out equity and finance large-price purchases at a cheaper rate.
In contrast, the decline in interest rate paid on consumer credit was relatively minor, ranging between two (for credit card plans) and 90 basis points (for short-term personal loans). That kept the cost of borrowing elevated throughout the pandemic, limiting refinancing opportunities for households relying on only on consumer debt. In fact, the major reason the consumer DSR declined during the pandemic was the $60 billion reduction in the consumer credit outstanding – a by-product of the sharp pullback in spending at the onset of the pandemic – and had less to do with a reduction in interest rates (as was the case for mortgage service cost).
Perhaps the most overlooked factor that has worked in all borrowers’ favor through the debt payment moratorium has been that some of their debt holdings have been inflated away. For example, an average borrower who owed $35,000 in student debt at the onset of the pandemic has seen zero interest accumulated on their debt. Adjusting for inflation shows that the average balance is approximately $4,500 less in today’s dollars, a 13% reduction in real terms. This is significant given that inflation-adjusted income growth has been on the rise for nearly a year.
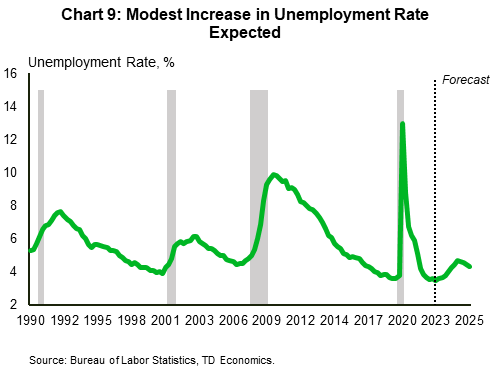
The other factor working in households’ favor is that the labor market remains sturdy. Job growth remains robust, layoffs are low, and job openings are plentiful. While we expect some cooling in hiring through H2’2023 and into 2024, it’s relatively mild by historical standards. The unemployment rate is only expected to increase 1.2%-pts, which is less than half the increase seen over a typical recession (Chart 9). This will put some downward pressure on wage growth, but that should occur alongside an easing in inflationary pressures, preventing any meaningful erosion in real household income.
Bottom Line
With student loan repayments resuming in the fall, another headwind will test the economy’s resilience. We estimate that it could shave as much as 0.3 percentage points from annual consumption growth between late-2023 and 2024.
The recent uptick in delinquency rates, particularly among younger and lower credit quality borrowers shows some pockets of strain have already started to emerge following the expiration of various pandemic income support measures. This bears close watching, as these various programs were also a factor contributing to increased leverage among a subset borrower. Though the cushion is thinning, a sturdy labor market, some remaining buffer of excess savings and still low debt servicing costs are all factors that should allow the economy to absorb the shock without a broader deterioration to the outlook.
Disclaimer
This report is provided by TD Economics. It is for informational and educational purposes only as of the date of writing, and may not be appropriate for other purposes. The views and opinions expressed may change at any time based on market or other conditions and may not come to pass. This material is not intended to be relied upon as investment advice or recommendations, does not constitute a solicitation to buy or sell securities and should not be considered specific legal, investment or tax advice. The report does not provide material information about the business and affairs of TD Bank Group and the members of TD Economics are not spokespersons for TD Bank Group with respect to its business and affairs. The information contained in this report has been drawn from sources believed to be reliable, but is not guaranteed to be accurate or complete. This report contains economic analysis and views, including about future economic and financial markets performance. These are based on certain assumptions and other factors, and are subject to inherent risks and uncertainties. The actual outcome may be materially different. The Toronto-Dominion Bank and its affiliates and related entities that comprise the TD Bank Group are not liable for any errors or omissions in the information, analysis or views contained in this report, or for any loss or damage suffered.
Download
Share: