Highlights
- The Bureau of Economic Analysis recently made annual benchmark revisions to its National Income & Product Accounts, which showed a stronger pace of economic and income growth in recent years, with a notable upgrade to personal income in H1-2024.
- As a result, we now estimate that there’s roughly $350 billion of remaining excess savings – up from our prior estimate of $100 billion.
- The larger cushion of savings alongside the upward income revision and September’s surprisingly strong employment report suggests some upside to the consumer spending outlook, which is now expected to run closer to 2% in 2025.

We have long thought that consumer spending was ripe for at least a few quarters of below average growth. But time and time again, we’ve pushed out the timing of when that would occur due to an exceptionally resilient consumer. Our most recent forecast assumed spending would slow in H1-2025, largely predicated on the fact that the job market was quickly cooling, consumer delinquencies were trending higher, and households’ savings had dipped to a multi-year low. But since then, the backdrop is looking more positive for a couple of reasons. Personal income was revised higher and shows a larger cushion of remaining excess savings, while September’s employment report suggests healthy income gains continued into the third quarter. While consumer spending is still expected to cool from its breakneck pace of over 3% annualized in Q3, we now expect somewhere closer to 2% spending growth through 2025.
Benchmark Revisions Support Stronger Consumer Balance Sheets
Since we published our last forecast, the Bureau of Economic Analysis released its annual comprehensive revisions to its National Income & Product Accounts. Overall, the revisions showed that U.S. economic growth was higher than previously reported, with annual GDP growth between 2021-2023 revised higher by 0.5 percentage points to an average annual growth rate of 2.7%. Much of that revision was due to a stronger pace of domestic spending, particularly for consumer spending and business investment (Chart 1).
 Real gross domestic income (GDI, an alternative measure of economic output) was revised up even higher, with average growth revised from 1.3% to 2.2% between 2021-2023. The revision was even larger over the first half of 2024, where first quarter GDI was revised from 1.3% quarter-on-quarter annualized to 3.0% and for Q2 from 1.3% to 3.4%. Most of the additional strength was the result of stronger employee compensation, which is now running about $200 billion higher than previously estimated. This has lifted real disposable income growth from a relatively benign 1.1% annualized rate of expansion in H1-2024 to 4.2%. Because the 2024 income revisions were far greater than the revisions to consumer spending, the household savings rate was revised meaningfully higher, from 3.3% to 5.2% in the second quarter. And while the revised series still shows a downward trend in the savings rate, the slope is far less severe than what was previously reported (Chart 2).
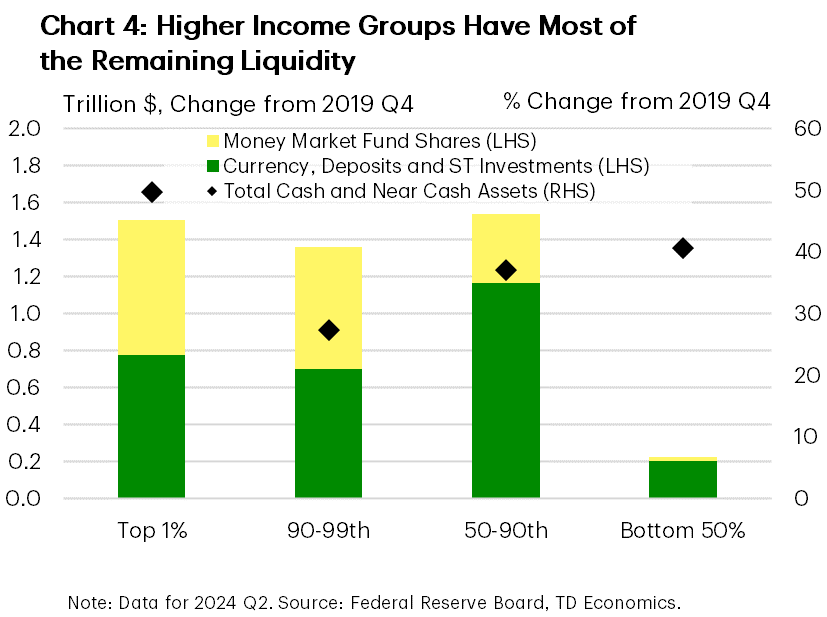
The income revisions have also resulted in an upward revision to our estimate of excess savings, which now appear to be closer to $350 billion as of Q2-2024, up from our prior estimate of $100 billion. (Chart 3). Using households’ available liquid funds, most of the excess savings (over 60%) are held by households in the top 10% of the wealth distribution with very little (less than 5%) remaining in the hands of those in the bottom 50% (Chart 4), who tend to spend a higher share of their income. This could mean that the remaining drawdown of excess savings happens more slowly than it has in the past or maybe not at all. But either way, we would be remiss if not at least highlighting the revision as a potential tailwind for spending over the coming quarters.


Stronger Job Gains Add to Consumer Upside
Moreover, growth in employee compensation is likely to accelerate above the already strong 6% annualized pace seen in the second quarter. This is due to a combination of healthy wage gains and an uptick in job creation. While the surge in job creation in September likely overstates the degree of strength still present in the labor market, smoothing through recent volatility still shows that the economy added a healthy 186,000 jobs per-month over the past three-months, up from 147,000 per-month averaged in the second quarter.
More so than the savings revisions, this poses some upside risk to our current spending forecast. Indeed, there will be some near-term distortions coming through in the fourth quarter spending data, largely due to the devasting impacts from Hurricane’s Helene and Milton – making it very difficult to infer a monthly pattern with any degree of confidence. However, once those impacts fall out, it’s now looking more likely that consumer spending can continue to run closer to 2% through all of 2025, as opposed to our prior thinking of a few quarters of sub-2% spending growth.
Greater Spending Unlikely to Undo Inflation Progress
From an inflation standpoint, the modest upgrade to spending is unlikely to pose any meaningful upside risk to the inflation outlook. For starters, much of the additional strength on spending is likely to come from areas of discretionary spending like durable goods (ex. autos), recreational services and food services & travel, where we had previously assumed most of the cooling would be concentrated. However, price pressures across most of these discretionary categories have already returned to or are running below their respective pre-pandemic rates of price growth. This suggests that a modest upgrade to spending is unlikely to meaningfully move the needle on inflation. Moreover, the discretionary service categories where we see the most upside only account for a little over 13% of core PCE inflation. So even if prices were to jump by over 1% annualized, it would only add slightly more than a tenth of a percentage point to the Fed’s preferred inflation gauge.

Headwinds From Delinquencies Have Possibly Peaked
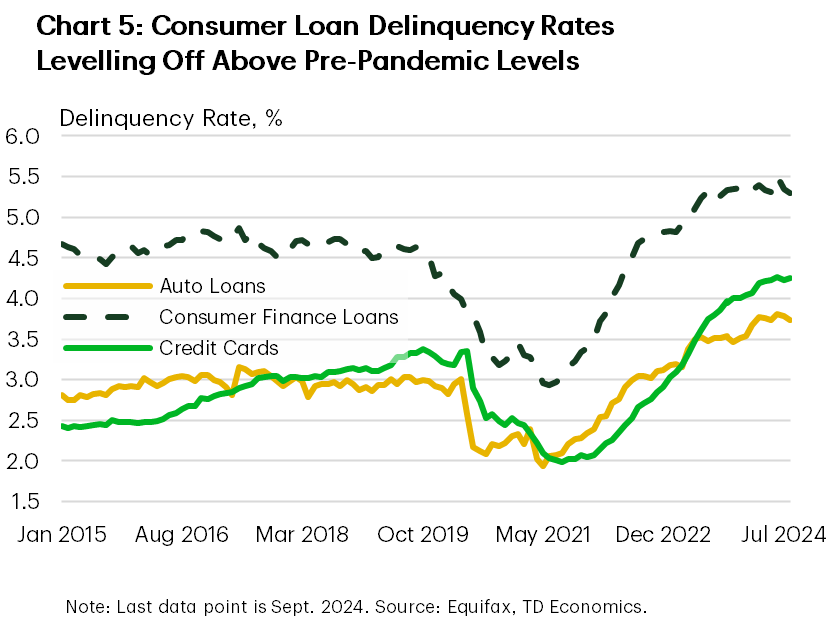
At this point, what’s happening on the delinquency rate front remains a wild card. Clearly, some borrowers have come under pressure, as evidenced by delinquencies for most consumer credit products now above pre-pandemic levels (Chart 5). We suspect a lot of this is driven by the “credit score inflation” that happened during the pandemic, which ultimately unlocked more available credit for borrowers and likely resulted in some overextending. The problem has been particularly acute for some lower-income borrowers, who would’ve benefited the most from loan forbearance programs during the pandemic, and thus the “credit score inflation” phenomenon. They were also the most vulnerable during the recent bout of higher inflation and among the first to draw down their excess savings. Consequently, delinquency rates across this sub-group have seen the largest increases in recent years and have been a major contributor to the uptick in the aggregate measures. However, with the Fed’s easing cycle underway, the job market still appearing healthy, and prices for things like autos and essentials easing, we should soon see consumer delinquencies cresting.
Bottom Line
All-in-all, the recent revisions to the income and spending accounts reveal that consumers may in fact have more gas in the tank than previously expected. This has resulted in an upward revision to not only our estimate of excess savings but also our expectations for consumer spending. While rising consumer delinquency rates remain a potential headwind for spending, we suspect the forces are already in place to lead to a leveling off over the near-term. Should this not be the case, we could again be revisiting our consumer spending outlook. But for now, the labor market remains healthy and still supportive of ongoing income gains, which taken alongside the larger cushion of savings should help to keep spending running around 2% over the coming year.
Disclaimer
This report is provided by TD Economics. It is for informational and educational purposes only as of the date of writing, and may not be appropriate for other purposes. The views and opinions expressed may change at any time based on market or other conditions and may not come to pass. This material is not intended to be relied upon as investment advice or recommendations, does not constitute a solicitation to buy or sell securities and should not be considered specific legal, investment or tax advice. The report does not provide material information about the business and affairs of TD Bank Group and the members of TD Economics are not spokespersons for TD Bank Group with respect to its business and affairs. The information contained in this report has been drawn from sources believed to be reliable, but is not guaranteed to be accurate or complete. This report contains economic analysis and views, including about future economic and financial markets performance. These are based on certain assumptions and other factors, and are subject to inherent risks and uncertainties. The actual outcome may be materially different. The Toronto-Dominion Bank and its affiliates and related entities that comprise the TD Bank Group are not liable for any errors or omissions in the information, analysis or views contained in this report, or for any loss or damage suffered.
Download
Share: