New England (Jump to Section)
- New England entered 2026 on a softer footing. However, financial services activity, defense manufacturing, and health care are helping limit downside risks from federal research funding cuts and elevated trade uncertainty. We expect economic growth to decelerate modestly to 1.9% in 2026. Aging demographics, limited international migration, and continued domestic outflows are restraining labor force growth, which should keep unemployment relatively stable despite softer demand. We expect the region’s unemployment rate to average 4.3% this year. Tight housing inventories are still supporting price growth relative to the nation, though we expect appreciation to ease modestly to 3.2% in 2026.
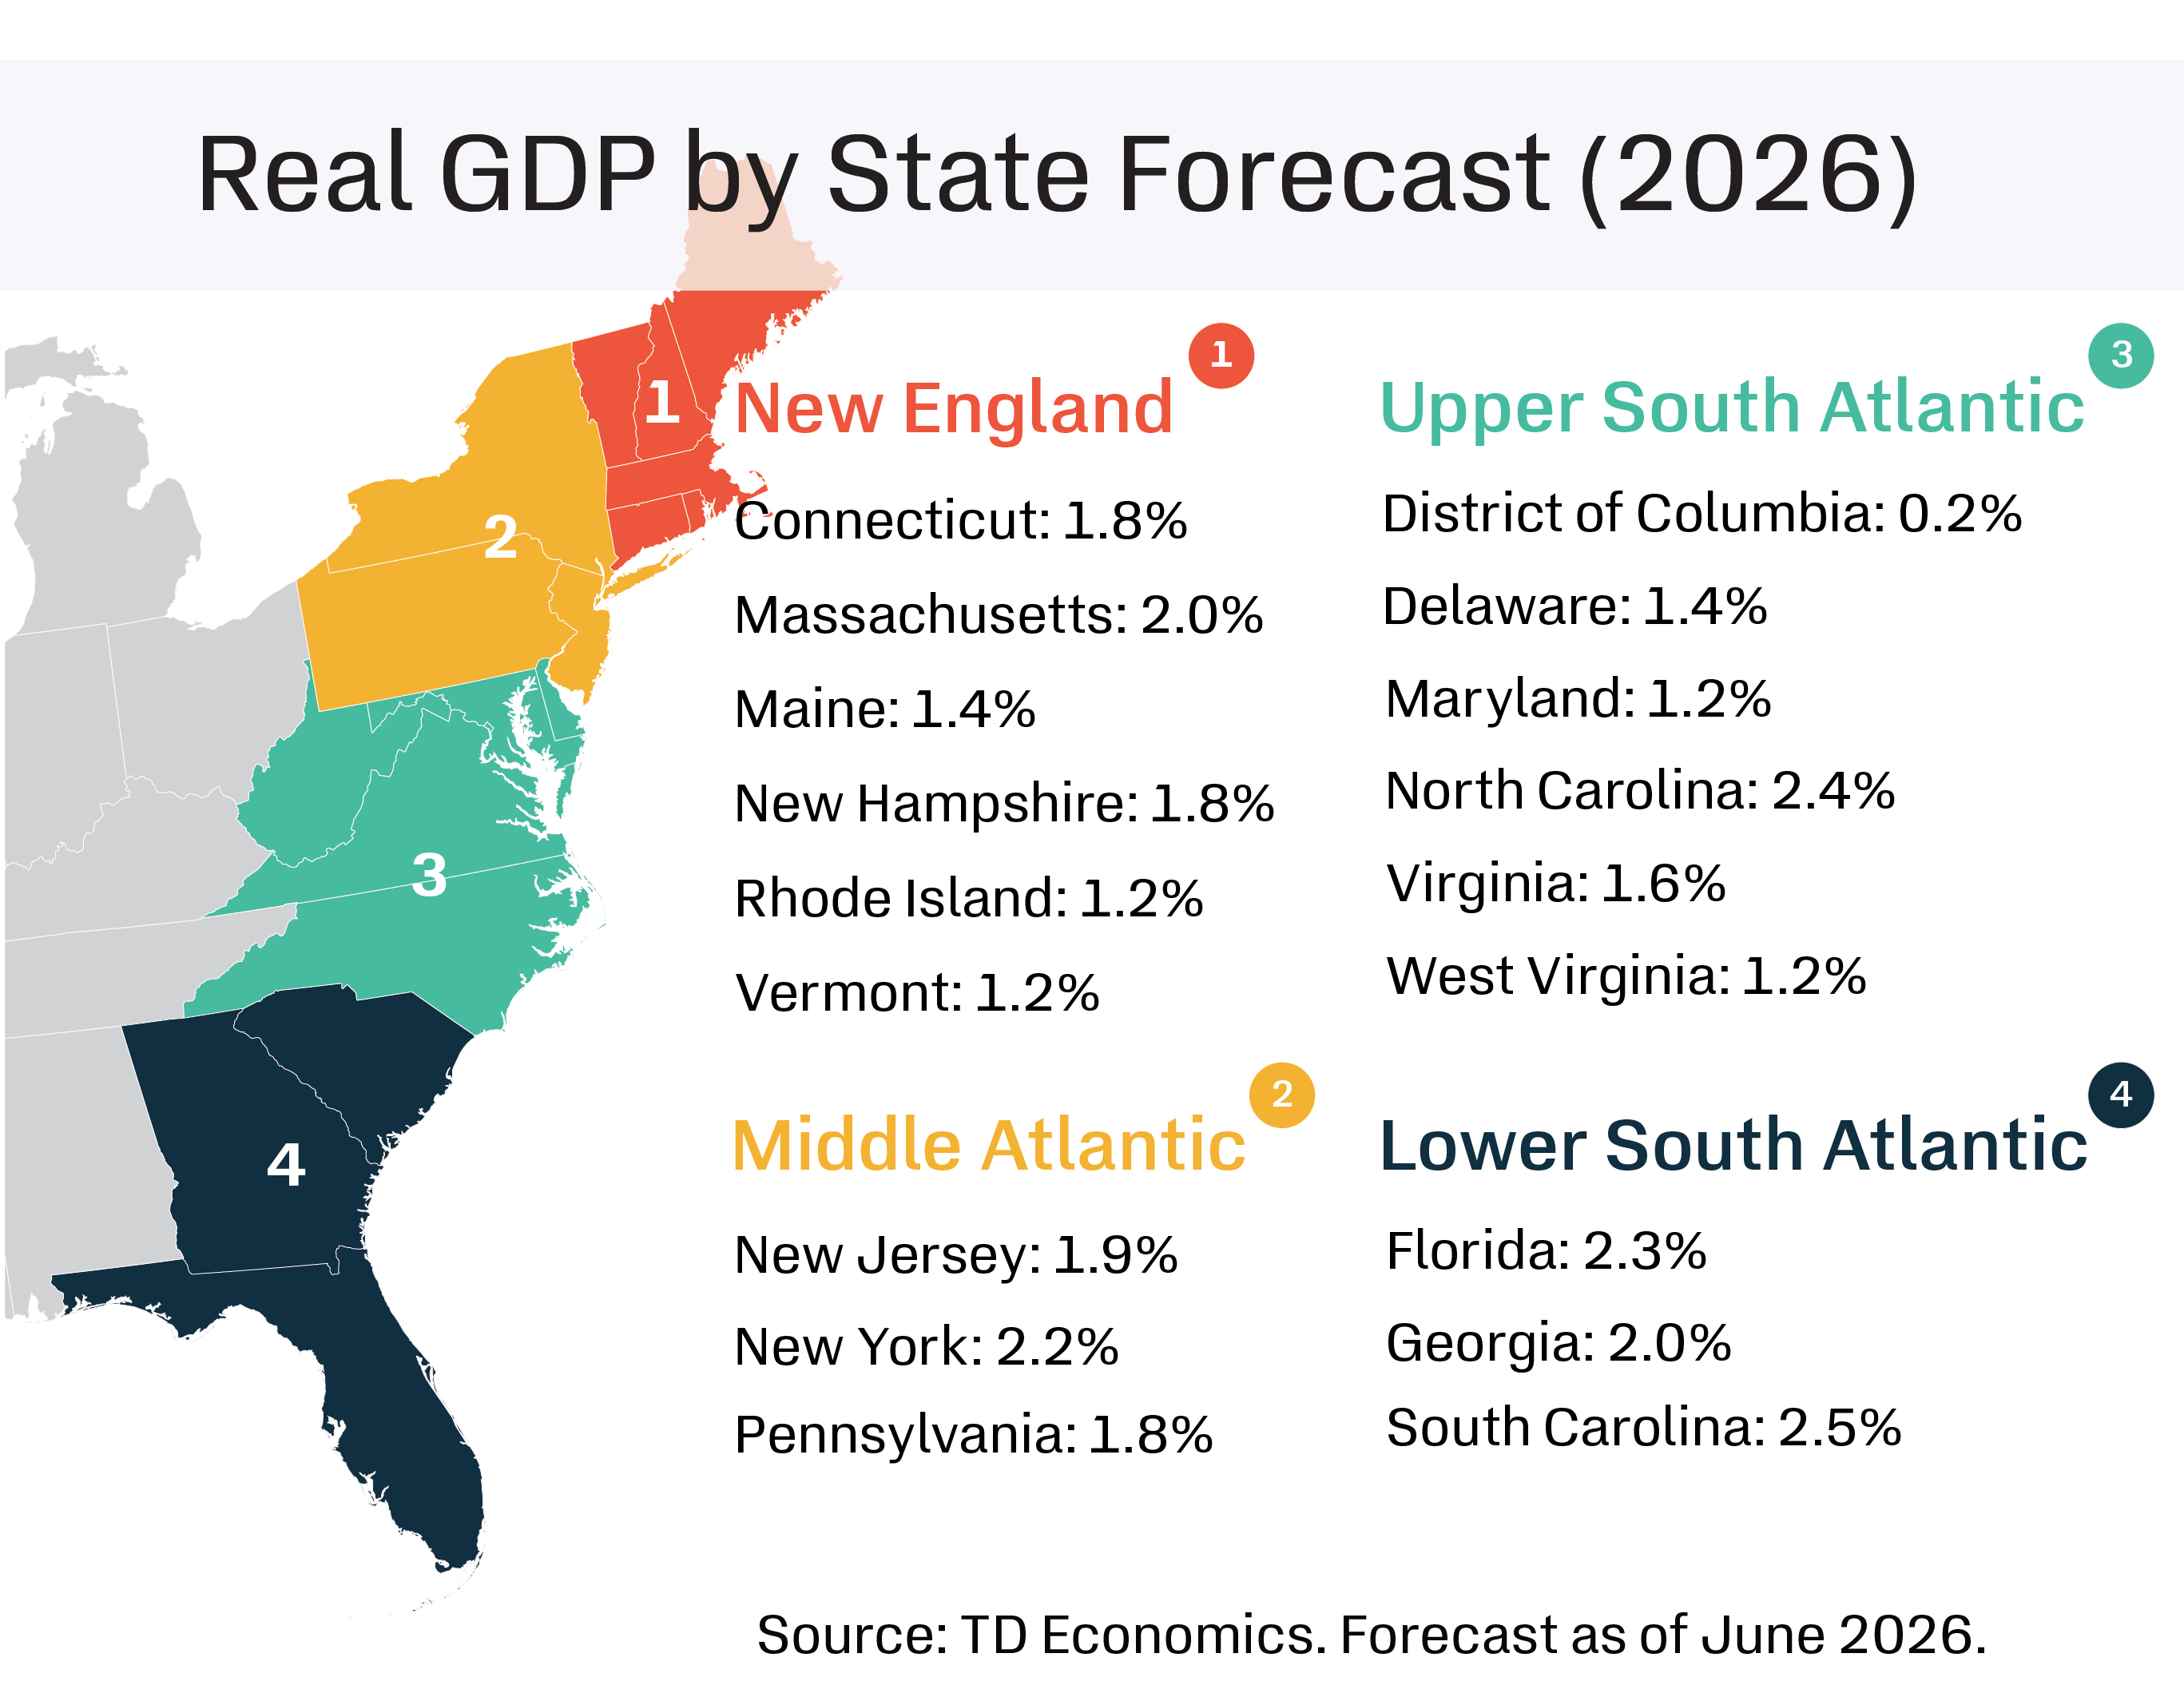
Middle Atlantic (Jump to Section)
- Economic growth in the Middle Atlantic has remained firm to start 2026, supported by the region’s large white-collar industries and significant investments tied to artificial intelligence. We expect growth to decelerate modestly to 2.0% but remain healthy overall. The region's unemployment rate is expected to hold steady through the year as hiring gradually broadens beyond health care and labor force growth moderates. House price growth should also continue to ease as supply gradually improves, though underlying demand remains supported in several large metro markets. We expect regional home price growth to slow to 3.2% in 2026.
Upper South Atlantic (Jump to Section)
- Economic activity in the Upper South Atlantic is set to firm as 2026 unfolds, helped by the impact of federal spending cuts falling increasingly in the rearview mirror, and continued resilience in North Carolina. Energy price volatility and elevated borrowing costs pose near-term headwinds, but should prove temporary, keeping regional growth near 1.7% this year. Beneath the regional headline, performance remains uneven. North Carolina is forecast to lead the region once again, supported by a diversified industry mix and a deep investment pipeline. Growth in Virginia, Delaware and Maryland trails behind, below the national rate. D.C. is poised to improve as headwinds dissipate, but a weak handoff will likely keep growth in the slow lane.
Lower South Atlantic (Jump to Section)
- Economic growth in the Lower South Atlantic has eased, with its outperformance versus the nation likely to narrow this year. Florida is transitioning to a more average growth path as softer in-migration, looser labor market, and still-challenged housing conditions weigh on activity. Although corporate expansions should keep the state on stable footing. Georgia’s growth base remains narrow, but a decent investment pipeline offers upside. South Carolina is forecast to remain one of the region’s stronger performers, supported by robust population growth and major investments in areas such as advanced manufacturing, aerospace and autos. As headwinds dissipate, regional growth should improve from 2.2% this year to 2.4% in 2027.
For more details on our national forecast see our Quarterly Economic Forecast.
New England (CT, MA, ME, NH, RI, VT)
Connecticut: Defense & Finance Remain Supportive Amid Mixed Outlook
Connecticut’s outlook continues to be defined by a meaningful divide between resilient defense-related activity and more uneven momentum elsewhere in the private sector. Select white-collar sectors, particularly finance and professional services, have continued to provide support, while the defense channel also remains a key source of support. Electric Boat received nearly $20 billion in Navy contracts tied to Columbia-class and Virginia-class submarine work over the past three months alone. Defense sector support is expected to keep Connecticut's real GDP growth positive in 2026 at 1.8%.
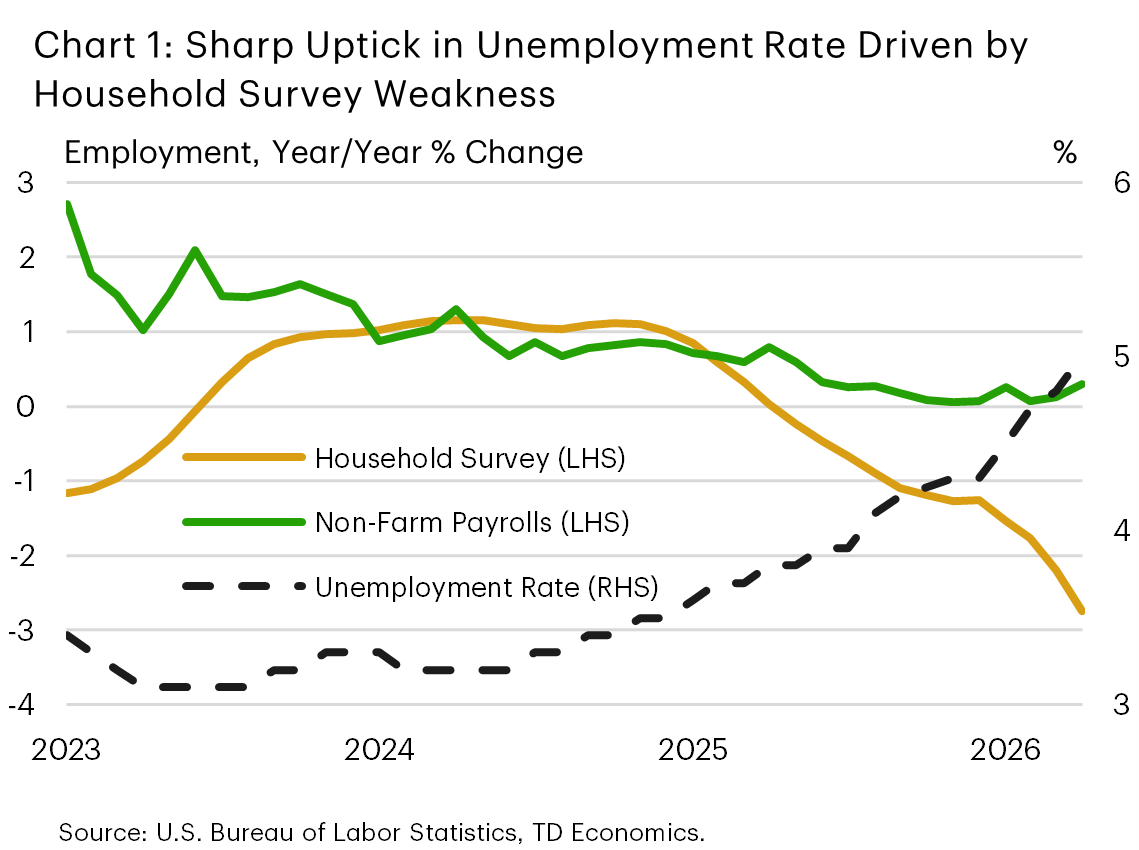
Hiring has improved modestly over the past three months, retracing some of the softness that emerged over the second half of 2025. However, given the decline in job postings in the second quarter, hiring momentum is likely to wane moving forward. At the same time, the unemployment rate has moved notably higher, highlighting a material deviation between enterprise and household survey employment reports that is larger than the deviation also seen nationally (Chart 1). On balance, Connecticut’s labor market remains soft as businesses continue to face elevated uncertainty related to trade and energy prices. We expect Connecticut's unemployment rate to average 4.9% this year, trending lower into 2027 as the labor market continues to rebalance.
The state’s industry mix leaves it with a defensive growth profile rather than a broad cyclical upswing. Defense manufacturing provides a multi-year demand anchor, particularly across submarine and aerospace supply chains. Transportation equipment manufacturing payrolls were 2.4% higher year-on-year in April, versus a flat performance nationally. Construction and health care have accounted for much of the remaining improvement in payroll momentum, underscoring the limited breadth of the 2026 rebound. This illustrates the pressure still facing businesses outside the defense channel, where elevated uncertainty related to energy costs is limiting the breadth of the recovery.
In contrast, housing conditions send a firmer signal on confidence in the state. Connecticut’s house price index has reaccelerated over the past three months, with house prices up 5% year-on-year versus 0.3% nationally. Limited resale supply remains a key support, though affordability pressures are still acute in the state’s larger metro areas. For 2026 we expect home price growth to moderate modestly relative to 2025's pace as affordability becomes increasingly challenging.
Massachusetts: Productivity Growth Breaking with Soft Employment Market
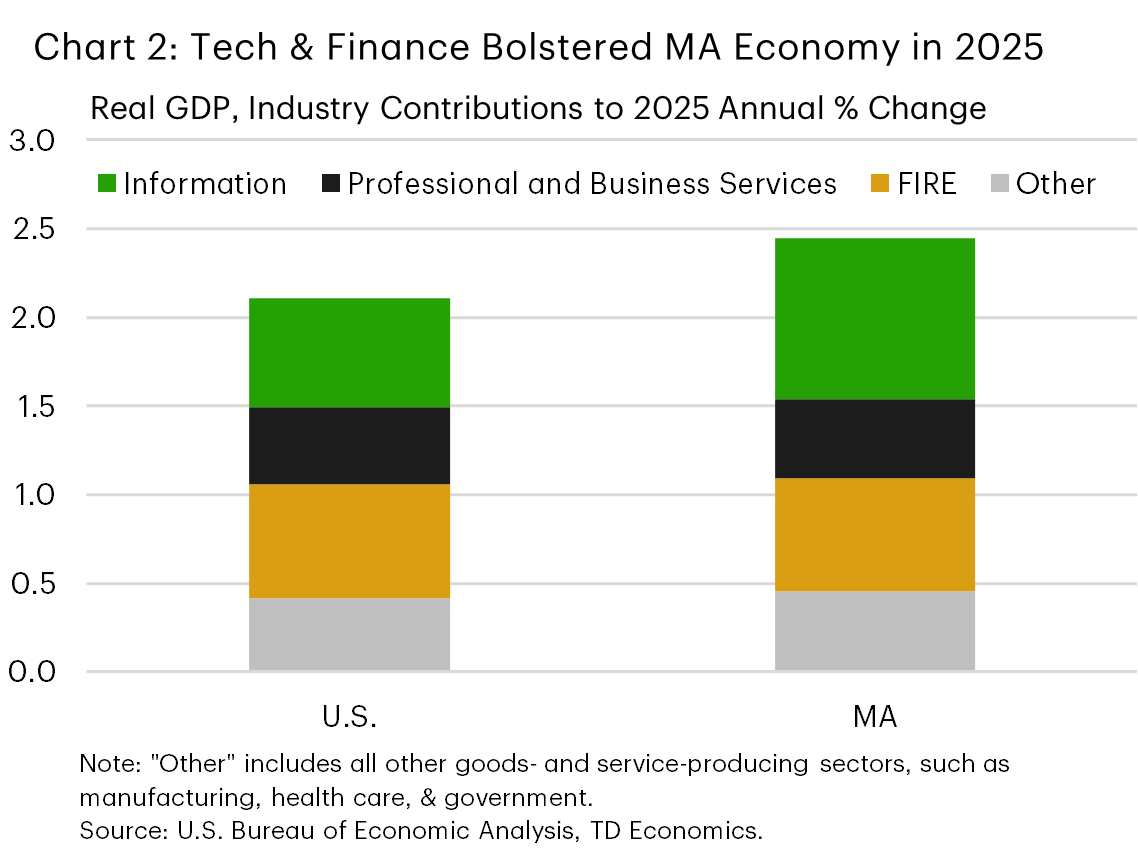
Massachusetts is entering the second half of 2026 with its core growth engine intact, as the state's high value-added tech and finance sectors continue to dominate the current expansion. The knowledge economy remains the state’s main source of upside, particularly where technology, research, and specialized services are linked to productivity-enhancing investment. The intersection of these structural factors with the boom in artificial intelligence remains a key pillar of growth for Massachusetts (Chart 2). However, the broader economy continues to struggle, with energy prices now adding additional uncertainty. Overall, we expect real GDP growth to cool to 2.0% in 2026.
Payroll employment growth improved modestly over the past three months following job losses in 2025. However, the improvement has been moderate, and hiring intentions seem to have slowed considerably through the second quarter with job postings in the state falling consistently since March. Normally this would suggest that the unemployment rate could face upward pressure moving forward but declines in the labor force (-1.6% year-on-year) are likely to provide a partial offset. For 2026 we expect the unemployment rate to hold steady through year-end, averaging 4.5%.
Employment gains have been concentrated in just a few sectors so far in 2026. Construction hiring has seen a notable jump – up nearly 4% year-to-date – joining the non-cyclical sectors that have been the key drivers of employment growth in the state and the nation over the past year. Aside from the construction and non-cyclical sectors, job growth has been roughly flat. For 2026 we expect job growth to remain weak, before improving to 0.7% in 2027.
After weakening through the end of 2025, housing price momentum accelerated in the first quarter as the average 30-year mortgage rate briefly dipped below 6%. However, with mortgage rates back at a 10-month high, this momentum is likely to weaken over the coming months. Supply challenges will continue to partially offset the impact of this headwind on price growth. For 2026 we expect price growth to moderate to 2.3% before rising to 2.6% in 2027.
New Hampshire, Maine & Vermont: Steady Start to 2026 Despite Headwinds
Economic growth in Northern New England has continued to lag the national average as a general lack of high value-added service sectors and slower population growth have led to disparities between the region and the nation. Of the three states, New Hampshire remains better positioned given steadier private-sector momentum, while Maine and Vermont have seen slower growth related to decreased tourism inflows, federal layoffs, and softer real estate activity. For 2026 we expect real GDP growth to recover gradually to 1.8% in New Hampshire, 1.4% in Maine, and 1.2% in Vermont.
After all three states recorded net job losses in 2025, payroll employment has edged higher over the past three months in Maine and New Hampshire, but Vermont has continued to lose ground. Despite job losses, Vermont's unemployment rate has remained stable near 2.6% as a full percentage point decline in the state's labor force participation rate over the past six months has decreased the supply of labor. Maine and New Hampshire have seen smaller declines, but on aggregate labor supply challenges are persisting across the region. We expect these dynamics to keep each state's unemployment rate stable in 2026.
The uptick in employment growth in Maine and New Hampshire to start 2026 was anchored by the health care sector but also included an improved diffusion of gains across different industries. Vermont's job losses were led by the leisure & hospitality sector, with white-collar job losses also weighing on headline growth. A modest rebound in the manufacturing and construction sector hiring over the past six months has aided the state, with a similar trend occurring in Maine.
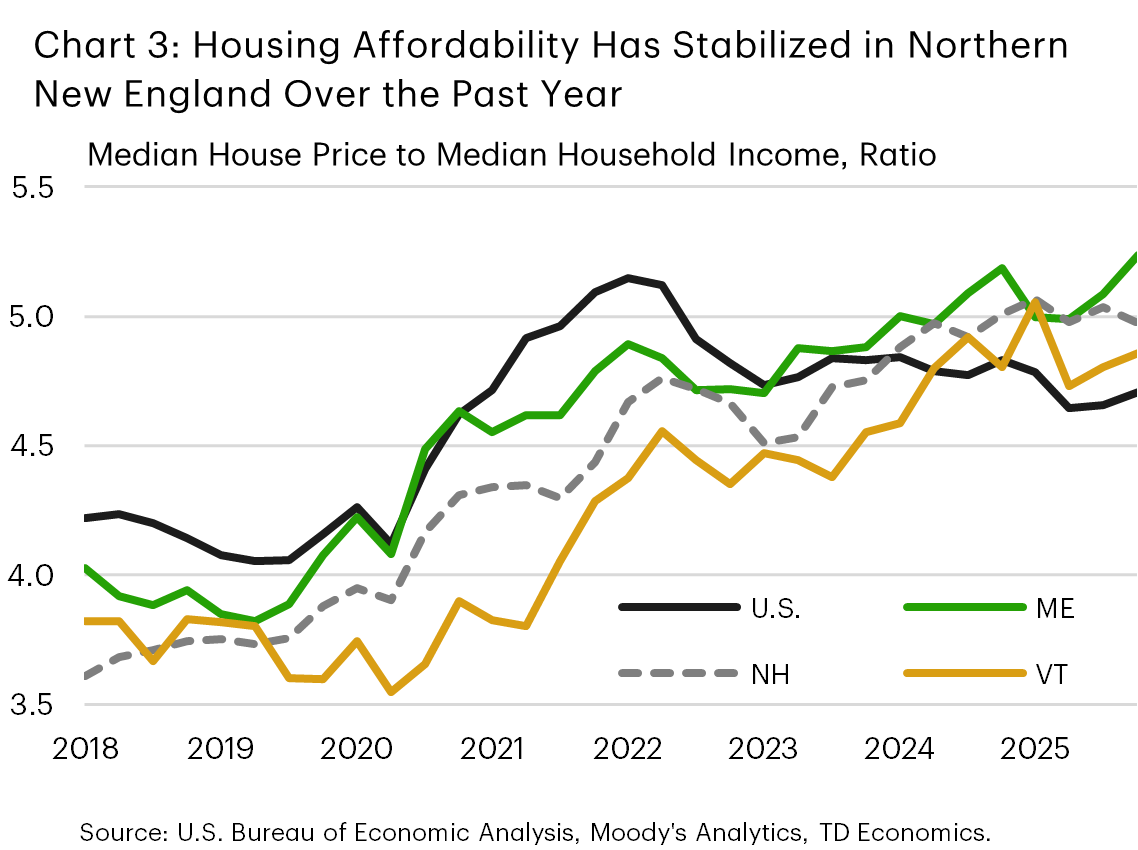
Housing momentum also differs meaningfully across the three states. Maine’s price momentum has reaccelerated, New Hampshire continues to record positive but more measured appreciation, and Vermont’s pricing has softened. This pattern is consistent with a region where limited supply continues to support prices, while affordability and local demand constraints are beginning to weigh more heavily (Chart 3). For 2026, house prices are expected to grow 4.5% in Maine, 2.7% in New Hampshire, and 1.4% in Vermont.
Middle Atlantic (NJ, NY, PA)
New Jersey: Trade and Cost Pressures Keep Growth in Check
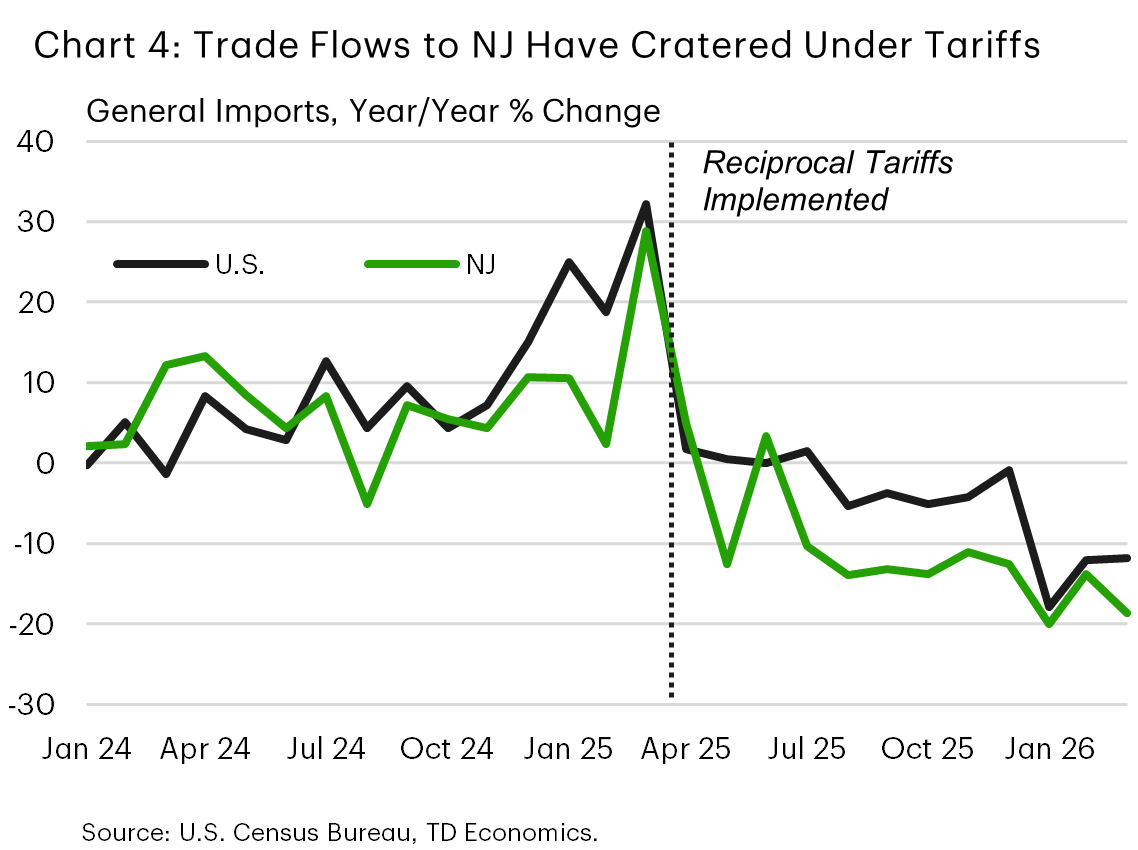
A number of New Jersey’s key sectors, including its trade, logistics, and dense corporate-services platform, continue to face headwinds related to elevated uncertainty. The trade & logistics sector has struggled, with imports to the state down 20% year-on-year (Chart 4). Aggregate growth continues to benefit from proximity to the strong tech and finance activity in New York City, but the region's high costs also continue to create challenges for the state. Samsung recently announced that it would be moving its U.S. headquarters from Englewood to Texas, relocating 1,000 jobs in the process. For 2026, we expect real GDP growth to track closely to the nation at 1.9%.
Payroll employment has flatlined over the past three months, making New Jersey one of the weaker labor markets in the region. This is not a sharp contraction signal, but the lack of momentum points to subdued hiring and limited follow-through from the state's industry growth drivers. The unemployment rate has moved sharply lower over the same period, driven by a shrinking labor force. This has brought the state's unemployment rate down to 4.8% - well below its 2025 peak of 5.5% but still roughly half a point above its long-term average. For 2026 we expect the unemployment rate to average 4.8% as hiring activity recovers gradually through the second half of the year.
Hiring in New Jersey is narrower than its diversified structure would normally imply. Logistics and trade-related activity are contending with tariff uncertainty and inventory caution, while construction has weakened and office-based services are facing selective corporate restructuring. This leaves employment more dependent on non-cyclical sectors like health care and education. The economy is in a stable position, but cyclical hiring activity remains constrained by elevated trade and energy price uncertainty.
Housing is sending a firmer signal. New Jersey’s house price index has strengthened over the past three months, and year-over-year growth remains among the more robust in the region. That momentum suggests that supply constraints and location advantages are still outweighing affordability headwinds, even as the labor market backdrop has become less supportive. We expect house prices to grow 5.0% in 2026, before easing to 3.6% in 2027.
New York: Tech & Finance Powering One of the Strongest Expansions in the Nation
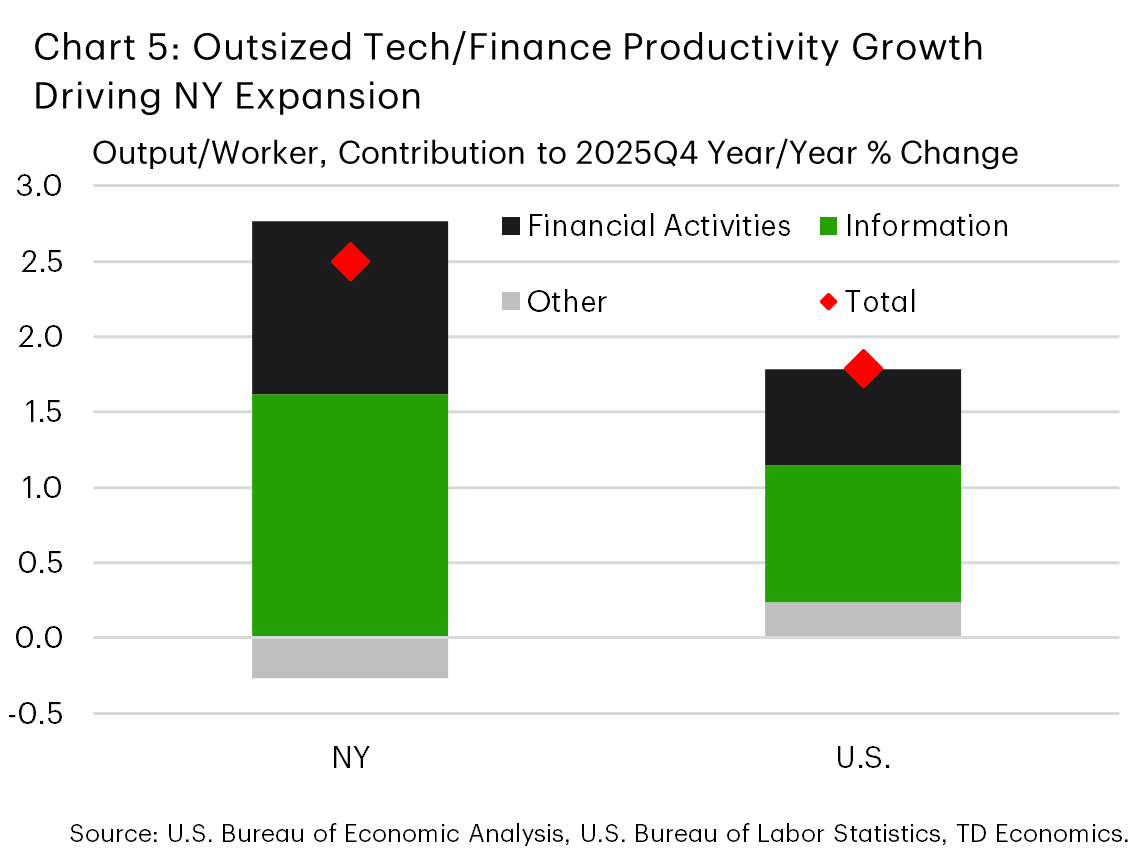
New York’s outlook continues to be led by finance and technology as the boom in AI continues to bolster the state's high-value added service sector. In 2025, New York's economy grew by 2.9% — third fastest in the nation. However, roughly 86% of this growth came from productivity growth in the financial activities and information industries (Chart 5), illustrating the skewed composition of the current expansion. We expect real GDP growth to decelerate gradually to 2.2% in 2026, but note that the composition of the state's growth makes it vulnerable to both upside and downside risks.
Hiring in New York has softened modestly over the past three months, leaving New York’s labor-market signal weaker than its output profile. The state's large health care sector is the only consistent driver of gains, while other industries fluctuate between gains and losses month to month. Hiring momentum has become more cautious elsewhere amid elevated trade and energy uncertainty, suggesting that firms are investing in capacity and technology without immediately translating that investment into headcount expansions. This suggests that firms are scaling through technology, automation, or balance-sheet productivity. New York’s expansion therefore remains powerful, but its benefits are increasingly concentrated in the highest-productivity parts of the economy.
Despite weak job growth, the unemployment rate has held steady over the same period, as the uptick in labor force participation recorded over the past 12 months has slowed and eased upward pressure on labor supply. The state's labor force participation rate is now roughly equal to the nation for the first time in history, which marks a significant milestone for the state. In terms of the near-term, we expect the unemployment rate to average 4.5% this year before falling to 4.3% in 2027.
Housing momentum has cooled more visibly in New York than in most other Northeast states. In April alone, prices fell by nearly 2% month-on-month, marking a meaningful deceleration. While this decline is unlikely to be repeated, the uptick in mortgage rates in the second quarter is likely to sustain pressure on demand and, by extension, prices. For 2026 we expect house prices to grow 2.1%, followed by 2.6% in 2027.
Pennsylvania: Growth to Remain Durable Amid Growing Headwinds
Pennsylvania’s outlook is anchored by its defensive services base and diversified industrial structure. Together, these features provide a steadier performance than the more finance- or trade-sensitive parts of the Northeast. Health care, education, and professional services all contribute to a more balanced profile, even as tariff uncertainty and higher interest rates weigh on goods-producing sectors. The state is not positioned for rapid acceleration, but its mix should support a relatively durable growth path. Real GDP growth is expected to be 1.8% in 2026, followed by 1.5% in 2027.
Employment growth picked up in late 2025 but slowed back to the national average coming into 2026. The unemployment rate edged slightly lower at the start of the year but has been stable in recent months as labor force growth rebounded to keep pace with employment growth. Pennsylvania's growth profile should allow the unemployment rate to remain stable in 2026 around 4.2%.
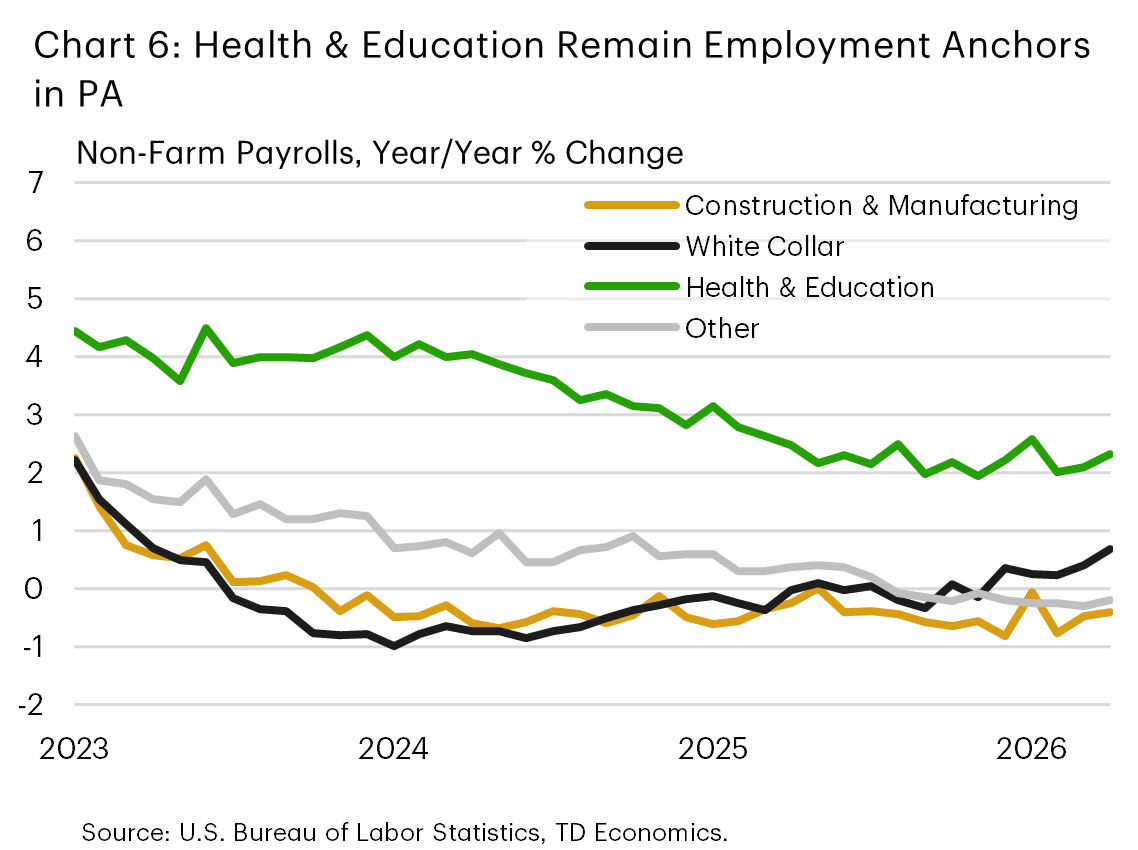
At the industry level, employment trends have been nuanced. Construction hiring has been volatile in 2026, but year-to-date payrolls are roughly flat, likely reflecting the elevated economic uncertainty and higher interest rates. Manufacturing job growth rebounded modestly in recent months but is still down nearly 1% year-on-year after shedding jobs throughout 2025. The health & education sector remains a stabilizing anchor for the state (Chart 6), but other service sectors have continued to see subdued hiring rates. 2026 is likely to be another year in which elevated uncertainty constrains job growth to the state's large non-cyclical sector.
Housing momentum remains constructive and more balanced than in the Northeast region’s more supply-constrained markets. Pennsylvania’s house price index has advanced over the past three months, with prices up 3.6% year-on-year in April. This suggests that demand is holding up while affordability has not deteriorated as sharply as in several coastal markets. Near-term conditions should support continued price growth, though the pace is likely to moderate as financing rates remain near a 10-month high. House prices are expected to grow 3.4% in 2026 and ease to 2.8% in 2027.
Upper South Atlantic (DC, DE, MD, NC, VA, WV)
DMV (DC–Maryland–Virginia): Federal Drag Fades, Recovery Uneven
The DMV economy continues to heal gradually as the impact of federal funding cuts recedes. Energy price volatility and geopolitical uncertainty have modestly softened the regional outlook for this year. Even so, decent underlying momentum should keep the DMV region’s expansion on track, creating a cautiously positive backdrop.
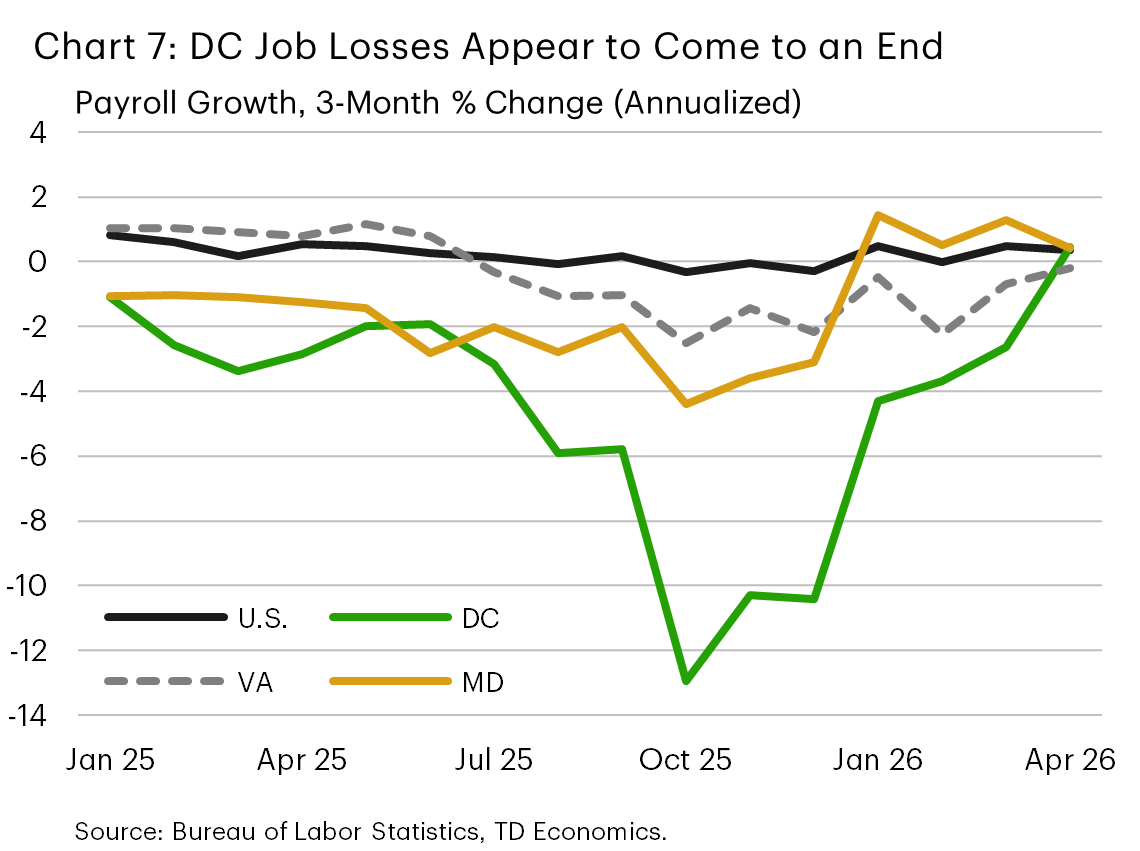
Recent labor market trends across the DMV paint a mixed picture. Virginia’s unemployment rate has remained flat near 3.8% recently, while Maryland’s rate has risen a touch to 4.4%, broadly in line with the national average (4.3%). D.C.’s jobless rate remains elevated at 6.2%, but has declined from a recent cyclical peak of 6.7%, reflecting a modest improvement in job growth. Payroll growth in the District has recently turned positive for the first time since early 2024 – a trend even more evident when federal government employment is excluded (Chart 7). These gains, however, remain narrowly concentrated in professional and business services and accommodation. Improving hotel fundamentals – supported by rising occupancy and a gradual firming in room rates – suggest D.C.’s hospitality sector should provide additional support ahead.
Recent investment announcements in defense, aerospace and advanced manufacturing point to additional runway for growth, particularly in Virginia. Avio USA is establishing a $500 million rocket propulsion facility in southern Virginia, creating more than 1,000 jobs, while L3Harris is expanding capacity in central Virginia ($1.3 billion investment; 350 jobs). More recently, Jabil announced a new power-distribution equipment facility in Prince George County that is expected to create 350 jobs. Additional investments from Blue Sky Innovators and Umbra Inc. (~300 jobs combined) reinforce Virginia’s role within the defense and space ecosystem. AI-related investments also hold significant promise for the state – Stack Infrastructure’s planned $100 billion data center campus could ultimately support up to 2,500 jobs over the coming decades if fully realized.
Maryland’s gains are more selective but meaningful. A Port of Baltimore expansion at Sparrows Point is expected to generate roughly 1,100 union jobs while enhancing the state's long-term logistics capacity. In defense technology, LufCo is developing a microelectronics R&D and manufacturing facility (120 jobs), reinforcing the state’s niche in advanced manufacturing.
Expectations for improving labor market conditions bode well for housing, but near-term momentum is likely to remain constrained. The recent energy shock, while now on track to dissipate, has weighed on household purchasing power. Above-average wage growth across the three jurisdictions is providing a modest offset, but elevated interest rates remain an added headwind. Even so, we see scope for financing costs to ease gradually ahead, suggesting the housing recovery will be delayed rather than derailed. Recent data underscore a slowdown in home price growth, with prices declining modestly in D.C. and rising only slightly in Maryland and Virginia. As mortgage rates ease and labor market conditions continue to improve, housing demand is expected to strengthen gradually, with home price growth improving to a range of 1.5-3.0% across the trio by the end of this year.
The region’s performance is expected to improve gradually as 2026 unfolds, but a weak handoff to the year will restrain annual growth. Virginia and Maryland are projected to grow by 1.6% and 1.2%, respectively, this year, supported by private-sector investment and easing federal cutbacks. D.C. is likely to continue lagging at 0.2%, though its outlook is brightening as labor market conditions stabilize.
North Carolina: Resilient Fundamentals Amid Near-Term Headwinds
North Carolina’s economy remains resilient, continuing to outperform most regional peers. Recent data point to renewed vigor, supported by broad-based job gains and a healthy pipeline of private investment. The spring rise in fuel costs and interest rates creates clear headwinds for consumption, but these should prove temporary, with oil prices having already come off recent peaks. Overall, we anticipate the state economy will grow at a healthy clip of 2.4% in 2026 – a touch slower than last year, but still above the national rate.
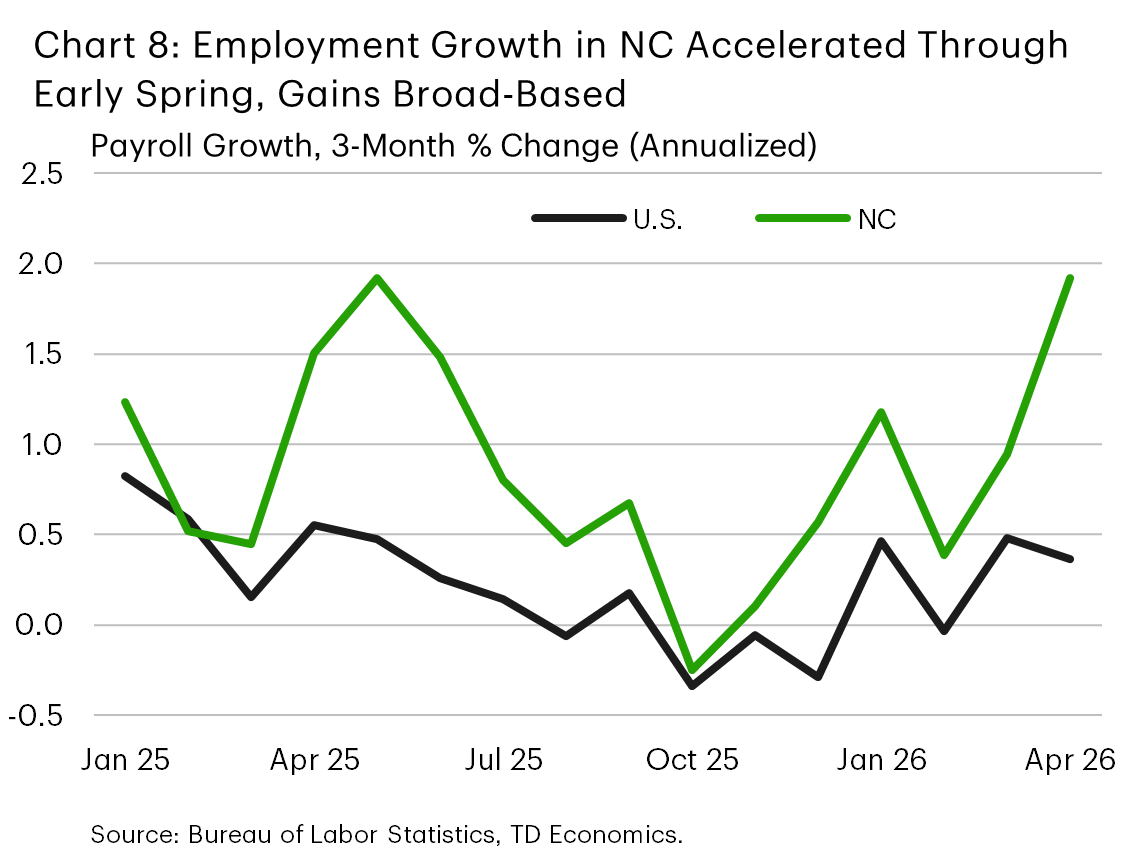
Labor market conditions have firmed. The unemployment rate is hovering around 3.7% – essentially flat and well below the U.S. average. Employment growth has accelerated, with nonfarm payrolls expanding at a 1.9% annualized pace through early spring, far outpacing the national trend (Chart 8). Encouragingly, recent job gains span multiple sectors – construction, retail, professional and tech services, education and healthcare, and leisure & hospitality – signaling broad strength. With the labor force continuing to grow, however, there is room for the unemployment rate to push modestly higher over the near term as job growth normalizes. We anticipate the state's jobless rate will peak at just under 4% before trending lower later this year.
Strong fundamentals and a full investment pipeline are underpinning North Carolina’s healthy outlook. In services, notable expansions include SMBC Group’s (banking) $50 million investment to establish a second U.S. headquarters in Charlotte (2,000 jobs), alongside ongoing footprint expansion from other firms such as JPMorgan (which is adding roughly 400 roles over the next several years). In life sciences, large projects – including AbbVie’s $1.4B Durham biopharma campus (730 jobs), Johnson & Johnson’s Wilson County biologics facility (500 jobs), and Genentech’s expanded Holly Springs biomanufacturing project (roughly $2 billion; supporting more than 2,000 jobs) – will further strengthen the state’s pharmaceutical manufacturing base. Digital infrastructure investment is also accelerating, with Google’s $1B expansion of its data center campus in Lenoir a notable contributor. Green shoots are also visible in other areas like logistics and defense. The U.S. Navy’s 10-year agreement at Kinston’s Global TransPark, supported by roughly $350M in state-funded infrastructure, will expand Fleet Readiness Center East with a new aircraft maintenance facility, supporting over 400 high-skilled jobs. The pipeline has broadened further recently, with US Forged Rings planning an $875M specialty components facility in Hertford County and BorgWarner announcing a $100M expansion in Hendersonville (1,000 jobs combined).
Manufacturing in general, however, remains a mixed picture. Goods exports have underperformed the national growth trend in recent months. Meanwhile, traditional factory employment has made only modest gains recently, reflecting a challenging backdrop of elevated input costs and softer goods demand. At the same time, capital-intensive advanced manufacturing continues to move forward. The state’s industrial footprint is expanding through projects such as TSEA Energy’s $25M high-voltage equipment plant in Eden (160 jobs) and Corning’s optical cable expansion in Hickory, tied to long-term AI/data-center supply agreements with Meta and, more recently, Amazon (1,000 jobs). These investments suggest manufacturing output should remain supported, even as job creation lags, consistent with the sector’s increasingly capital-intensive nature.
Higher interest rates and improved supply have cooled the housing market, but only modestly. Home price growth has slowed to a crawl, while apartment rents are trending slightly lower. Housing inventory has climbed to about 5.6 months’ supply, indicating more balanced conditions than in many nearby states. With borrowing costs likely to ease moderately later this year and the job market healthy, we expect residential activity to firm slowly through late 2026. This backdrop should keep home prices on a moderate uptrend, with the post-pandemic erosion in affordability limiting the scope for stronger gains.
Despite global uncertainty, North Carolina’s entry into 2026 has been solid. Its diversified industry mix, high-skill workforce, and influx of marquee investments have provided a strong foundation. These fundamentals should help counteract near-term headwinds, allowing the state to continue outperforming and likely lead the region once again in 2026.
Lower South Atlantic (SC, GA, FL)
South Carolina: Growth Engines Still Turning
South Carolina’s economic expansion has eased from last year’s +3% region-leading pace. A soft handoff to 2026, combined with more recent obstacles – elevated energy costs and higher interest rates – reinforces this narrative. Yet, despite the expected moderation, the outlook remains broadly positive, supported by major investments, especially in advanced manufacturing, and robust population growth.
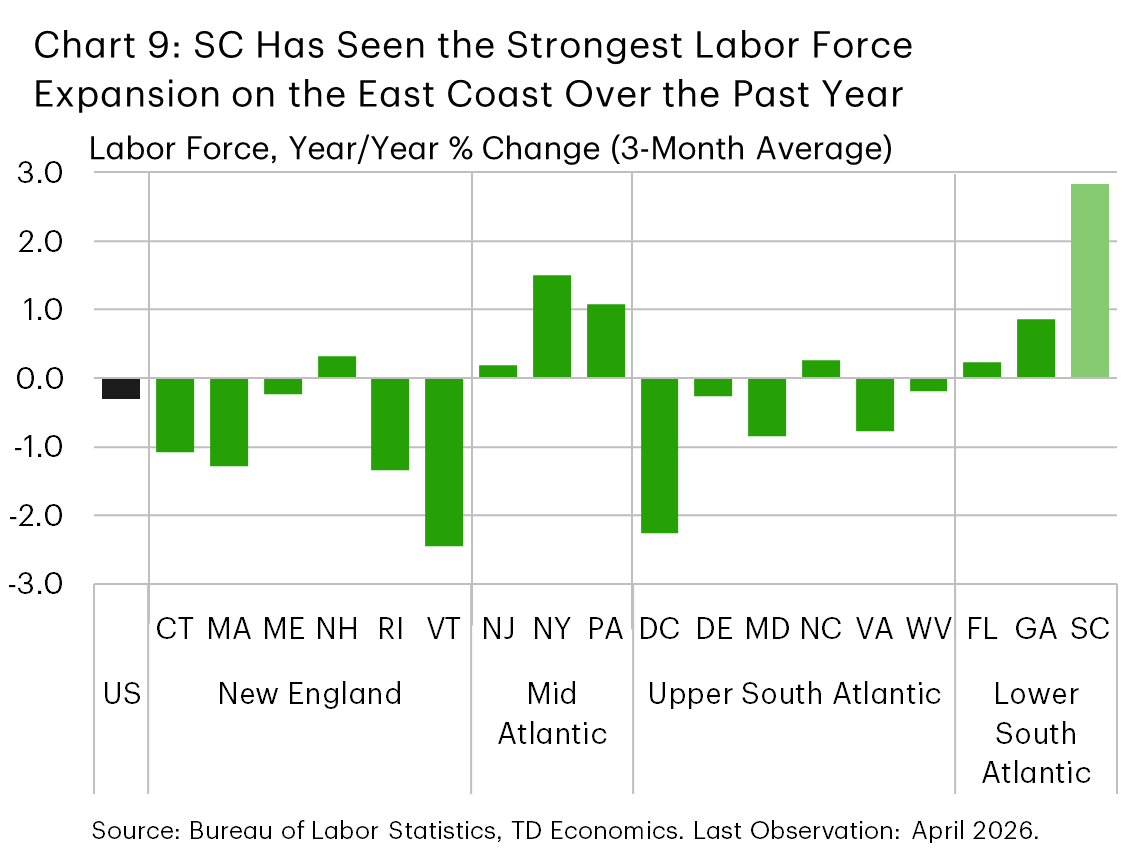
The labor market may appear softer than the national backdrop at first glance – the unemployment rate sits at 4.8% (vs. 4.3% nationally). But this reflects supply dynamics more than weakening demand. The labor force has grown at the fastest pace on the East Coast at 2.9% (y/y), helped by population growth and – importantly – rising participation rates (Chart 9). Hiring has slowed in the payrolls survey, but jobs are still up 0.9% y/y – much better than 0.2% nationally. Other signals point to a still-decent labor market: wage growth is running above the U.S. pace, while initial jobless claims remain muted.
A healthy pipeline of major investments reinforces the state’s constructive narrative, particularly on the manufacturing side. In aerospace, Boeing is expanding its North Charleston 787 Dreamliner site through a $1B project expected to support more than 1,000 jobs over five years, while GE Aerospace is investing $33M in its Greenville facility to expand jet-engine component capacity. Automakers are also deepening their roots: Volvo plans to consolidate Polestar 3 EV production at its Ridgeville plant, while Scout Motors is building a $2B EV assembly plant in Blythewood, with 4,000 jobs expected when fully operational. Other projects in food processing, solar manufacturing and advanced materials — Ferrara’s $675M Orangeburg facility, Suniva’s $350M Laurens Co. plant and USA Rare Earth’s roughly $1.2B Cherokee Co. campus — are expected to create just over 2,000 jobs combined. Most will unfold over several years, but they highlight the state’s continued appeal as an investment destination and promise future growth.
Trade policy remains a persistent risk. South Carolina is the most exposed state on the East Coast to goods trade, with major export categories including cars and aircraft. The administration has proposed broad Section 301 tariffs of 10-12.5% on imports from 60 economies. So far, there are no indications of any retaliatory efforts that would impact state exports. Still, the state also imports plenty of goods from abroad, including auto parts, general purpose machinery, basic chemicals and electrical equipment. The proposed tariffs could raise the cost for many of these imported goods, even as some would likely be spared (e.g., auto parts), with the potential to nudge up inflation and reduce firm profitability. On a more positive note, the recent EU approval of the U.S.-EU trade deal should help limit risks with this important trading partner.
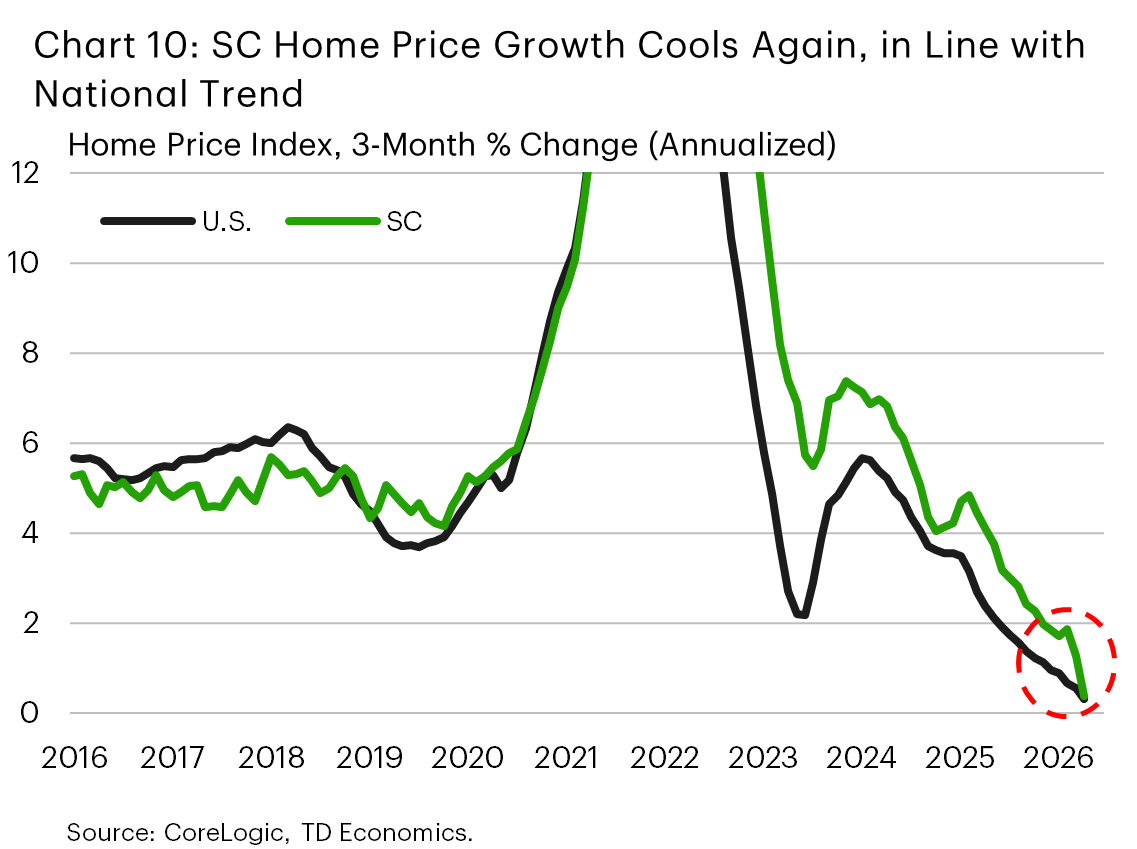
The housing backdrop is mixed. Higher gas prices have squeezed consumers’ budgets, and the recent uptick in mortgage rates is keeping affordability stretched. Home price growth has softened again, with outperformance giving way to a tepid pace in line with the nation (Chart 10). Sales are flat year-to-date. Inventory has edged up but is still lean, so the current price weakness should prove temporary, with a moderately positive trend likely to resume later this year as borrowing costs ease.
All told, a cooler pace of expansion is in the cards, but with growth engines still turning, South Carolina should remain the region’s top performer. We anticipate the state economy will grow by 2.5% this year.
Georgia: Few Employment Drivers, But Decent Investment Pipeline
Georgia’s economy continues to grow, but softness in the labor market points to a subpar performance this year. On the surface, broad labor market statistics still look decent. Wage growth remains strong at just over 5% y/y, above the national pace, while unemployment has held steady near 3.5% so far this year. That stability is notable: Georgia’s labor force has continued to expand at a healthy clip, which would normally put upward pressure on unemployment, but hiring has so far absorbed the added workers. Nonfarm payrolls have risen at a 1.2% annualized pace over the past three months, roughly triple the national trend.
The concern is that hiring remains concentrated in non-cyclical sectors. Healthcare has accounted for essentially all job creation over the past year and has been responsible for 9 out of 10 new jobs so far in 2026. Several important private-sector industries are moving in the opposite direction, including professional and business services, where payrolls have been declining since early 2023; transportation and warehousing, which has softened since mid-2024; and construction, where hiring has recently turned lower. Meanwhile, the housing market remains challenged by affordability pressures and elevated borrowing costs, limiting another potential source of near-term momentum.
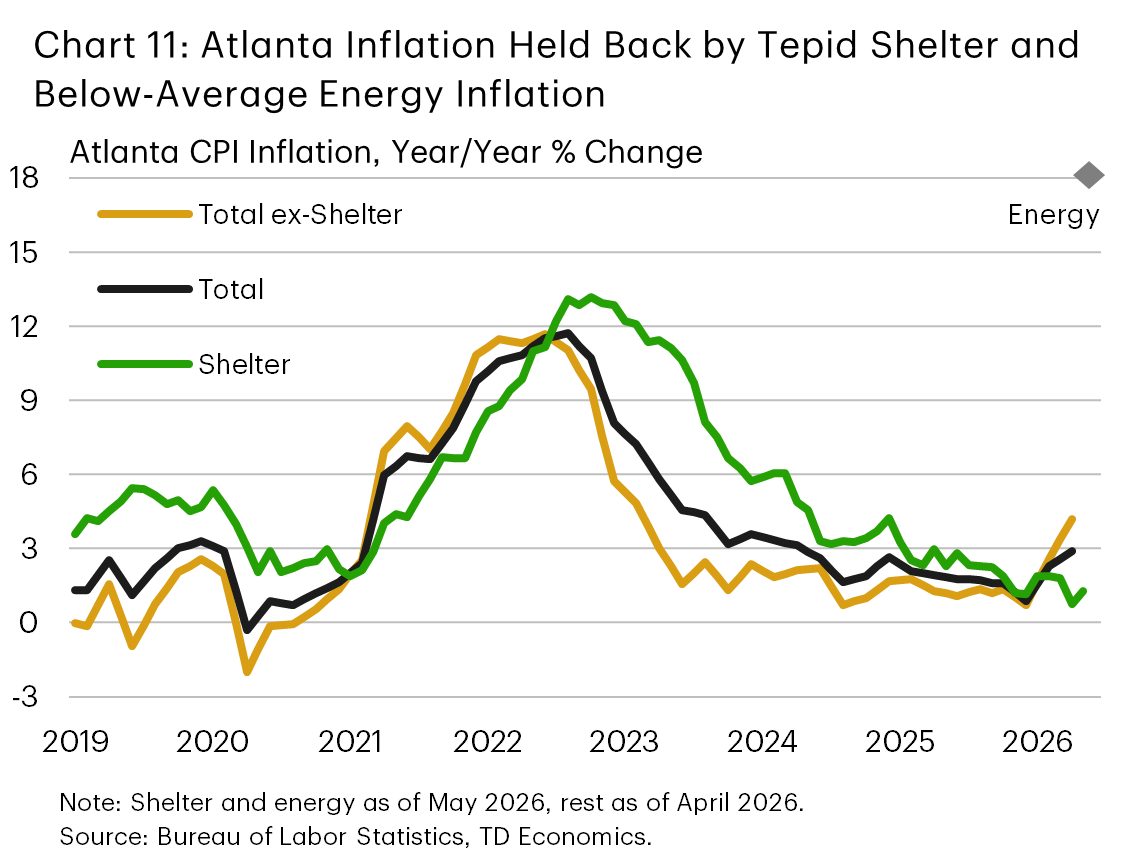
Reduced housing pressures, however, are helping keep a lid on inflation. Indeed, while price pressures in Georgia’s largest metro have risen recently, at 2.9% y/y they remain well below the national rate (Chart 11). This latest upturn reflects higher energy inflation, though this too is running below the national pace. Georgia’s temporary gas tax pause helped cushion consumers from the energy shock, but it expired in early June, a development that would point to renewed pressure over the near term. However, energy prices have turned lower recently, a trend that, if sustained, should help nudge inflation lower.
Georgia still has meaningful green shoots, particularly on investment, which point to the potential for some broadening in growth ahead. Hyundai and LG’s more than $4.3B Bryan County battery joint venture remains a major EV anchor, while Unified Legacy’s $125M Macon-Bibb expansion is expected to create 500 jobs, and the Blue Ops defense manufacturing expansion in Valdosta is expected to add more than 200 jobs. In the medical and health-tech space, UCB’s $2B biologics facility in Gwinnett County is expected to create about 330 jobs, while Glytec’s HQ relocation to Cobb County is expected to add 500. Projects like these should help keep Georgia’s expansion moving, though manufacturing’s larger contribution may come through investment and output, with payroll gains more limited.
Overall, Georgia’s economy is still poised to expand, but a narrower growth base limits the upside. We anticipate growth of 2.0% this year – slightly below the national pace.
Florida: Growth to Ease Toward National Pace This Year
Florida’s economy is normalizing after an exceptional growth run over the past five years. Activity has cooled alongside slower in-migration, moderating job growth, and ongoing housing market softness. The spring rise in energy prices and borrowing costs has weighed on consumers too, but these headwinds appear largely cyclical. We anticipate Florida’s growth will continue at a more “average” pace of 2.3% in 2026, roughly in line with the national trend.
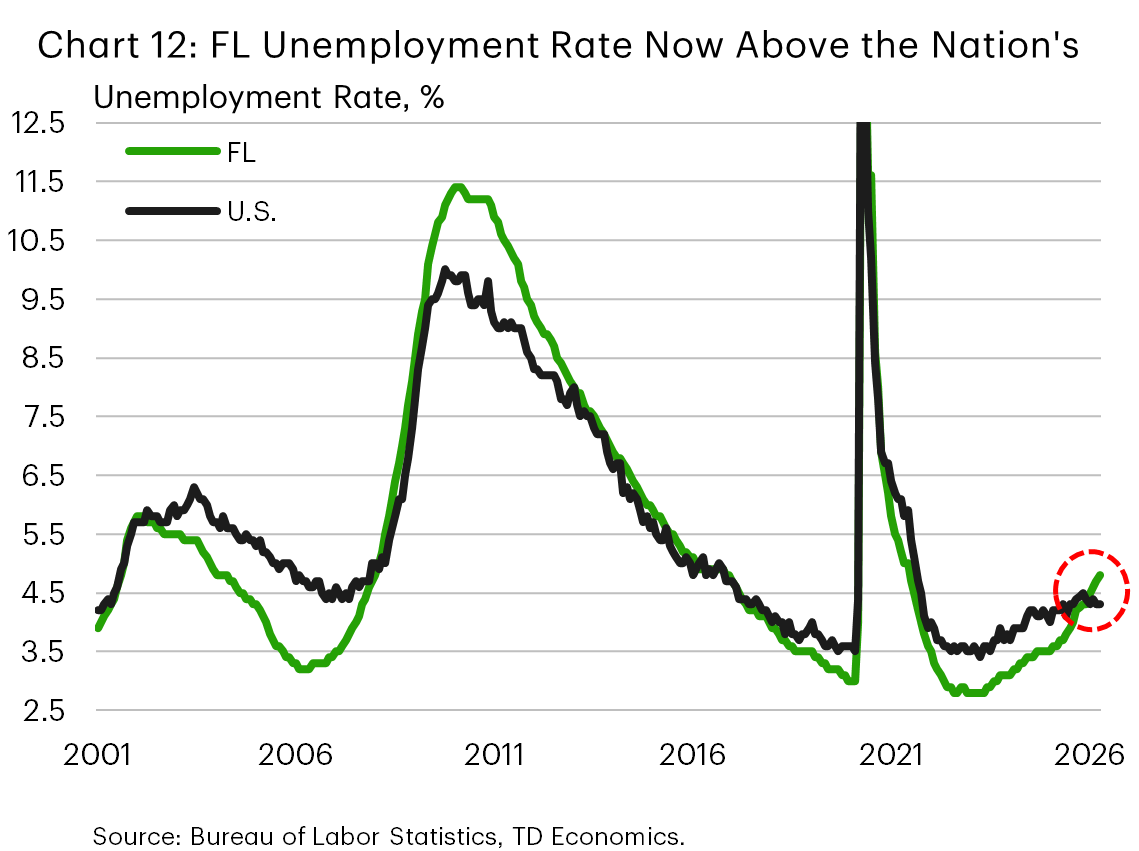
Florida’s labor market is sending mixed signals. Payrolls grew at a 2.7% annualized rate in early 2026 – fastest in the Southeast – with broad-based hiring across several sectors. However, the unemployment rate has also climbed to 4.8% – now slightly above the U.S. average for a change (Chart 12). This divergence reflects a gap between strong employer-reported payroll gains and softer employment readings from the Household Survey – responsible for generating the jobless rate – alongside a modest expansion in the labor force. Statewide wage growth remains elevated (5.3% y/y vs 3.6% nationally), and jobless claims are stable – indicating underlying labor demand persists. As hiring steadies and labor force growth remains muted amid a cooler population backdrop, we expect the jobless rate to peak near 5% before gradually easing late this year.
Florida’s continued success in attracting investment supports the outlook. In aerospace and advanced manufacturing, Blue Origin is executing a $600M Space Coast expansion, adding about 500 jobs. GEICO’s new Tampa campus is scaling hiring, with plans to add up to 1,500 jobs over time — a positive signal for the state’s financial services and insurance industry, which shed some headcount in late 2025. Philip Morris International’s new $50M business services center in Tampa and Cordis’s planned $60M expansion in Miami Lakes – 500 jobs combined – highlight continued inflows into corporate services and medical technology.
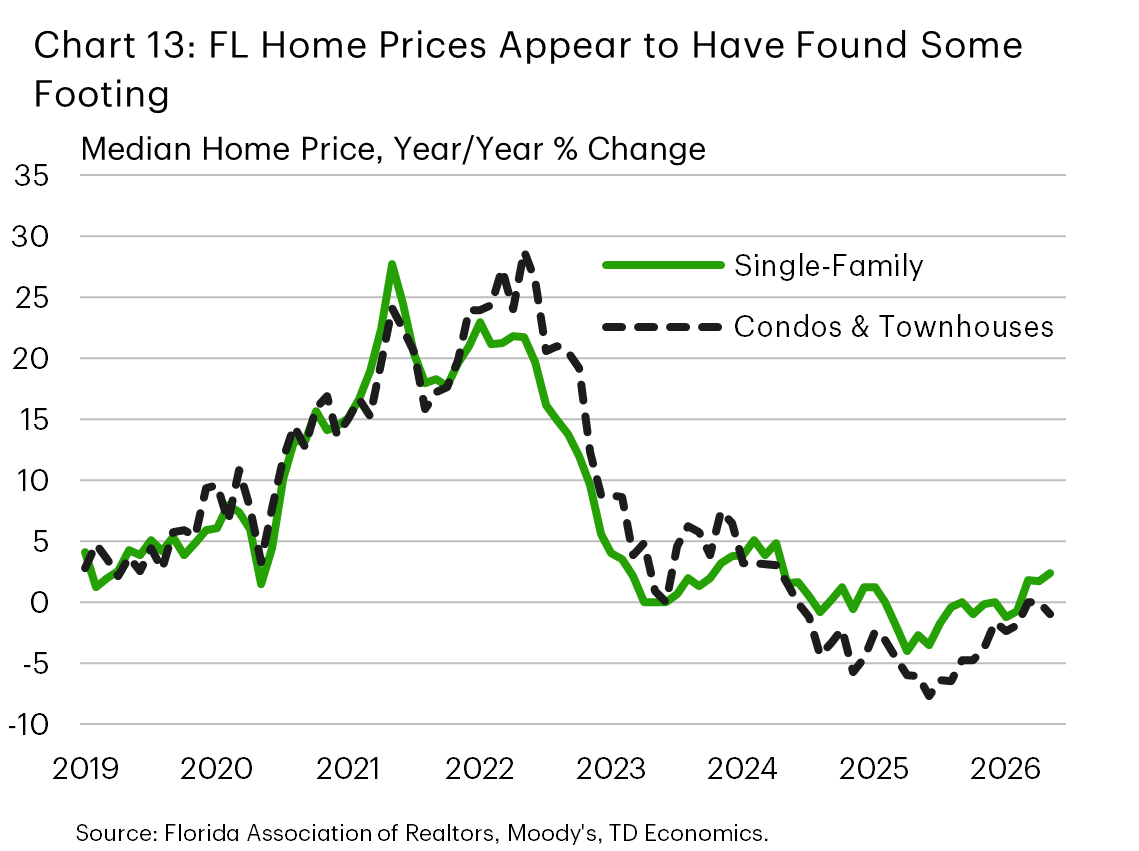
Housing conditions remain uneven but have shown signs of stabilization. Home sales improved toward the end of last year and are now up about 4% (y/y), while prices also appear to have found their footing. The months' supply of inventory has edged lower and remains balanced in the single-family segment (4.7 months), but the condo/co-op segment remains quite loose (8.9 months). Homebuilding continues to trend lower, which should help gradually firm market balances ahead (Chart 13). As labor market conditions stabilize, mortgage rates ease, and migration inflows likely normalize somewhat next year, housing demand should recover gradually. Policy support should also lend a hand – adjustments to condominium safety rules have introduced more flexibility around reserve funding timelines, helping to ease near-term cost pressures. Home prices have scope to move higher as conditions improve. But price growth is likely to remain moderate, at a pace of around 2% annualized by the end of this year and 3% next, given the constraint of an earlier erosion in affordability that has not fully unwound.
Tables
TD State Forecasts
| States | Real GDP (% Chg.) |
Employment (% Chg.) |
Unemployment Rate (Average, %) |
Home Prices (% Chg.) |
Population (% Chg.) |
||||||||||
| 2025 | 2026F | 2027F | 2025 | 2026F | 2027F | 2025 | 2026F | 2027F | 2025 | 2026F | 2027F | 2025 | 2026F | 2027F | |
| National | 2.1 | 2.2 | 2.2 | 0.5 | 0.4 | 0.5 | 4.3 | 4.3 | 4.1 | 1.9 | 1.5 | 2.3 | 0.6 | 0.3 | 0.3 |
| New England | 2.2 | 1.9 | 1.9 | -0.2 | 0.4 | 0.5 | 4.0 | 4.3 | 3.8 | 4.6 | 3.2 | 2.9 | 0.3 | 0.2 | 0.2 |
| Connecticut | 2.4 | 1.8 | 1.4 | 0.4 | 0.4 | 0.3 | 4.0 | 4.9 | 4.5 | 7.0 | 5.0 | 3.3 | 0.4 | 0.2 | 0.2 |
| Massachusetts | 2.4 | 2.0 | 2.3 | -0.5 | 0.5 | 0.7 | 4.5 | 4.5 | 3.8 | 3.7 | 2.3 | 2.6 | 0.2 | 0.1 | 0.1 |
| Maine | 0.6 | 1.4 | 1.4 | 0.1 | 0.3 | 0.2 | 3.3 | 3.2 | 3.2 | 3.5 | 4.5 | 3.1 | 0.5 | 0.3 | 0.3 |
| New Hampshire | 2.1 | 1.8 | 1.7 | -0.3 | 0.1 | 0.5 | 3.2 | 3.1 | 2.8 | 4.9 | 2.7 | 3.0 | 0.5 | 0.4 | 0.3 |
| Rhode Island | 1.1 | 1.2 | 1.2 | 0.5 | 0.2 | 0.3 | 4.4 | 4.4 | 4.1 | 6.0 | 3.8 | 2.9 | 0.4 | 0.2 | 0.2 |
| Vermont | 1.4 | 1.2 | 1.1 | -0.2 | 0.2 | 0.2 | 2.6 | 2.7 | 2.6 | 3.0 | 1.4 | 2.4 | -0.3 | -0.1 | 0.0 |
| Middle Atlantic | 2.5 | 2.0 | 1.8 | 0.6 | 0.5 | 0.4 | 4.5 | 4.5 | 4.3 | 4.7 | 3.2 | 2.9 | 0.1 | 0.0 | 0.0 |
| New Jersey | 1.8 | 1.9 | 2.0 | 0.5 | 0.4 | 0.5 | 5.3 | 4.8 | 4.4 | 6.1 | 5.0 | 3.6 | 0.4 | 0.2 | 0.2 |
| New York | 2.9 | 2.2 | 1.8 | 0.8 | 0.6 | 0.4 | 4.4 | 4.5 | 4.3 | 4.1 | 2.1 | 2.6 | 0.0 | -0.1 | -0.1 |
| Pennsylvania | 1.9 | 1.8 | 1.5 | 0.5 | 0.5 | 0.3 | 4.3 | 4.2 | 4.2 | 4.5 | 3.4 | 2.8 | 0.1 | 0.0 | 0.1 |
| Upper South Atlantic | 1.7 | 1.7 | 2.0 | 0.1 | 0.1 | 1.1 | 3.8 | 4.0 | 3.7 | 2.9 | 1.2 | 2.7 | 0.8 | 0.6 | 0.7 |
| District of Columbia | 0.4 | 0.2 | 1.5 | -2.6 | -3.0 | 1.1 | 6.3 | 6.2 | 5.5 | -1.3 | -1.0 | 1.8 | 0.3 | 0.2 | 0.2 |
| Delaware | 2.3 | 1.4 | 1.5 | 0.8 | 0.4 | 0.8 | 4.8 | 5.2 | 4.6 | 2.7 | 1.8 | 2.6 | 0.9 | 0.7 | 0.8 |
| Maryland | 0.7 | 1.2 | 1.8 | -0.8 | -0.3 | 1.0 | 4.0 | 4.2 | 3.4 | 2.6 | 0.6 | 2.5 | 0.3 | 0.2 | 0.3 |
| North Carolina | 2.7 | 2.4 | 2.3 | 0.7 | 1.0 | 1.2 | 3.8 | 3.8 | 3.8 | 2.5 | 1.2 | 2.6 | 1.3 | 1.0 | 1.1 |
| Virginia | 1.7 | 1.6 | 2.2 | 0.6 | -0.1 | 1.1 | 3.4 | 3.7 | 3.4 | 3.5 | 1.7 | 3.0 | 0.7 | 0.4 | 0.6 |
| West Virginia | 0.5 | 1.2 | 1.3 | -0.2 | 0.0 | 0.3 | 4.2 | 4.5 | 4.4 | 5.2 | 1.9 | 2.3 | -0.1 | -0.2 | -0.2 |
| Lower South Atlantic | 2.7 | 2.2 | 2.4 | 0.6 | 0.6 | 1.4 | 3.8 | 4.3 | 3.9 | 0.2 | -0.4 | 2.4 | 0.9 | 0.6 | 0.9 |
| Florida | 3.1 | 2.3 | 2.6 | 0.6 | 0.7 | 1.6 | 3.9 | 4.6 | 4.0 | -1.1 | -0.8 | 2.4 | 0.8 | 0.5 | 0.9 |
| Georgia | 1.9 | 2.0 | 2.1 | 0.3 | 0.4 | 1.0 | 3.4 | 3.6 | 3.7 | 2.3 | 0.1 | 2.4 | 0.9 | 0.6 | 0.8 |
| South Carolina | 3.1 | 2.5 | 2.6 | 1.3 | 1.1 | 1.5 | 4.5 | 4.7 | 4.0 | 3.3 | 1.1 | 2.7 | 1.5 | 1.2 | 1.3 |
For any media enquiries please contact Oriana Kobelak at 416-982-8061
Disclaimer
This report is provided by TD Economics. It is for informational and educational purposes only as of the date of writing, and may not be appropriate for other purposes. The views and opinions expressed may change at any time based on market or other conditions and may not come to pass. This material is not intended to be relied upon as investment advice or recommendations, does not constitute a solicitation to buy or sell securities and should not be considered specific legal, investment or tax advice. The report does not provide material information about the business and affairs of TD Bank Group and the members of TD Economics are not spokespersons for TD Bank Group with respect to its business and affairs. The information contained in this report has been drawn from sources believed to be reliable, but is not guaranteed to be accurate or complete. This report contains economic analysis and views, including about future economic and financial markets performance. These are based on certain assumptions and other factors, and are subject to inherent risks and uncertainties. The actual outcome may be materially different. The Toronto-Dominion Bank and its affiliates and related entities that comprise the TD Bank Group are not liable for any errors or omissions in the information, analysis or views contained in this report, or for any loss or damage suffered.