U.S. East Coast Trade Exposure:
Less is More When Tariffs Hang in the Balance
Admir Kolaj, Economist | 416-944-6318
Date Published: February 13, 2025
- Category:
- US
- Trade
- State & Local Analysis
Highlights
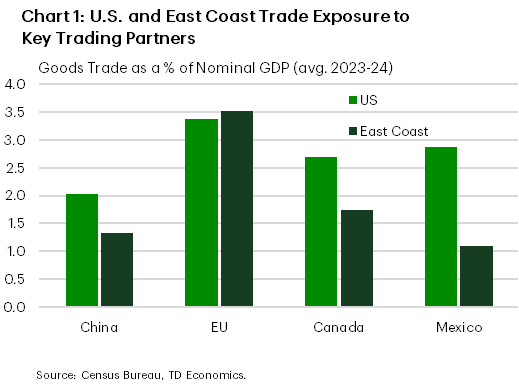
- Canada, Mexico, China and the EU are America’s top trading partners. With import tariffs under consideration, or in the case of China recently implemented, East Coast states have a range of exposures.
- States on the eastern seaboard tend to have a slightly lower exposure to overall ‘goods’ trade with China, Canada and Mexico, compared to the U.S. average, and a modestly higher exposure with the EU.
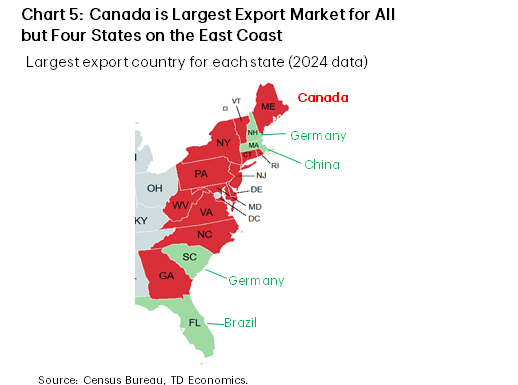
- There are a handful of notable exceptions like Maine and Vermont, which are highly exposed to trade with Canada. Canada is also the number one export destination for all but four states on the East Coast.
- South Carolina stands out with a higher exposure to trade with China and the EU, thanks in part to its bustling transportation sector. All else equal, under broad import tariffs with retaliation by trading partners, the Palmetto State could stand to be hit harder than most states in the region.
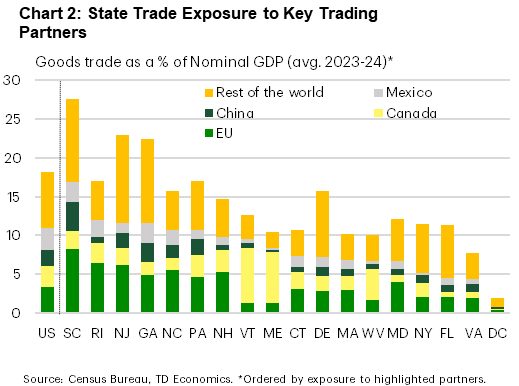
Canada, Mexico, China and the EU are America’s top trading partners, accounting for 60% of total U.S. ‘goods’ trade combined (Chart 1). These countries have also been singled out recently for potential import tariffs by the new administration, and in China’s case a new 10% tariff on all goods imports came into effect Feb 4th. Tariffs will affect states differently, with the higher a state’s trade exposure to the affected trading partners, the higher the potential negative impact. This report examines trade exposure for East Coast states to each of these key trading partners – Canada, Mexico, China and the EU – to shed light on how the potential impacts may vary throughout the region (Chart 2).
How Tariffs Affect the Economy
The impact of import tariffs on a given region will depend on the details. These include the countries involved, the products targeted, the tariff rate, whether the country levies retaliatory tariffs, and how long the tariffs are in place. While we have seen some detail on what this could look like, including on the retaliation side of things, clearly there are still many unknowns. To clarify, although there’s the potential for some onshoring on increased production to take place in the U.S. over the long term, the near-to-medium term impacts are negative. Import tariffs impact economies through the following direct channels:
- Depending on the availability of non-tariffed substitutes, import tariffs can raise costs for businesses and lead to supply chain disruptions as companies may try to shift suppliers. If substitutes are readily available, importers may not be able to pass on the costs to U.S. customers, and will either have to absorb the cost of the tariff or may no longer import the good. If there are no easy substitutes, the U.S. business may need to absorb much of the cost hurting their profitability and competitiveness, or pass the cost onto their customer, raising inflation.
- Most countries facing import tariffs will choose to retaliate by placing tariffs on American goods they import. This could weigh on demand for U.S. goods. Again, the degree to which American businesses are affected will be determined by the availability of substitute goods.
- There are also indirect or second-round effects, which are harder to quantify, can exert an even greater drag on overall economic activity. Local industries linked to trade activity, such as transportation and warehousing, would feel the knock-on effects from reduced trade, providing some moderate drag to domestic economies. Heightened uncertainty and financial market volatility can affect business confidence and investment plans. Also, depending on to the degree to which broad import tariffs pass through to consumer prices, they reduce consumer purchasing power and can reduce consumer demand more broadly for U.S. businesses.
Trade With China has Declined in Importance
Trade between the U.S and China, has declined since the first Trump administration levied substantial tariffs on China. The Biden administration also expanded tariffs on EVs, batteries, semiconductors and steel and aluminum. Total US-China goods trade was the equivalent of around 3% of U.S. nominal GDP in 2017, and has fallen about a third since then, to around 2%. American exports to China are still moderately higher compared to 2017, but Chinese imports have fallen substantially over this period. Given the recent additional 10% tariff levied on China’s imports, they are likely to fall further.
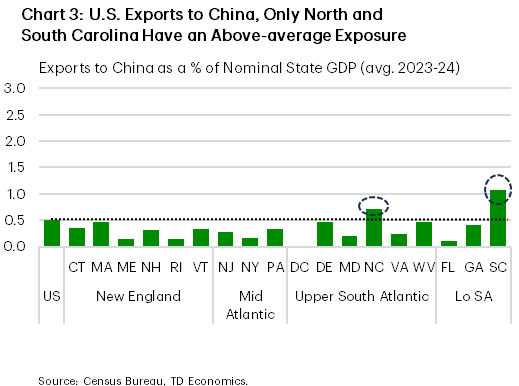
Before shifting down to the state level, it is important to note that state trade data does have some limitations. For instance, in some cases it may overstate export activity for states with major ports, meanwhile certain industries, such as agriculture whose products tend to be sold in bulk, may be more prone to some misallocation at the state level.1 With these caveats in mind, note most states along the East Coast are less exposed to trade with China than the rest of the U.S. – an element that’s not entirely surprising given geographical considerations (Chart 3, 4). This suggests they should be slightly better shielded against the impacts of tariffs. However, the Carolinas are a notable outlier. In South Carolina’s case, the higher degree of exposure is due to its auto exports to China, putting it at risk from retaliatory measures. In North Carolina’s case, exports to China in the pharmaceutical & medicine space dominate.
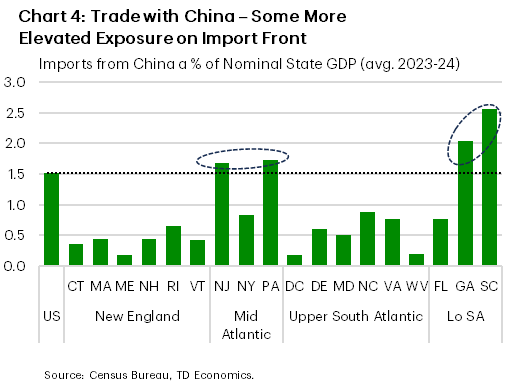
On the import side of things, South Carolina and Georgia have a more notable exposure to imports from China, while Pennsylvania and New Jersey are only a hair above the national level (Chart 4).
Keep Your Neighbors Close (Canada & Mexico)
America’s largest trade relationship is with Canada & Mexico (when combined), and supply chains across the three partners are deeply integrated. This is especially the case for the high value-added automotive segment. Total two-way trade with the two neighbors is nearly triple that with China. However, the East Coast generally has about half of the national average exposure to these two trading partners, with a lower exposure to trade with Mexico particularly notable (refer back to Chart 1).
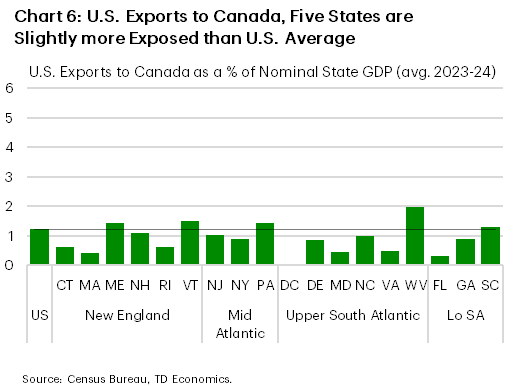
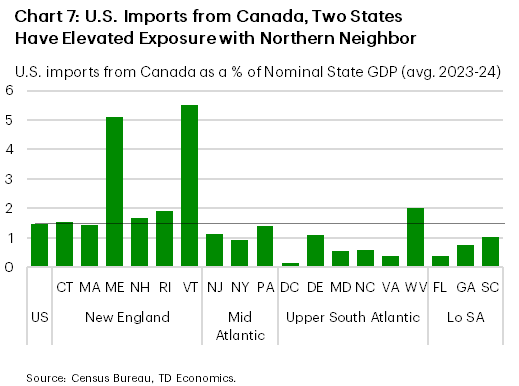
Between the two North American neighbors, the East Coast trade relationship is heavily tilted toward Canada rather than Mexico. In 2023, Canada was the largest export market for all but four states in the region (Chart 5). As such, retaliatory measures by Canada could weigh on demand for East Coast businesses. More broadly speaking, this is true across much of the U.S. Canada is the top export market for 32 states across the nation (36 in 2023). Digging further, two states – Maine and Vermont – stand out as having a larger exposure to trade with Canada, largely due to imports (Chart 6, 7). This makes sense considering proximity.
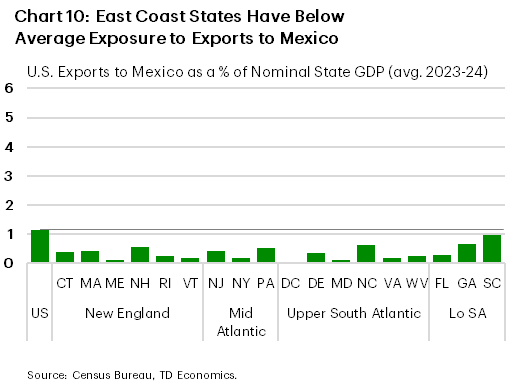
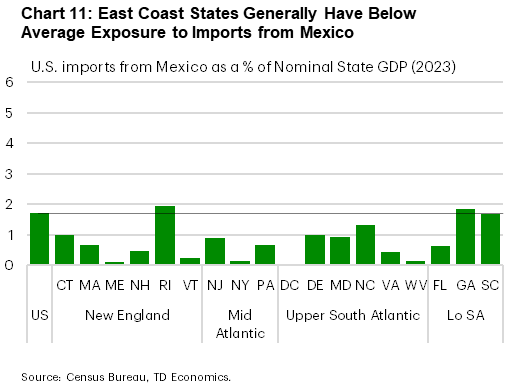
When it comes to trade with Mexico, no East Coast state has a larger exposure than the nation, with ‘export’ exposure to the southern neighbor particularly limited (see Charts 10 and 11 in the appendix). This means that the East Coast region would likely be somewhat more insulated than other parts of the U.S. from the direct effects of import tariffs and potential retaliatory measures from Mexico. Intuitively, this burden would likely fall more on states bordering Mexico. A case in point, Texas – whose trade with the southern neighbor is the equivalent of 10% of its GDP or nearly quadruple the national level – would likely bear the brunt of the direct impacts from tariffs with the southern neighbor.
EU Trade Relationship Carries More Weight
While the EU has been left out of tariff measures so far, President Trump has stated that tariffs on the EU could come “pretty soon”. Goods trade between the U.S. and the EU is larger than that with China, Canada or Mexico (refer back to Chart 1). At the same time, goods trade with the EU is slightly more important to states along the East Coast.
Like the case of China, South Carolina and Georgia have an above-average total trade exposure to the EU. However, several more states are added to the above-average exposure list, including some of the larger ones such as New Jersey, Pennsylvania, and North Carolina.
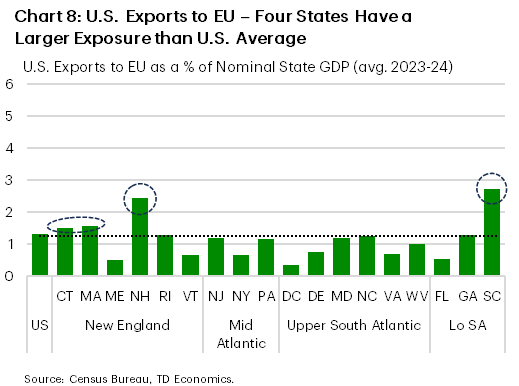
The elevated exposure to trade with the EU is tilted toward imports (Chart 8, 9). Half of states in the region have an above-average exposure to imports from the EU (Chart 9).
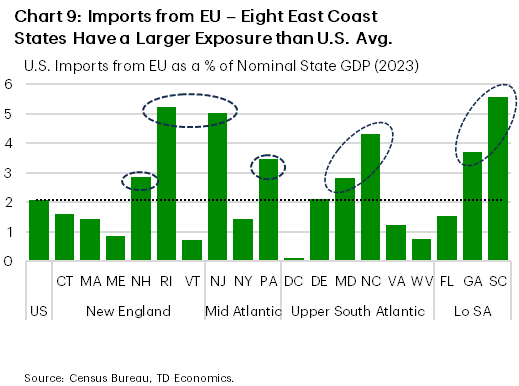
Delving into the states with the largest dependence, South Carolina’s top import is motor vehicle parts. This has the potential to create significant problems for auto manufacturing, either by raising the cost of key parts, or complicating production if companies choose to source substitutes. New Jersey is one of the most exposed states in the region to imports from the EU. If omitting this segment from the overall tally, New Jersey’s trade exposure to the four main trade partners considered in this report, would fall from third place (as shown in Chart 2) to eighth. The Garden State’s top import categories from the EU are motor vehicles, petroleum & coal products, pharmaceutical & medicines, and cleaning compounds. While there may be scope to source products from elsewhere, some will be hard to substitute and will likely cost more depending on if suppliers choose to lower their prices to offset the tariff.
There is generally less exposure on exports to the EU. Only four states in the region have a higher exposure than the nation, though the list does include a couple of large states such as South Carolina and to a lesser degree Massachusetts (Chart 8). This means the region would be slightly less affected by any retaliatory measures from the EU.
Bottom Line
Canada, Mexico, China and the EU are America’s top trading partners. The potential for tariffs raises uncertainty for many industries along the East Coast. The impact of tariffs will not be borne equally by all states. Those that have a greater exposure to affected trading partners, are likely to feel an outsized negative impact from tariffs and potential retaliatory measures when assuming no segment carveouts. Focusing on the East Coast, the region is slightly more exposed than the U.S. average to trade with the EU, and is generally less exposed to trade with China, Canada and especially Mexico. However, state-level data does reveal some nuances. For example, New Jersey has an elevated exposure to trade with the EU, largely due to imports. Meanwhile, Maine and Vermont have an above average exposure with the northern neighbor, so tariffs on Canada could weigh disproportionately on their economies.
Among East Coast states, South Carolina stands out as being the most exposed to trade with the four key trade partners considered in this report. Its key auto sector would feel the pinch from tariffs if there are no carve outs for it, which would weigh on the Palmetto State’s economic outlook.
Appendix
End Notes
- See limitations here https://beta.trade.gov/article?id=State-Data-Methodology For additional context, see Text Box on page 7 of this report https://economics.td.com/domains/economics.td.com/documents/reports/ak/US_EU_Trade_Apr2019.pdf
Disclaimer
This report is provided by TD Economics. It is for informational and educational purposes only as of the date of writing, and may not be appropriate for other purposes. The views and opinions expressed may change at any time based on market or other conditions and may not come to pass. This material is not intended to be relied upon as investment advice or recommendations, does not constitute a solicitation to buy or sell securities and should not be considered specific legal, investment or tax advice. The report does not provide material information about the business and affairs of TD Bank Group and the members of TD Economics are not spokespersons for TD Bank Group with respect to its business and affairs. The information contained in this report has been drawn from sources believed to be reliable, but is not guaranteed to be accurate or complete. This report contains economic analysis and views, including about future economic and financial markets performance. These are based on certain assumptions and other factors, and are subject to inherent risks and uncertainties. The actual outcome may be materially different. The Toronto-Dominion Bank and its affiliates and related entities that comprise the TD Bank Group are not liable for any errors or omissions in the information, analysis or views contained in this report, or for any loss or damage suffered.
Download
Share: