Highlights
- The U.S. economy has been one of the strongest growing advanced economies since the pandemic. This growth has been due mainly to increases in labor productivity.
- The U.S. is unique in seeing its rate of labor productivity – economic output per hour worked – improve relative to its pre-pandemic average.
- It remains to be seen whether America’s strong rate of labor productivity growth will be maintained, but with continued rapid advancements in AI, there is a good case that it will.
- In the meantime, in combination with faster-than-anticipated population, strong productivity growth explains why America’s economic growth has exceeded expectations, while wage growth and inflation – not withstanding recent setbacks – has moderated.
The mood on the U.S. economic outlook has shifted dramatically over the past year. Fears of recession, which rose to a fevered pitch a year ago, have quieted. With ongoing momentum, expectations for economic growth over the next year have moved steadily higher.
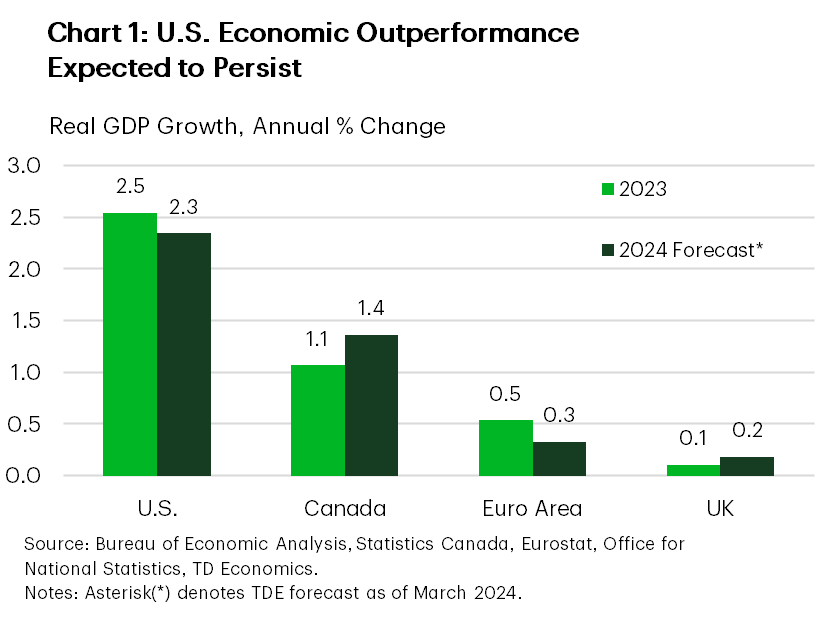
Other advanced economies are not as fortunate. The UK fell into a technical recession at the end of 2023 and economic activity in the euro area has been stagnant since the end of 2022. Canada has not fared much better – despite rapid population growth, real GDP expanded just over 1% in 2023. Modest improvement is expected across advanced economies over the course of this year, but the U.S. is likely to remain at the top of the leader board (Chart 1).
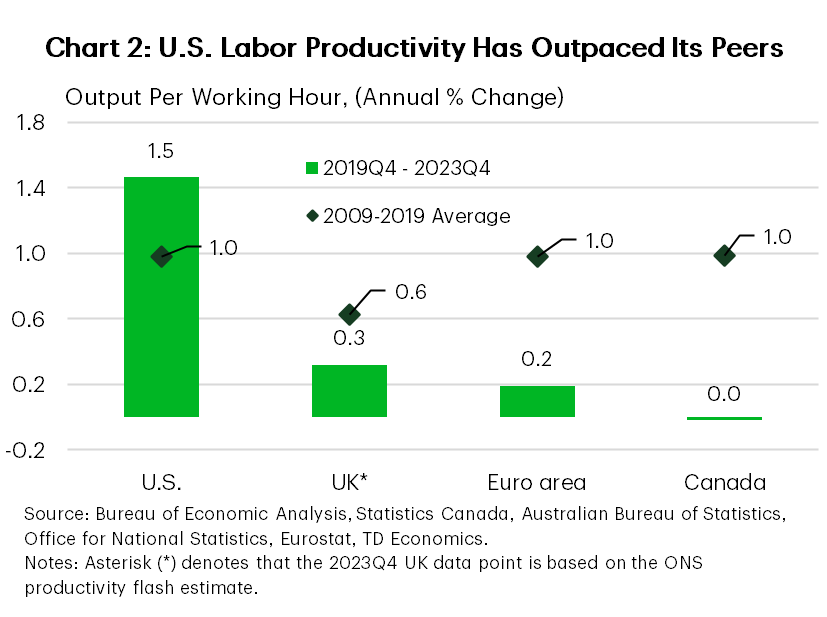
America’s economic outperformance is attributable to several factors including healthy consumer balance sheets, a ramp up in high-tech investment, and ongoing fiscal support. But, just as important, on the supply side, economic growth has been due mainly to gains in labor productivity. This is unique among advanced economies. Since the pandemic, America’s peers have seen a slowdown in labor productivity (Chart 2).
Faster labor productivity growth means a higher speed limit for economic growth without fostering inflation. Even as labor compensation growth has remained steady, and rebounded in real terms, strong productivity has brought down U.S. unit labor costs – the average cost of labor per unit of economic output. With the unemployment rate at a near-record low and job openings still elevated, getting more out of the existing workforce has given a new lease to the American economic expansion.
The initial increase in U.S. productivity in the immediate aftermath of the pandemic was cyclical and is a pattern observed over past business cycles. However, it’s more recent acceleration may prove more lasting as artificial intelligence (AI) adoption continues. Technology-driven productivity growth, in turn, implies higher investment demand and interest rates. With the U.S. leading this charge, its productivity advantage may be reflected in relative asset prices and exchange rates.
A Uniquely American Productivity Story
Since the pandemic, U.S. labor productivity has grown at a robust pace of 1.5% annually. In other advanced economies productivity growth has been scant to negative. The original burst in productivity came alongside pandemic lockdowns, which resulted in labor hours declining, especially in relatively lower productivity sectors, much more than output. These productivity gains were partially given back over the year that followed as activity normalized and positions were re-added to payrolls.
Still, as in past U.S. recessions, the jump in the level of productivity during the pandemic was not fully reversed. The same cannot be said for other advanced economies. Canada’s measured labor productivity skyrocketed during the pandemic, but this was simply a figment of the impact of lockdowns on labor hours, which declined even more severely than output. Canadian labor productivity has reversed course in the years following, declining consistently over the past three years. In the UK, productivity fell in 2020 due to policies that kept workers employed through the downturn in economic activity. It rebounded in 2021 but has since stagnated. The same is broadly true of the euro area.
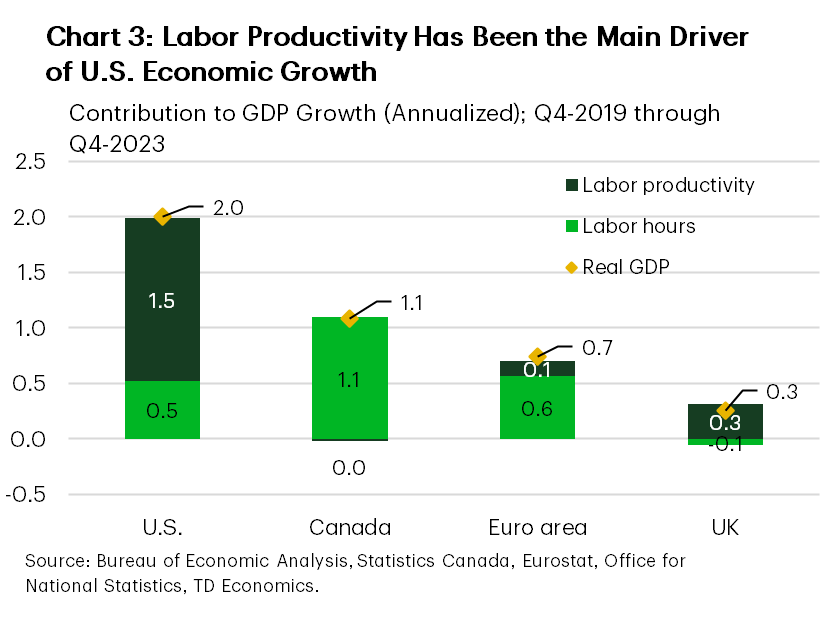
The result over the past four years is that strong U.S. real GDP growth has been powered mainly by rising labor productivity (Chart 3). In Canada, economic growth has been entirely attributable to increased labor hours. The euro area’s productivity performance is slightly better than Canada’s, but it too has relied mainly on increased labor hours to drive growth. The UK has had better productivity growth than the euro area but has the distinction of one of the weakest overall economic growth rates among advanced economies.
Tougher than the Rest
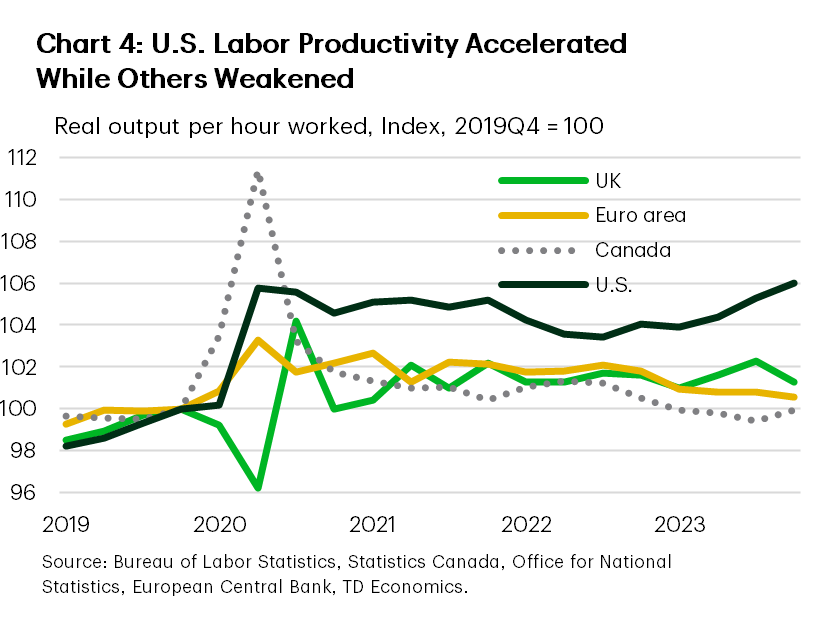
Labor productivity growth has gained speed in the U.S. over the past year even as other countries have continued to slow (Chart 4). The longer the economic recovery continues, the more difficult it will be to sustain growth in labor hours in driving economic growth. In the near-term, a slowing in the labor market is likely necessary to wring the last bit of elevated inflation out of economies. Over the long-run, with aging populations, growth in the working-age population will slow considerably relative to the past. Increased immigration is unlikely to be sufficient to offset this age-related slowdown.1
Labor productivity growth offers a way out. With faster productivity, wages can increase without putting upward pressure on inflation. There are no guarantees that the accelerated pace of U.S. labor productivity growth will be sustained.2 However, explanations for its pick up since the pandemic, including diminishing supply-chain pressures, gains from employee training following the rise in labor turnover during the pandemic, and the greater use of digital technology, have occurred across other advanced economies that have not experienced the same lift to productivity.
Higher Productivity Growth Means Faster Non-Inflationary Wage Growth
U.S. inflation has surprised on the upside over the past three months, sparking concerns that the path back to 2% may prove bumpier than expected. One reason to remain optimistic about the trajectory of U.S. inflation is the strong performance of labor productivity.
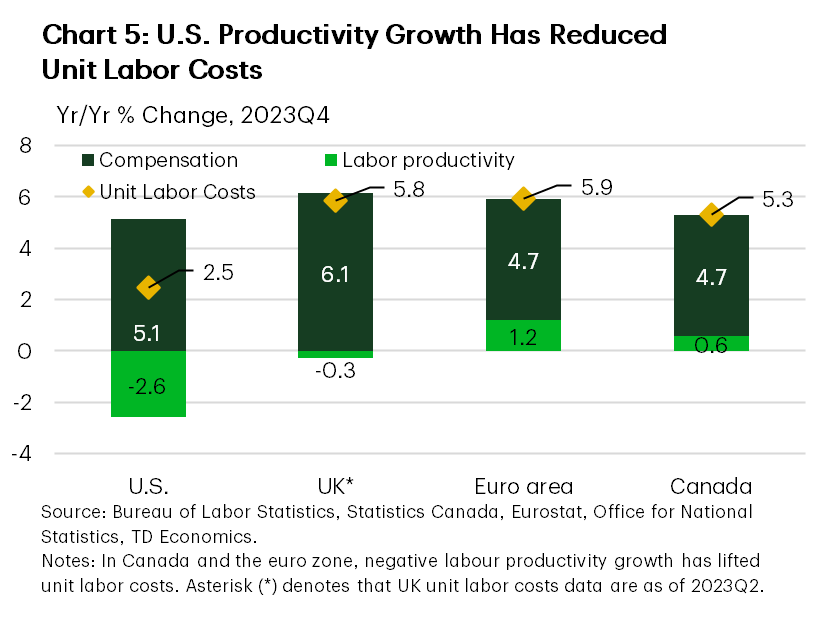
Faster productivity has reduced the cost of labor relative to output. This is best observed in unit labor costs, which measure how much workers earn for each unit of output they produce. Unit labor costs have slowed measurably over the past year and, as of the fourth quarter of 2023, were running at 2.5% year-on-year, down from a peak of 6.5% in early 2022. This contrasts the experience in other advanced economies, where weak productivity and elevated nominal earnings growth have pushed up unit labor costs over the past year (Chart 5).
Even if it is not sustained, estimates for the balance between supply and demand in the U.S. have become more favourable due to the rise in labor productivity over the past year. This lowers both inflation risks and recession risks. An economy that can grow at a trend pace of 2% has more buffer to absorb shocks than one growing at 1% or less, putting the U.S. in a league of its own.
Higher Productivity Underpins Higher Interest Rates
The resilience in U.S. economic growth in spite of a federal funds rate at its highest level in over 23 years, suggests that monetary policy is not as restrictive as previously thought. The productivity story matters here too. Increased labor productivity represents a shift in the investment demand curve, raising its return for any level of interest rates.
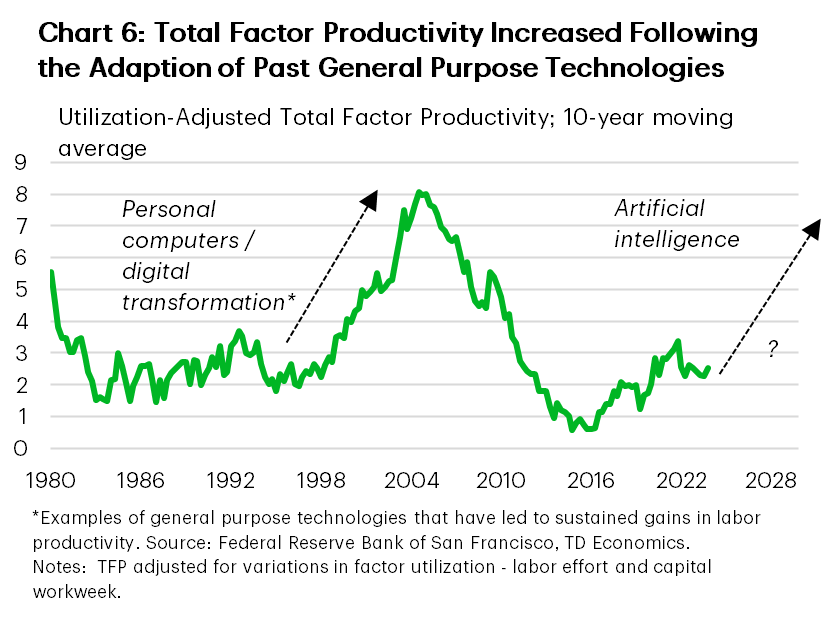
Of course, what really matters here is sustainability, but there are reasons for optimism. Gains in productivity related to investment in generative artificial intelligence (AI) and green technologies are in their early stages and should continue over the next several years. Economic research on the potential for gains from automation suggest they could be substantial.3 Similar sustained gains have been observed following the introduction of past general purpose technologies (Chart 6).
In short, higher labor productivity implies both lower inflationary pressures, but also a higher neutral policy rate. As monetary policy is normalized, fewer rate cuts may be required to keep the economy on an even keel. Bond market investors appear to have validated this view, paring back expectations for how many rate cuts are likely over the next several years.
The Bottom Line
The surge in U.S. labor productivity has put a new lease on the American economic expansion that is unique among advanced economies. While other countries have had their outlooks downgraded, the U.S. has continued to shift higher.
For the Federal Reserve questions surrounding its sustainability will be important in policy deliberations. While the acceleration in productivity to date cannot be pinned on AI or green technology investment, these developments have come at a serendipitous time and stand to gain speed over the next several years. The combination of higher economic growth and interest rates would mark a break from the decade following the financial crisis, implying lower recession risks and more ability for monetary policy to respond to economic shocks with traditional policy tools.
End Notes
- And comes with challenges of its own, especially around building and maintaining adequate public infrastructure and residential housing.
- Based on the advanced GDP estimate, U.S. labor productivity looks to have slowed in the first quarter of this year relative to the pace in 2023.
- Erik Brynjolfsson & Danielle Li & Lindsey R. Raymond, 2023. “Generative AI at Work,” NBER Working Papers 31161, National Bureau of Economic Research, Inc. https://www.nber.org/papers/w31161
Disclaimer
This report is provided by TD Economics. It is for informational and educational purposes only as of the date of writing, and may not be appropriate for other purposes. The views and opinions expressed may change at any time based on market or other conditions and may not come to pass. This material is not intended to be relied upon as investment advice or recommendations, does not constitute a solicitation to buy or sell securities and should not be considered specific legal, investment or tax advice. The report does not provide material information about the business and affairs of TD Bank Group and the members of TD Economics are not spokespersons for TD Bank Group with respect to its business and affairs. The information contained in this report has been drawn from sources believed to be reliable, but is not guaranteed to be accurate or complete. This report contains economic analysis and views, including about future economic and financial markets performance. These are based on certain assumptions and other factors, and are subject to inherent risks and uncertainties. The actual outcome may be materially different. The Toronto-Dominion Bank and its affiliates and related entities that comprise the TD Bank Group are not liable for any errors or omissions in the information, analysis or views contained in this report, or for any loss or damage suffered.
Download
Share: