Highlights
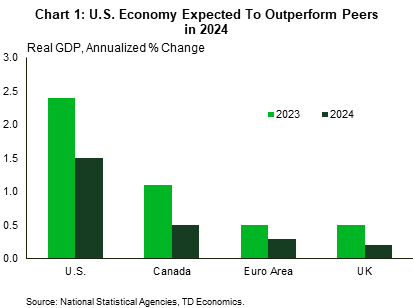
- Despite interest rates reaching a 22-year high, the U.S. economy likely expanded by a robust 2.4% in 2023 – a pace of growth well above any of its peers.
- Last year’s resilience can be traced back to several factors, including a Teflon consumer, a significant ramp-up in construction of semiconductor and EV battery manufacturing facilities and strong fiscal tailwinds.
- Last year’s tailwinds are likely to fade this year, but not completely die out. The U.S. economy is projected to expand by 1.5% in 2024, slightly below its trend growth rate, but well above the more anemic pace of growth expected across other advanced economies.
U.S. economic resilience dominated the headlines in 2023. What started off as a year of recession calls, quickly turned to one of outperformance. While fourth quarter GDP data won’t be released until next week, our current tracking suggests growth slowed from its blistering 4.9% annualized pace in the third quarter to something closer to trend in Q4. For the year, this implies an annual rate of growth of 2.4%. This will far surpass any of its G7 peers (Chart 1), and essentially matches 2019’s performance despite interest rates being nearly 2.5 times higher. So, what’s underpinning this resilience, and perhaps more importantly, is it possible that the economy’s defiance to higher interest rates extends into this year?
U.S. Consumer has a Teflon Coating
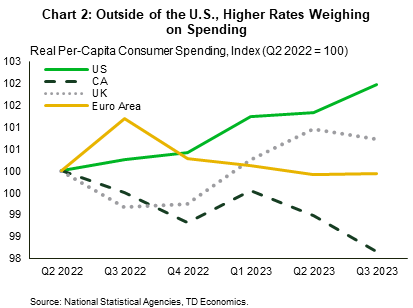
A major factor contributing to the U.S.’s outperformance has been a Teflon consumer. In two of the past three quarters, consumer spending has expanded by over 3%, which is well above its trend pace. Since global central banks began raising interest rates in earnest in Q2-2022, U.S. consumer spending has outpaced all of its peers (Chart 2). In fact, more recent data shows per-capita spending across most other advanced economies having already started to bend under the weight of higher interest rates, while the U.S. continues to expand at a healthy clip.
Consumers have benefited from substantial cash reserves built up during the pandemic, while a tight labor market has boosted job security and driven strong wage gains. While these factors have also been tailwinds across other advanced economies, a 2023 paper published by the Federal Reserve shows both the accumulation and subsequent drawdown of excess savings has been greater in the U.S. The larger pile of liquid savings is a direct result of the U.S. enacting larger fiscal support measures during the pandemic, and more specifically one of the only G7 countries to send multiple rounds of direct payments to households, irrespective of whether their employment situation was impacted by the pandemic.
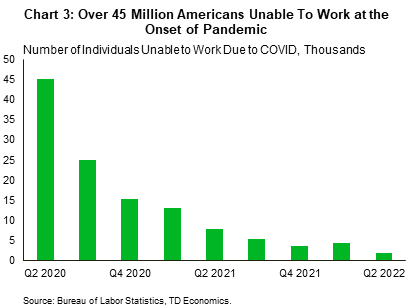
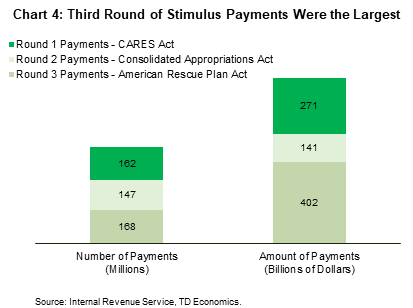
The Bureau of Labor Statistics estimates that at the beginning of the pandemic, roughly 45 million workers employment situation was impacted by the pandemic (Chart 3). Yet, data reported by the Internal Revenue Service shows that nearly 162 million support payments were made through just the March 2020 CARES ACT (Chart 4). As the pandemic progressed, the number of individuals whose compensation remained impacted significantly declined, yet the number of payments made through subsequent stimulus cheques remained disproportionality elevated. The average family of four earning less than $150,000 received $11,400 in total of direct payments through the three rounds of support payments made between March 2020 and March 2021. As the pandemic receded without a substantial increase in unemployment, families have clearly felt comfortable spending that windfall.
Another reason why the U.S. consumer has outpaced its peers in the face of higher interest rates can be traced back to mortgage structure. The U.S. is the only country in the G7 where the 30-year fixed rate mortgage predominates. While Canada and most European economies also offer fixed rate products, the interest rate generally resets on a more frequent basis, thereby exposing homeowners to higher interest rates sooner. From that perspective, homeowners outside of the U.S. have likely held on to their savings cushion as a precaution, anticipating higher debt servicing costs. The story has been very different in the U.S., where an estimated 14 million borrowers – or approximately one-third of the outstanding mortgage balances – refinanced between Q2-2020 and Q4-2021 when interest rates were at ultra-low levels. In addition to lowering their monthly mortgage payments, borrowers also used refinancing as a tool to cash in on the equity in their homes, freeing up even more money to spend.
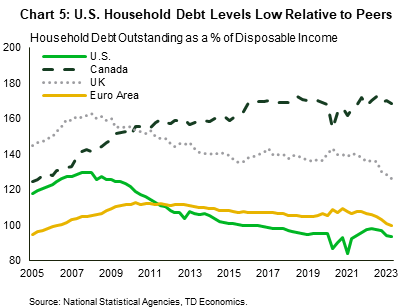
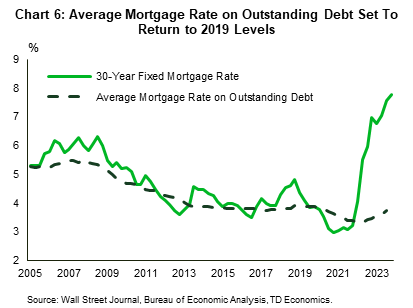
U.S. households were also starting out with relatively less debt going into the current tightening cycle. Debt-to-income ratios remain just off the lows reached in 2011, following the deleveraging cycle that took hold following the Global Financial Crisis. At 93%, the U.S. currently has the lowest debt-to-income ratio across its peers (Chart 5). And with fixed rate mortgages accounting for nearly two-thirds of that debt, households have so far remained largely insulated to higher interest rates (Chart 6).
Business Fixed Investment Also Defying Higher Rates
It’s not just the consumer that’s failing to succumb to higher interest rates. Despite today’s credit conditions being at levels that would normally be associated with sharp contractions in capital expenditures, business fixed investment is instead up over 4% year-over-year after adjusting for inflation. As we have noted in a previous report, much of this strength can be traced back to generous incentives included in legislation that was enacted in late-2022 aimed at greening the economy, reshoring the production of semiconductors, and improving America’s infrastructure. Specifically, the 25% investment tax credit (ITC) included in the CHIPS & Science Act is one of the most generous investment incentives ever enacted. For context, past ITCs have only been on equipment, not structures, with the largest being around 10%. In many cases, the lucrative tax incentives and subsides are more than offsetting the impact of higher interest rates. Over the past year, the CHIPS & Science Act alone has already catalyzed over $200 billion of investment commitments over the next decade, with a significant share of these projects already breaking ground.
While other countries have also implemented incentives and subsides to compete in similar areas, most have not rivaled the generous incentives offered in the United States. And this has had a significant impact on where companies are making capital investments. There have already been instances where companies have threatened to pull out of projects previously committed to unless local governments match the federal subsides offered in the United States.
Fiscal Tailwinds Also Supporting State & Local Governments
The U.S. economy has also benefited from significant fiscal tailwinds over the past year, with the government component of GDP having added on average 0.8 percentage points per-quarter to overall economic growth in each of the past four quarters. For a sector that accounts for a little over 17% of overall output, this is punching well above its weight. Federal and state & local (S&L) spending have provided a roughly equal boost.
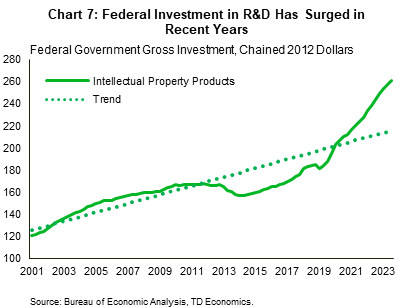
At the federal level, the past year’s strength looks to be attributed to both increased spending across both defense and non-defense sectors, with notable gains coming from gross investment. In no small part, the strength in gross investment has been due to a surge in R&D and software, where today’s spending is roughly 34% above its pre-pandemic level (Chart 7). That said, growth in non-defense consumption expenditures has also been strong, rising by 6.3% y/y in third quarter - well above its 2019 average of just under 1%.
Last year’s strength was equally as impressive at the S&L level. Large federal relief transfers during the pandemic and high tax receipts through 2021 and 2022 led to a massive accumulation in S&L government revenues. The Dallas Federal Reserve estimates that these ‘excess savings’ accumulated through the pandemic were as high $1.3 trillion. Much like the consumer, S&L governments have started to drawdown some of the accumulated savings over the past year. One area of focus has been hiring. While job growth at the S&L level significantly lagged the private sector through the early stages of the recovery, it accelerated notably in 2023, averaging monthly gains of 48,000. That said, employment across the sector has only recently surpassed its pre-pandemic level and with job openings at the S&L level still 45% (or roughly 250,000) above its 2018-2019 average, we are likely to see further gains in hiring through at least the first half of this year.
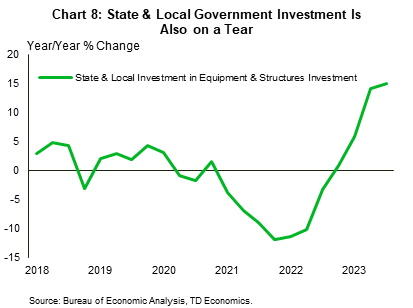
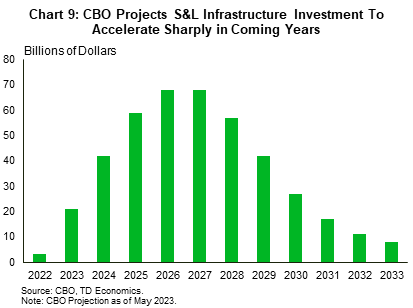
Another source of strength for S&L governments has been an increase in investment from the Infrastructure Investment & Jobs Act (IIJA). The IIJA was passed in 2021 and directed $1.2 trillion of federal funds towards transportation, energy, and climate projects, most of which is distributed via S&L governments. Over the past two years, S&L gross investment has accelerated sharply, with notable gains in both structures and equipment investment (Chart 8). To date, $435 billion in public infrastructure projects have been announced, with the lion’s share aimed at improving road and bridge infrastructure. However, other projects related to broadband, clean energy, and water infrastructure have also been announced. The CBO expects that outlays related to the IIJA will continue to climb over the coming years – providing a sustained thrust from S&L government over the medium term (Chart 9).
Outperformance to Be Repeated, But Gap Likely to Narrow
America’s outperformance is likely to persist into 2024, but its lead is likely to shrink. For starters, excess savings have largely been depleted, and the job market has cooled, both of which should contribute to greater consumer caution this year. Moreover, the end of the student loan forbearance program last October means that 27 million borrowers have started making regular student loan repayments, chewing into household budgets, and leaving less for discretionary spending.
From a business investment standpoint, with over two-thirds of the announced projects related to the incentives in the Inflation Reduction Act and CHIPS & Science Act having already broken ground, last year’s strength is unlikely to be repeated in 2024. However, other areas of business investment related to transportation are still recovering from the pandemic. This is maintaining a longer tail on pent-up demand, as companies have struggled to replace aging fleets in recent years due to supply shortages. But, with auto production having recently returned to pre-pandemic levels, manufacturers have started fulfilling backlogged orders. With capital investments in trucks, trailers, and other autos still 18% below pre-pandemic levels, we are likely to see a further push in transportation equipment over the coming quarters.
On the fiscal side, S&L spending also looks to have further room to run. S&L coffers remain flush, which should continue to support hiring, particularly given the ongoing labor shortage the industry is still facing today. Moreover, S&L governments are being pushed to pass along accumulated non-pandemic relief funds to households and businesses through direct transfers and/or tax cuts, which could create additional tailwinds for both businesses and households. Lastly, unspent COVID relief funds allocated through the American Rescue Plan must be obligated (i.e., designated for specific uses) by the end of FY2024 and spent by FY2026, which means the spending push could continue over the next few years.
At the federal level, the story is a bit different. Since the mid-term elections, no new fiscal expansion packages have been passed. While lawmakers have recently announced a bipartisan agreement that would revive expired tax breaks for businesses and increase the child tax credit for low-income families, the bill still faces major hurdles of getting through both the House and Senate. Moreover, conservative spending caps put in place through the Fiscal Responsibility Act will significantly limit discretionary spending in FY2024 and FY2025, with only moderate increases in defense spending and a small reduction in non-defense spending.
Lastly, monetary policy will remain well into restrictive territory for some time. Although inflation has come down faster than expected over the past year, ongoing imbalances in the labor market remain, and still pose a threat to the disinflationary process. As a result, Fed officials will likely need to see further progress on both the inflation and labor market fronts before pulling the trigger on rate cuts. And even once the Fed starts cutting rates, the glide path on the fed funds rate is likely to be more gradual than prior cycles, keeping the real funds rate well into restrictive territory through the first half of 2025.
That said, economic growth is still expected to expand by 1.5% this year, which is only slightly below the economy’s potential (or trend) growth rate (1.8%). This is a stark contrast to America’s G7 peers, which are all expected to grow at a far more anemic pace.
Disclaimer
This report is provided by TD Economics. It is for informational and educational purposes only as of the date of writing, and may not be appropriate for other purposes. The views and opinions expressed may change at any time based on market or other conditions and may not come to pass. This material is not intended to be relied upon as investment advice or recommendations, does not constitute a solicitation to buy or sell securities and should not be considered specific legal, investment or tax advice. The report does not provide material information about the business and affairs of TD Bank Group and the members of TD Economics are not spokespersons for TD Bank Group with respect to its business and affairs. The information contained in this report has been drawn from sources believed to be reliable, but is not guaranteed to be accurate or complete. This report contains economic analysis and views, including about future economic and financial markets performance. These are based on certain assumptions and other factors, and are subject to inherent risks and uncertainties. The actual outcome may be materially different. The Toronto-Dominion Bank and its affiliates and related entities that comprise the TD Bank Group are not liable for any errors or omissions in the information, analysis or views contained in this report, or for any loss or damage suffered.
Download
Share: