U.S. Consumer Spending: Still a K, but That’s OK
Ksenia Bushmeneva, Economist | 416-308-7392
Date Published: February 5, 2026
- Category:
- U.S.
- Latest Research
- Consumer
Highlights
- The economic divide between America’s households at the top of the income spectrum and everyone else continued to widen last year. Upper-income households benefited from the still-robust wage growth, strong gains in equity markets, and better access to consumer credit.
- Despite these diverging fortunes, elevated economic uncertainty and a slowing labor market, overall consumer spending has remained surprisingly resilient.
- In 2026, consumer spending is expected to remain solid, supported by easier financial conditions, wealth gains, higher tax refunds and lower taxes, and some stabilization in the labor market.
- Still, the economic divide underneath the surface is likely to widen. The tax cuts are expected to benefit higher income households the most, while a reduction in funding to various government programs will weigh on low-income households.
Across many dimensions, U.S. households’ economic fortunes have diverged. The gap between households at the top of the income ladder and everyone else has widened. This has been referred to as a K-shaped pattern, with the top portion headed higher while the bottom has trended lower. A K-pattern emerged last year in wealth gains, wage growth and labor market outcomes.
Differing consumer realities have been pointed out by corporate America. Budget-friendly companies, like McDonalds, noted that traffic by low-income customers is down. As a result, McDonalds has added more deals and value options to lure back budget conscious consumers. On the other hand, airlines are targeting affluent consumers by adding more premium seats, noting that wealthy consumers continue to travel even as lower- and middle-income households have pulled back.
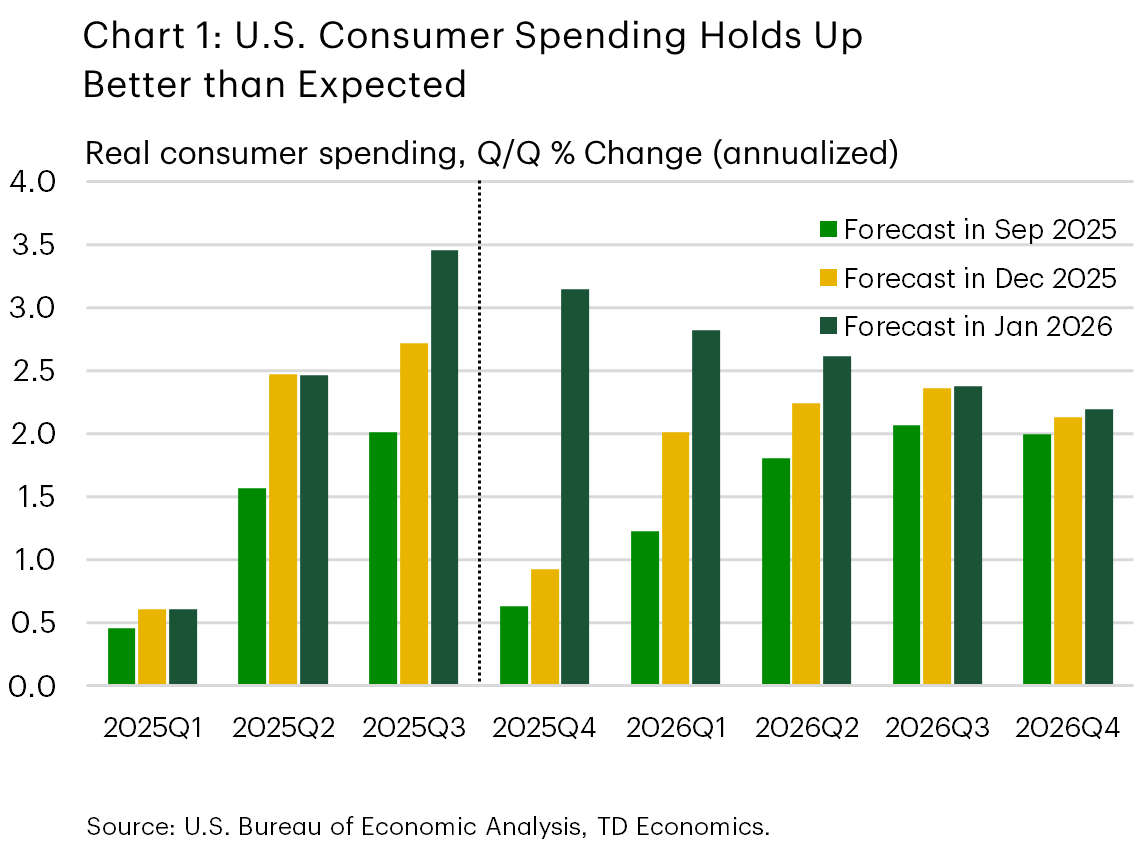
We expect that the K-shaped pattern will be further entrenched by the One Big Beautiful Bill Act (OBBBA) tax cuts and policy changes this year, with benefits skewed to the higher-end of the income distribution. At the same time, other factors such as lower interest rates, some stabilization in the labor market as well as wealth gains (if continued) offer reasons for optimism for continued resilience in overall consumer spending, despite a wider divide. In fact, we have revised our consumer spending forecast higher in 2025 and 2026, as incoming data has consistently exceeded expectations (see Chart 1).
Wealth Inequality Gap Widens
Wealth is one area where the K-shape is clearly apparent. Wealth inequality has been growing since 2022, and the gap between households at the top of the income distribution and the rest widened noticeably last year. As of Q4 2025, the top 20% of households held nearly 72% of total household wealth. To be fair, U.S. wealth distribution has always been disproportionately skewed to higher income individuals, and this figure is close to previous peaks in 2021 and 2017. Still, this is the largest share of wealth held by the top 20% of income earners since data tracking began in 1989.
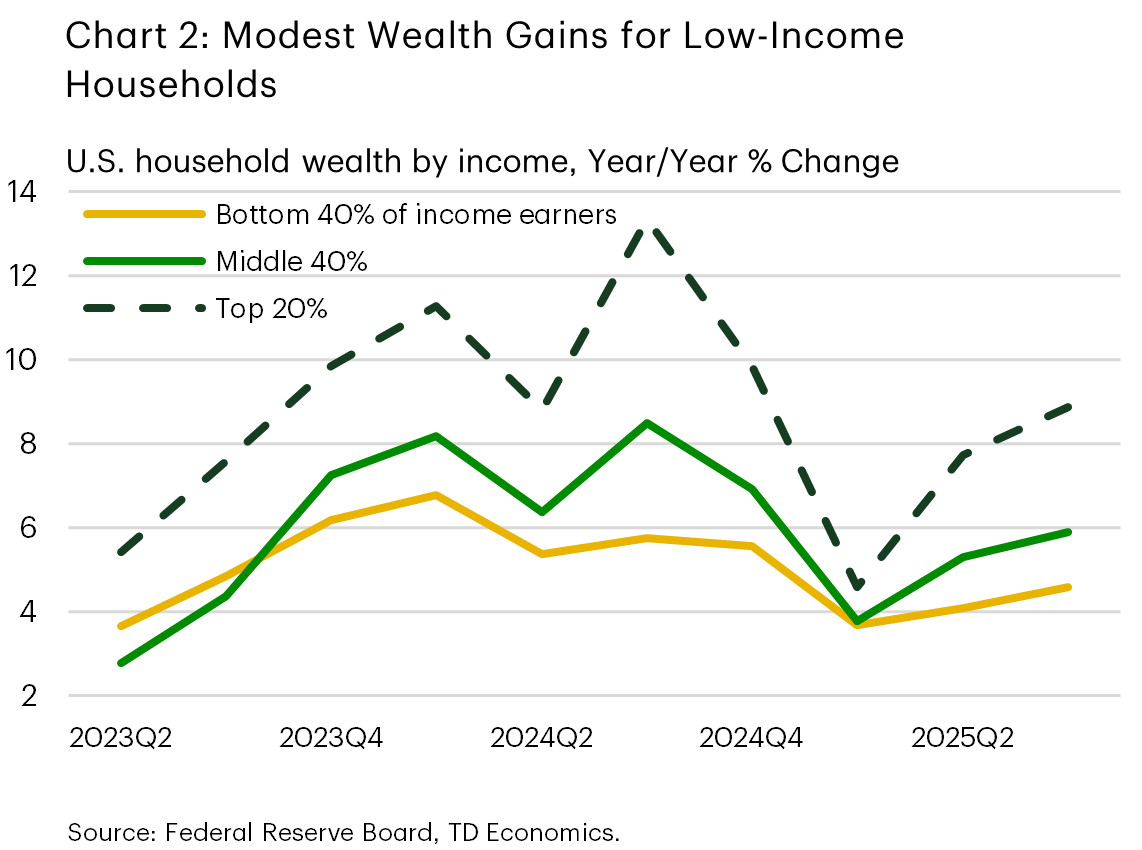
Last year’s rally in equity markets benefited high-income households more, since they hold a greater share of financial assets—particularly equities—in their portfolios. Meanwhile, low- and middle-income households hold proportionally more wealth in their homes, but both home prices and sales underperformed last year, weighing on their wealth gains (Chart 2). The total value of financial assets held by households was up 9.3% year-over-year, with corporate equities rising 20% from the year ago, while real estate wealth was up just 0.9%. A slump in the housing market and barriers to home ownership have contributed to the widening divide among income groups and the diverging economic fortunes of U.S. consumers. Although rising household wealth tends to have a much smaller impact on consumer spending than rising incomes, wealth gains still contribute positively to overall consumption.
Labor Market Cools More for Some than Others
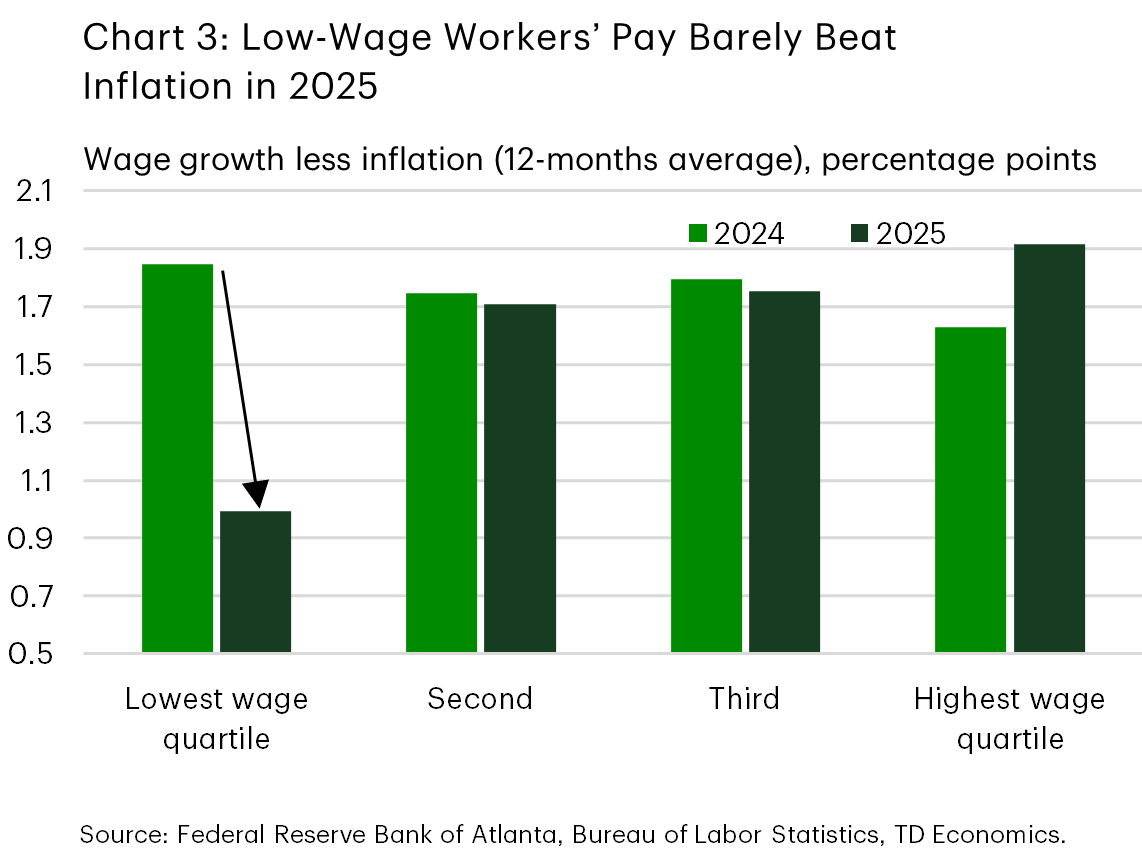
The labor market is another area where outcomes have diverged. Last year, the labor market shifted into a slower gear, putting downward pressure on wage growth. However, the slowdown has been more pronounced for low-wage workers. In 2024, wage growth across the earnings spectrum generally kept pace with inflation. Starting in 2025, however, wage gains for the lowest-paid workers decelerated more sharply than for other groups outpacing the cost of living by only a narrow margin (Chart 3).
After several years in which the cost of essential goods and services rose faster than both wages and overall inflation, this recent wage slowdown is especially punishing for low-income households. Spending on essentials1 makes up 61% and 57% of all spending by households in the lowest and second lowest income groups, respectively. This is higher than it was before the pandemic, leaving less income for discretionary purchases. For households with the highest incomes, spending on essentials makes up 42% of their average spending, which is slightly less than this share was before the pandemic.
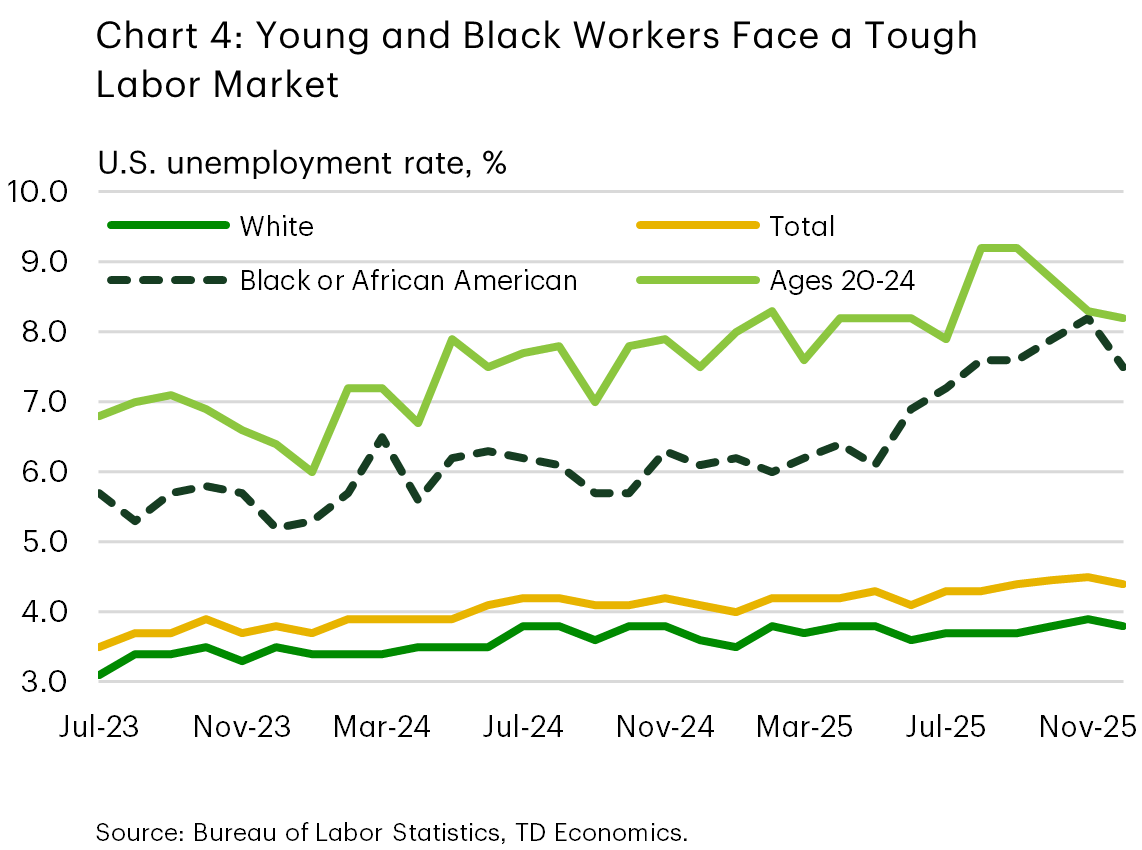
Unemployment rates have also risen more for some groups than others. The unemployment rate among young Americans (ages 20–24), and Black Americans, surged last year, increasing much more than the national average (Chart 4). Historically, these groups are hit harder when the job market slows, with their unemployment rates rising more rapidly. The gap between unemployment rates for these two groups and the national average is high, but not quite as bad as we would see in a typical recession. What is different this time is that, in addition to a weakening labor market, young workers are also facing added pressure from the rapid rollout of AI. Companies are reducing some entry-level jobs due to either realized or expected gains in efficiency and automation (report).2
Consumer Spending Trends: Diverging or Mean-Reverting?
Timely government data on consumer spending trends by income is not available, but alternative indicators reveal the diverging fortunes of U.S. consumers. Credit card spending data shows that lower-income households increased their three-month average card spending by just 0.4% year-over-year (y/y) in December, while spending by those with higher incomes rose 2.4%.3 In contrast, survey-based data from the New York Federal Reserve suggests that spending by low-income households has moderated, but that growth is reported to be broadly similar across income cohorts. Spending growth for lower income households has normalized after an unusually strong period in the post-pandemic years, when robust spending by low-income households was fueled by rapid wage gains in low-wage occupations due to labor shortages, pandemic stimulus payments and a build up in savings from the pandemic lock downs.
Access to consumer credit has also become highly uneven in the wake of rising delinquency rates on credit cards and auto loans in 2023 and 2024. As a result, consumer credit primarily flowed to super-prime borrowers as well as to older consumers who are far likely to default.
Broadly speaking, despite increased divergence among U.S. consumers along some dimensions, as well as unusually high policy uncertainty and a deterioration in consumer confidence, consumer spending has managed to remain surprisingly resilient last year. We estimate that consumer spending advanced by 2.7% (annualized average) in 2025, only slightly slower than the 2.9% pace seen a year earlier.
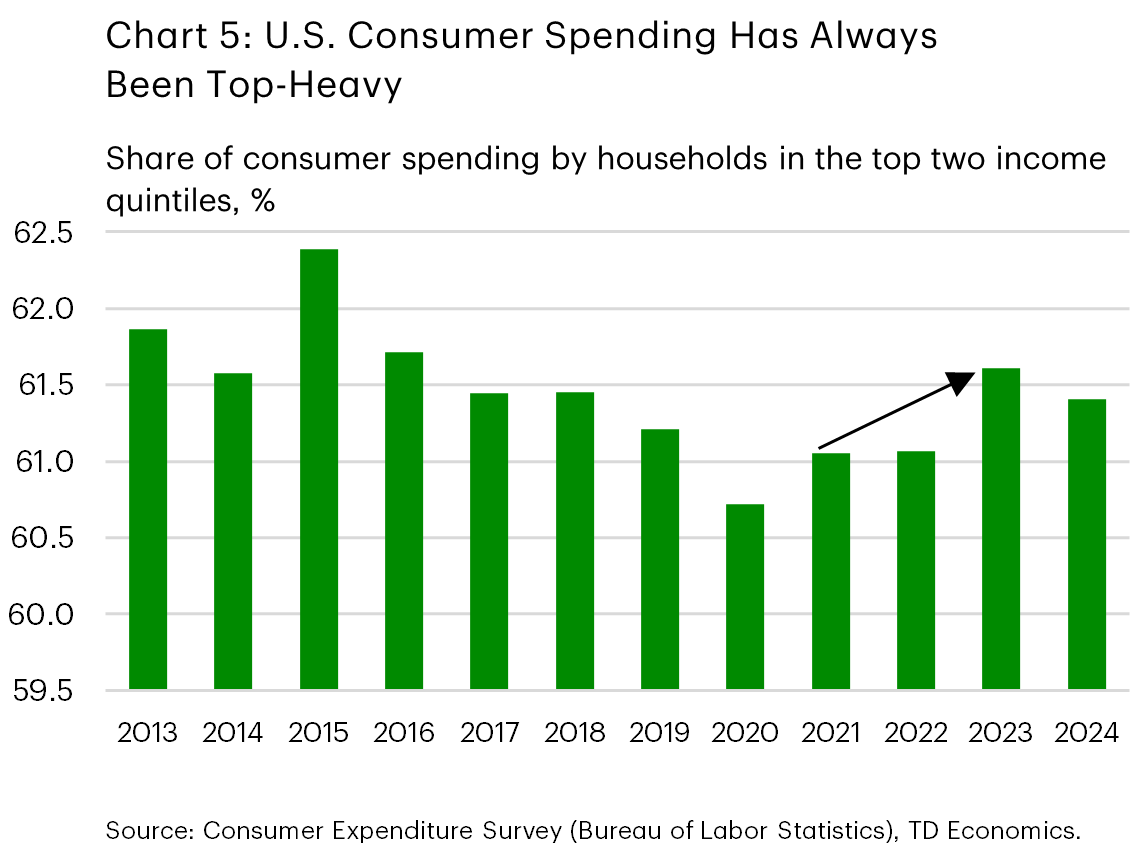
It’s also important to remember that U.S. consumer spending has long been top-heavy, with households in the top two income quintiles making up over 60% of total spending (see Chart 5). Anecdotal evidence suggests these households continue to fare well, with their spending and confidence buoyed by gains in the equity markets and steady wage growth. Notably, consumer spending outpaced disposable income last year, indicating that households are relying more on savings and wealth gains to keep up their spending momentum. Overall, after a brief reversal during the pandemic, the share of consumer spending driven by higher-income households appears to be returning to its pre-pandemic norm.
Consumer Spending in 2026: It’s Still a K but That’s OK
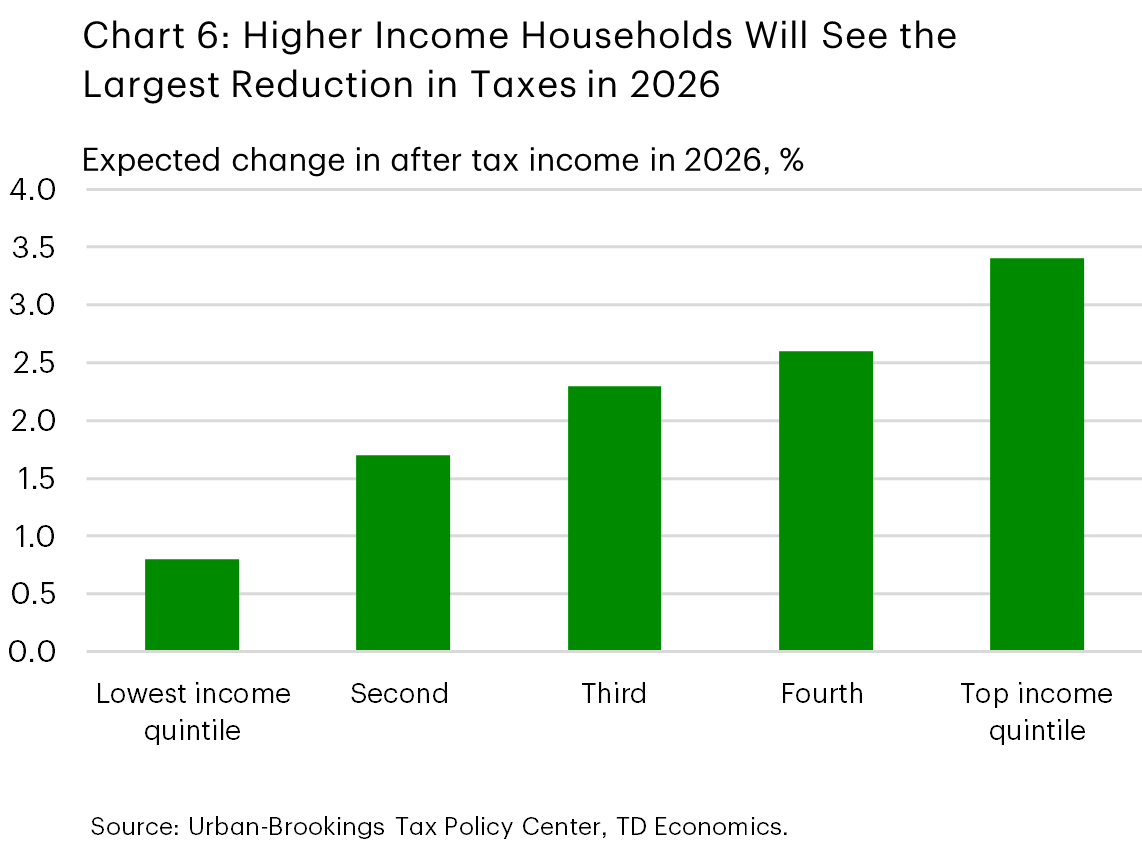
For 2026, we expect K-shaped consumer dynamics to continue in part because of tax changes passed in the OBBBA (Table 1). Distributionally, most of those benefits are expected to flow to middle- and higher-income households (Chart 6). According to the analysis by Tax Policy Center, nearly 60 percent of the tax benefits would go to those in the top quintile (those with incomes of about $217,000 or higher).4 Furthermore, tighter eligibility requirements for SNAP benefits for older adults (ages 54–64), which went into effect on February 1st, could increase food insecurity and financial strain within this group. Analysis by the Congressional Budget Office shows that financial headwinds stemming from reduced SNAP and Medicaid transfers will continue to weigh on lower-income households over the medium term.5
Distributional implications aside, many Americans will see higher tax refunds this year. OBBBA tax changes are effective retroactively to 2025, but the IRS didn’t adjust its withholding tables to reflect the changes, which will lead to higher refunds in the current tax season. Last year the average refund was $3,167, and we estimate that the average refund could be $800 higher this year. This would translate to about $90 billion increase in total refunds versus last year. Households will use a portion of refunds to pay down debt or for investments, however, a significant amount will be spent.6,7 Based on historical tax filing data, the bulk of this amount should be paid by May, providing a boost to disposable income and consumer spending through the middle of the year.
Table 1: New Individual Income Tax Cuts in OBBBA
| Maximum child tax credit increase of $200 |
| Standard deduction increase of $750 for single filers and $1,500 for joint filers |
| State and local tax (SALT) deduction cap increase to $40,000 for taxpayers earning under $500,000 |
| $6,000 additional deduction for seniors that starts phasing out when taxpayers make more than $75,000 ($150,000 joint) |
| $10,000 auto loan interest deduction that starts phasing out when taxpayers make more than $100,000 ($200,000 joint) |
| Deduction for up to $25,000 in tip income that starts phasing out when taxpayers earn more than $150,000 ($300,000 joint) |
| Deduction for up to $12,500 in overtime income ($25,000 joint) that starts phasing out when taxpayers earn more than $150,000 ($300,000 joint) |
The fiscal boost will linger beyond the tax season. About 85% of households are likely to get a tax cut this year, with OBBBA provisions expected to reduce taxes on average by $2,9008. While the boost from higher tax refunds is expected to be the most impactful on consumer spending, the increase in disposable income due to lower taxes paid this year will also lift spending. Lower interest rates (with additional cuts by the Fed expected later this year) and some stabilization in the labor market will also be supportive. We expect that higher refunds and lower taxes will jointly boost consumer spending by at least 0.3 percentage points this year.
As shown in Chart 1, the American consumer is proving more resilient than we expected despite K-shaped dynamics under the surface. We now anticipate inflation-adjusted consumer spending to climb by 2.8% this year almost matching last year’s 2.7% gain, and well above our earlier December prediction for 2.0% growth. Even as the gap between different consumer groups widens, household finances overall are still looking reasonably solid. Unless there’s a steep correction in the stock market (see report) or a sharp downturn in the job market, consumer spending is likely to remain robust. With middle- and high-income households accounting for nearly 80% of all consumer spending, their financial well-being and choices will continue to set the pace for overall consumption.
End Notes
- This includes food, fuel, cell phone, transportation, utilities, shelter, housekeeping supplies, health insurance, medical services.
- The Wall Street Journal. (2026). Even MBAs from top business schools are struggling to get hired. https://www.wsj.com/lifestyle/careers/even-mbas-from-top-business-schools-are-struggling-to-get-hired-11f4a167/
- Bank of America Institute. (2026, January). Consumer checkpoint: Choppy start, solid finish. https://institute.bankofamerica.com/content/dam/economic-insights/consumer-checkpoint-january-2026.pdf
- Tax Policy Center. (2025). Distributional effects of the tax provisions in the 2025 budget reconciliation act. https://taxpolicycenter.org/tax-model-analysis/distributional-effects-tax-provisions-2025-budget-reconciliation-act
- Congressional Budget Office. (2025, June). Distributional effects of federal tax policies. https://www.cbo.gov/system/files/2025-06/61387-Distributional-Effects.pdf
- JPMorgan Chase Institute. Tax refunds and household spending. (2020). https://www.jpmorganchase.com/institute/all-topics/financial-health-wealth-creation/tax-refunds-and-household-spending#:~:text=The%20day%20the%20tax%20refund%20arrives%2C%20families%20spend%20roughly%20%24180,a%20significant%20amount%20to%20savings
- Broda, C., & Parker, J. A. (2006). The impact of the 2001 tax rebates on consumer spending. American Economic Review, 96(5), 1589–1610. (Article ID: 10.1257/aer.96.5.1589). https://www.aeaweb.org/articles?id=10.1257/aer.96.5.1589#:~:text=Households%20spent%2020%20to%2040,aggregate%20consumption%20demand%20are%20substantial
- Tax Policy Center. (2025). Distributional effects of the tax provisions in the 2025 budget reconciliation act. https://taxpolicycenter.org/tax-model-analysis/distributional-effects-tax-provisions-2025-budget-reconciliation-act
Disclaimer
This report is provided by TD Economics. It is for informational and educational purposes only as of the date of writing, and may not be appropriate for other purposes. The views and opinions expressed may change at any time based on market or other conditions and may not come to pass. This material is not intended to be relied upon as investment advice or recommendations, does not constitute a solicitation to buy or sell securities and should not be considered specific legal, investment or tax advice. The report does not provide material information about the business and affairs of TD Bank Group and the members of TD Economics are not spokespersons for TD Bank Group with respect to its business and affairs. The information contained in this report has been drawn from sources believed to be reliable, but is not guaranteed to be accurate or complete. This report contains economic analysis and views, including about future economic and financial markets performance. These are based on certain assumptions and other factors, and are subject to inherent risks and uncertainties. The actual outcome may be materially different. The Toronto-Dominion Bank and its affiliates and related entities that comprise the TD Bank Group are not liable for any errors or omissions in the information, analysis or views contained in this report, or for any loss or damage suffered.
Download
Share: