U.S. Equity Market Exuberance & the Real Economy
Andrew Foran, Economist | 416-350-8927
Date Published: January 28, 2026
- Category:
- U.S.
- Latest Research
- Financial Markets
Highlights
- Blockbuster U.S. equity market returns over the past three years have been primarily fostered by a boom in the development of artificial intelligence and its associated infrastructure.
- Expectations for these trends to boost future earnings have led to strong multiple expansion among a handful of information technology and semiconductor firms.
- This in turn has boosted the already-sizeable market weights of these companies, diluting the diversification of broad market indexes like the S&P 500.
- If market expectations for the adoption and monetization of AI products are disappointed, a price correction among AI companies would drag down the broader market.
- A moderate 10% correction would likely have a benign impact on the economy, but a larger correction of 30% or higher could stall economic growth and push the unemployment rate north of 5%.
Until 2014, the internal motto of Facebook (now Meta) was “move fast and break things”, referencing the disruptive nature of digital technologies and the insatiable appetite for rapid innovation in Silicon Valley. While the phrase was retired by the company over a decade ago, the rapid drive to develop artificial technologies (AI) in recent years has fostered a new life for the phrase in the industry. With trillions of dollars committed to scaling up AI and its infrastructure, big tech is placing a big bet on the monetization potential of AI.
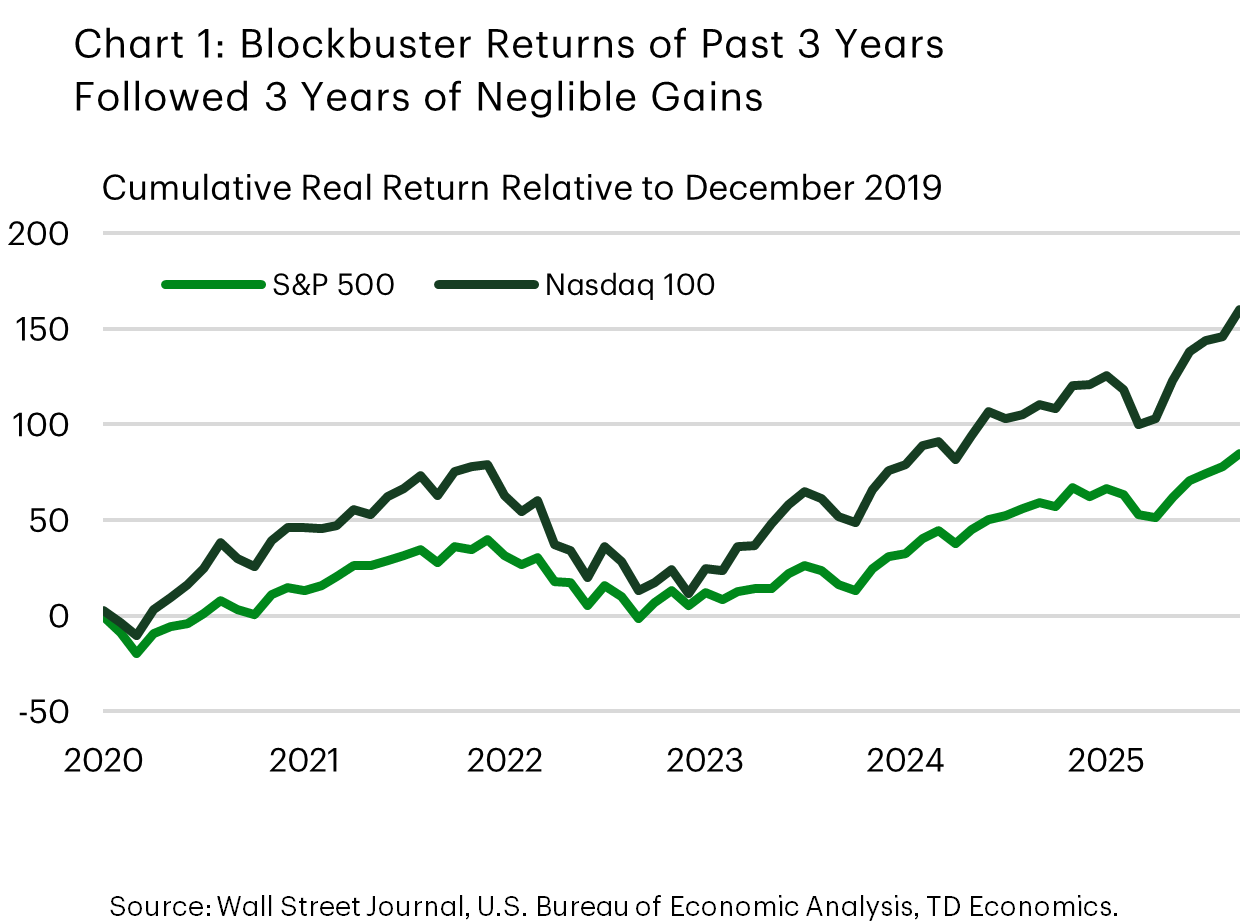
These developments have underpinned the bull market for U.S. equities that has persisted since late 2022, with the S&P 500 index up roughly 80% and the tech-heavy Nasdaq 100 index up nearly 130% over that time. Gains have largely come from strong earnings growth and multiple expansion among a handful of large companies involved in the AI buildout. The resultant concentration in equity market indexes – with the top 8 AI-oriented companies in the S&P 500 accounting for just under 40% of the total index – has raised concerns about the potential ramifications if expectations for AI’s potential underwhelm expectations.
Contextualizing Equity Market Developments to Date
When analyzing the influence of the AI boom on equity market price trends in recent years, many pick the starting point of late 2022. This period coincides with the launch of OpenAI’s ChatGPT and is an understandable jump-off point, but it’s also important to keep in mind what occurred prior to this point in equity markets. The cumulative real return of the S&P 500 index in the three years leading up to this point was virtually 0% (Chart 1). Elevated inflation and a market correction in 2022 consumed earlier post-pandemic gains, while a rapid ascent in interest rates weighed on expectations for a near-term recovery.
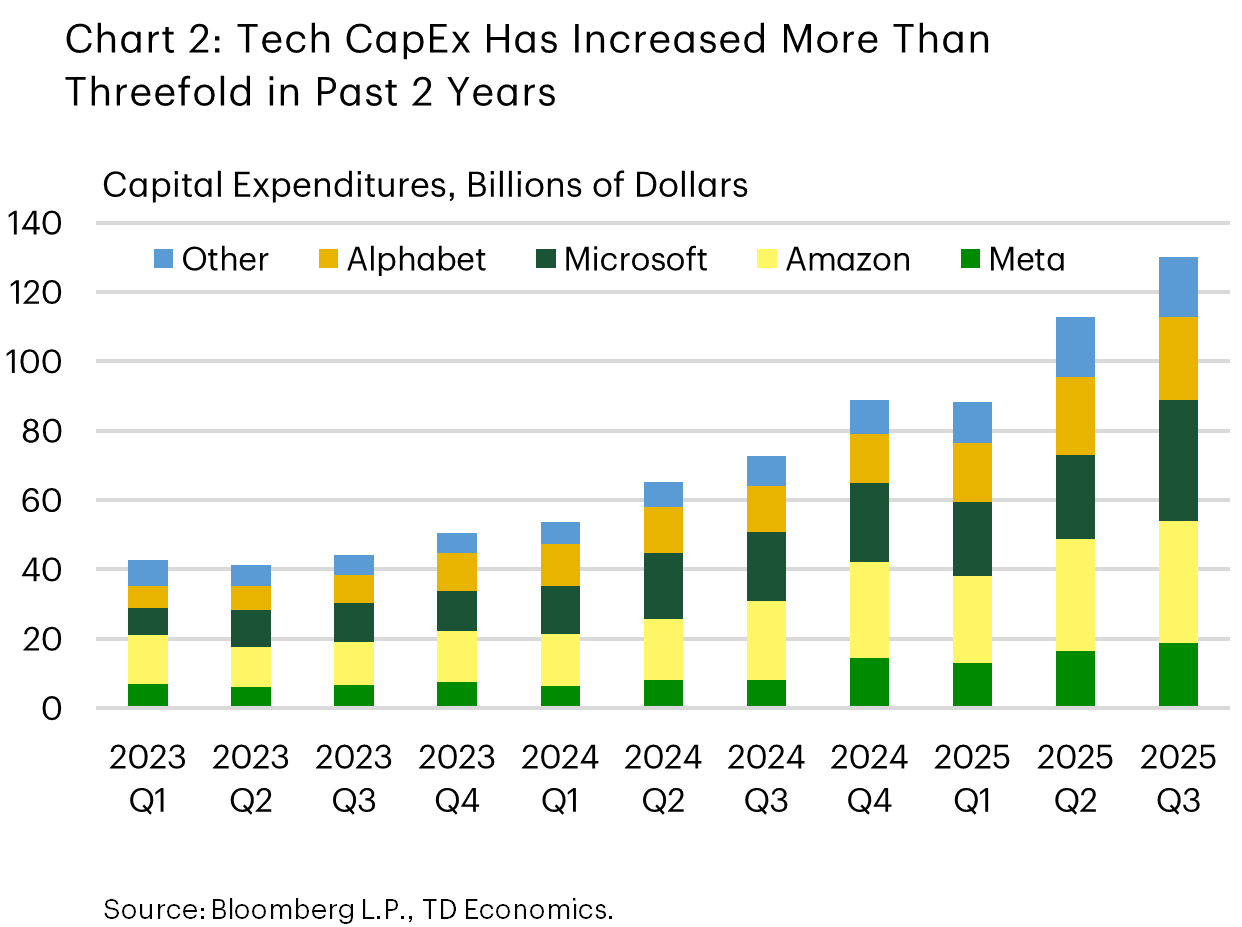
However, equity markets then received a shot in the arm, as companies began to invest vast sums into building out AI infrastructure. Owing to the strong cash positions of these companies, rising interest rates did not inhibit these investments as we saw elsewhere in the economy. This was enhanced in 2023 as inflation began to moderate and the Federal Reserve ended its rate-hiking cycle, leading to an acceleration in AI capital expenditures. Over the past two years, quarterly capital expenditures by the largest technology companies, led by Alphabet, Microsoft, Amazon, and Meta, have more than tripled (Chart 2). Most of this capital is being allocated to the build out of datacenters, warehouse-like facilities that house the technology required to train and run AI models.
The main beneficiaries of this phase of the AI buildout have been semiconductor manufacturers, cloud service providers, and utility companies, as a massive push to establish infrastructure to accommodate current and future AI adoption took place. The second phase of the AI buildout will largely depend on the ability of firms offering AI products to sustain and grow their user base and monetization rates.
Market Expectations for the Path Ahead & Risks Along the Way
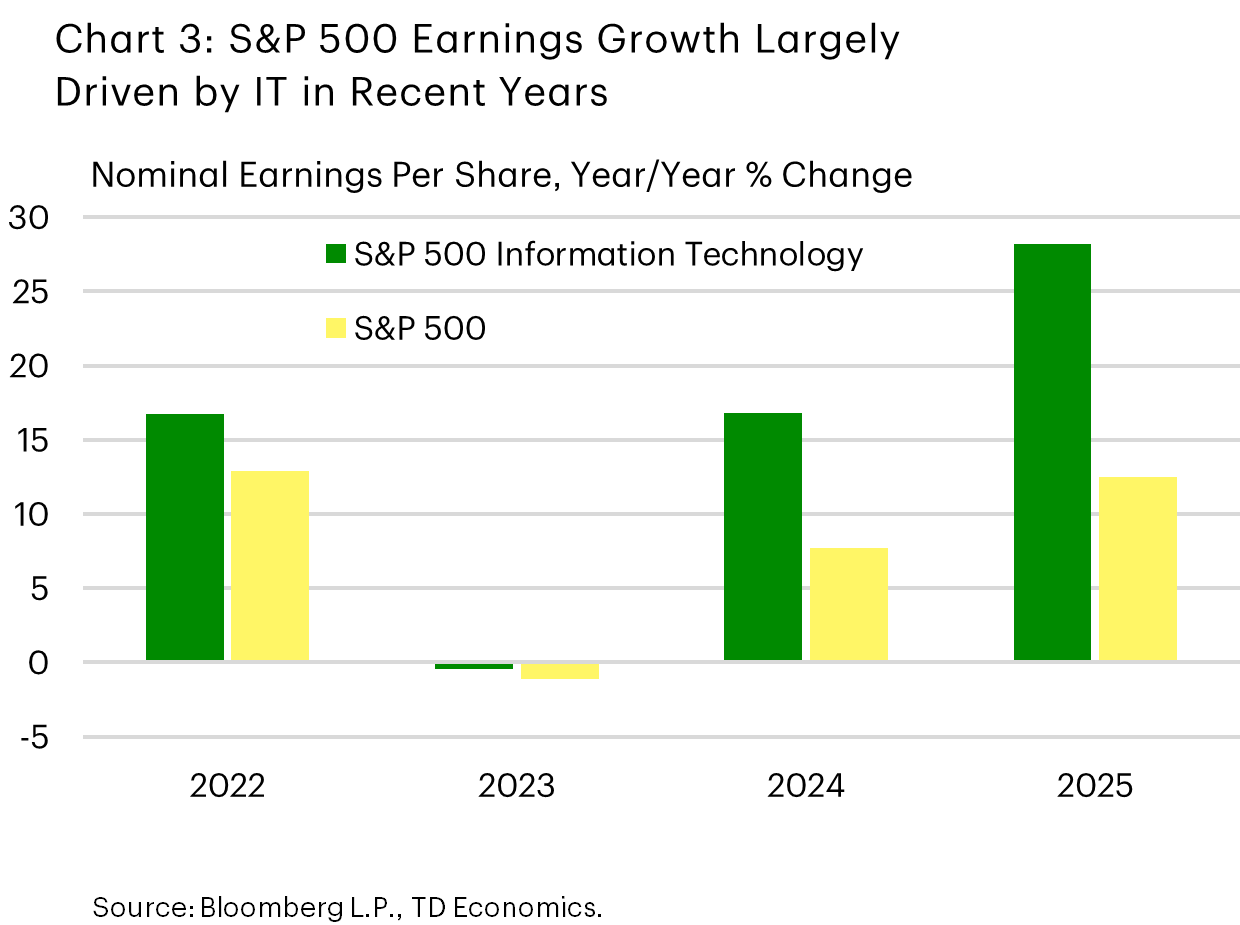
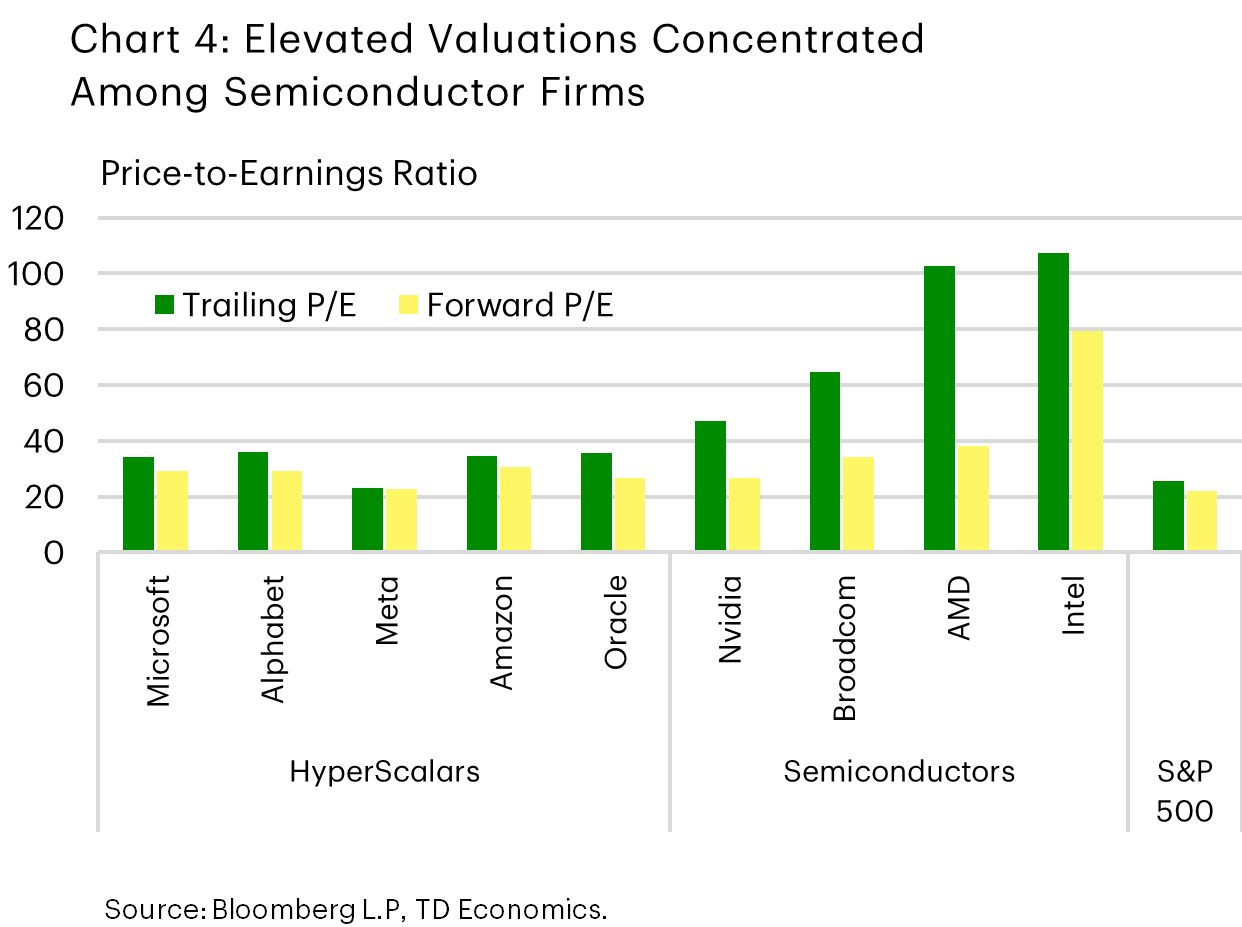
The relative success of the first phase of the AI buildout, as evidenced by exceptionally strong earnings growth among the major technology companies (Chart 3), has instilled a degree of confidence in market expectations for future earnings growth. As a result, valuations of these companies have risen to notably elevated levels (Chart 4), raising concerns among investors. These concerns have been compounded by their growing share of overall market capitalization, which increases the risks for wider fallout should actual earnings fall short of expectations.
Several other aspects of the AI spending boom have also raised concerns, including the preponderance of circular vendor financing arrangements among semiconductor producers, cloud service providers, and AI product companies. If the earnings of one of these companies ultimately fall short of expectations, it could ripple through the AI ecosystem with a cascading and reverberating effect. Investors have also voiced concerns with respect to the use of debt financing by certain companies to fund the construction of datacenters. To date, this has been limited overall, as large technology companies have leaned on their strong cash positions to fund their investments. Nevertheless, with the magnitude of future investments expected to increase the debt financing reliance of these companies moving forward, it could amplify risks both within the technology sector and the financial sector.
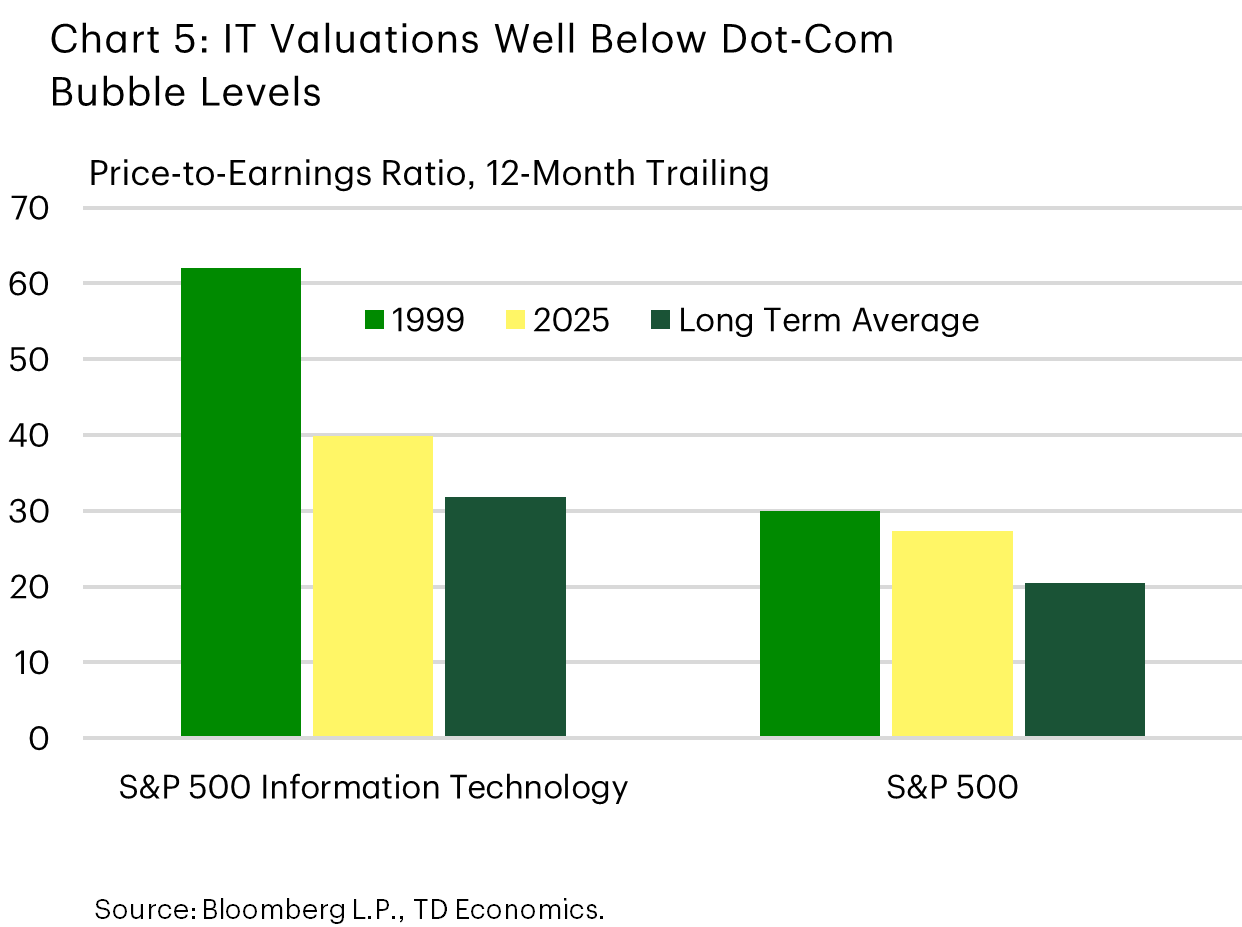
The combination of these trends (elevated valuations, circular vendor financing agreements, and debt financing) has inspired comparisons of the current exuberance in equity markets to those of the dot-com bubble of the early 2000’s. While valuations of broad-market indexes have approached the levels last recorded during the dot-com bubble, this is partly a byproduct of the higher share of the market accounted for by technology companies. The valuation of the information technology subindex is somewhat elevated, but it is still well below where it sat back in 1999 (Chart 5).
Furthermore, the current exuberance in equity markets has largely been driven by the accelerating earnings growth of companies with strong balance sheets and diversified revenue sources. This is not to say that some form of price correction will not occur, especially with valuations at the levels that they are today, but rather that a broad market correction on the scale of the dot-com bubble (~50%) seems to be a tail risk at this time. However, the developments in private equity do raise some concerns, with 65% of total venture capital funding in the U.S. allocated towards AI companies last year and many new unicorns (start-ups with valuations above $1 billion) being formed with limited revenue generation capacity. While this is not unheard of for start-ups, it could draw parallels to the dot-com bubble when early-stage investors vigorously pursued a single theme (i.e. the internet) with limited knowledge of its long-term economics.
In cognizance of these risks, equity markets have seen moderating gains over the past few months, with investors becoming more selective of the companies investing in AI. This has resulted in drawdowns in several tech stocks, but on aggregate the valuations of these companies still suggest that investors have confidence in the eventual return on investment of AI.
Financial Risks & the Real Economy
Equity market fluctuations often interact contemporaneously with the real economy. This occurs bidirectionally, both directly as the state of the economy influences the financial performance of publicly listed companies, and indirectly with a lag as the performance of equity markets influences consumer behaviour via wealth creation and destruction. In the context of financial shocks, the origin of the shock could begin in the economy and be amplified by financial market fragilities, or the shock could fully develop in financial markets. The latter has become less frequent in the aftermath of the two recessions of the early 2000’s (i.e. 2000, 2008), as regulatory reform and a more interventionist Federal Reserve worked to largely mitigate future recurrences. For example, the 2023 banking crisis could have had greater ramifications for the economy if the Federal Reserve and U.S. Treasury did not intervene. However, financial oversight entities are primarily concerned with credit market disruptions and would be unlikely to step in should a material equity market shock occur without spilling over into credit markets.
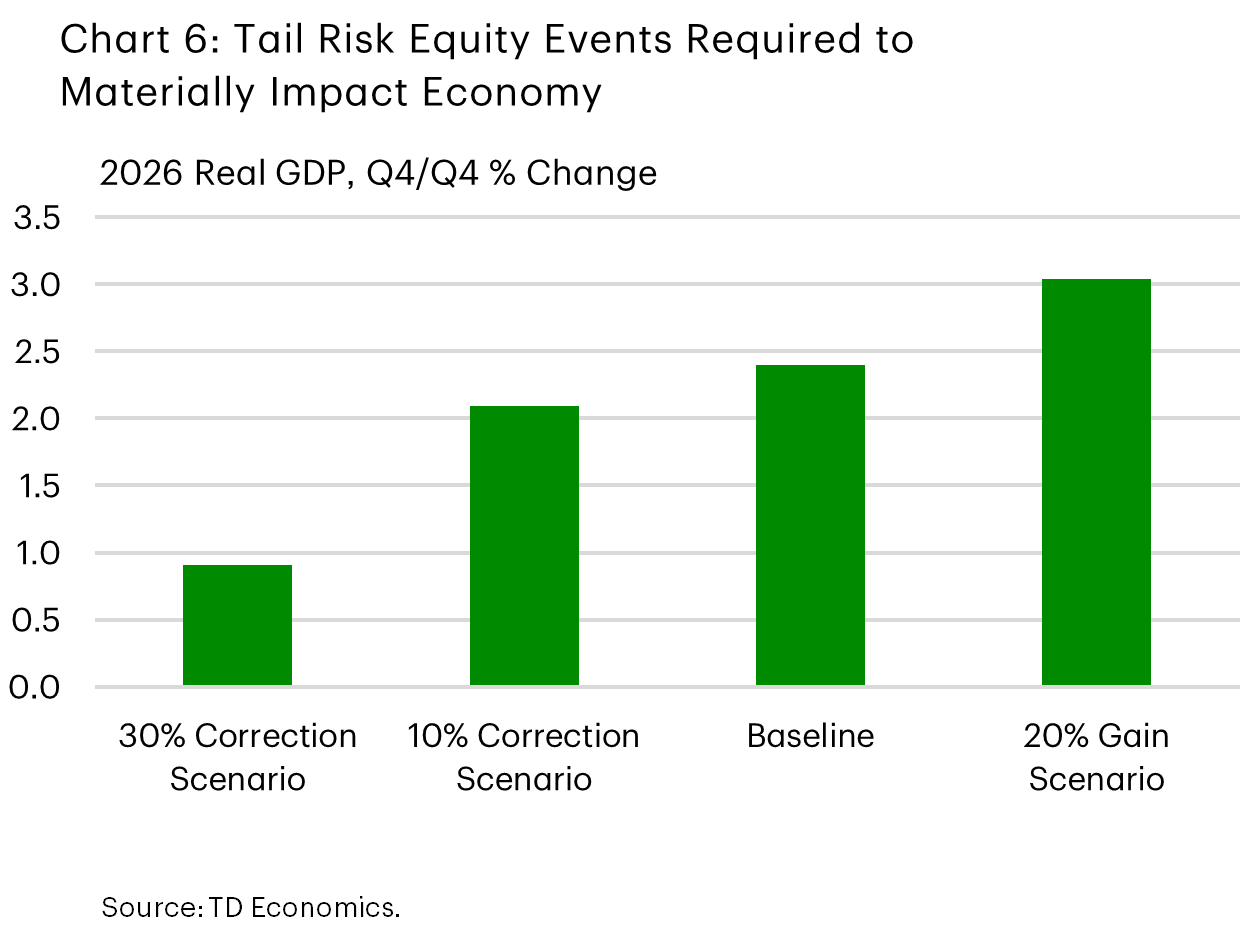
As of the time of writing, a significant correction in equity markets appears to be a tail risk, but if it were to occur it would likely have a meaningful impact on the economy. Based on our simulations, a 30% correction in the S&P 500 in the second quarter of 2026 would shave over a percentage-point off real GDP growth for the year – lowering the Q4/Q4 to just under 1% (Chart 6) - and push the unemployment rate north of 5% by year-end. Given the elevated exposure of retail investors to equity markets, particularly via broad-market exchange traded funds that are currently subject to concentration risks, a correction of this magnitude could have larger spillovers into the real economy. A 30% correction would put the value of the S&P 500 back to early 2024 levels and is consistent with a scenario in which big tech valuation compression is combined with moderate economic risks. It’s assumed that interventions by the Federal Reserve would forestall a broader financial/economic shock, with the S&P 500 recovering gradually in the following quarters.
Alternatively, if a more modest correction of 10% were to occur, the impact on the economy would likely be limited. Historically, corrections of this magnitude are relatively common and help to right-size valuations after a period of strength. In 2026, a 10% correction in the second quarter of the year would shave roughly 0.3 percentage points (ppts) off annual real GDP growth and push the unemployment rate higher by 0.1ppts. Note that the approximate inverse of this scenario, a 10% annual gain for the S&P 500, is the consensus expectation for 2026 and as such would not lead to a material difference relative to the baseline forecast. Equity price movements of +/-10% or less do not typically have significant impacts on consumption or real activity in the economy.
At the other end of the spectrum, we also consider a scenario in which tech companies continue to exhibit strong earnings growth amid an acceleration in AI adoption. Under a scenario where equity price gains in 2026 match those recorded in 2025, real GDP growth would be expected to be roughly half a percentage point higher in 2026. The unemployment rate would also end the year roughly 0.3ppts below the baseline forecast. However, it is important to note that valuations are stretched further in this scenario, evidencing the extent to which strong earnings growth has already been priced into market expectations. For this reason, this scenario should also be considered a tail risk for the time being.
All of these scenarios considered the impact on the U.S. economy, but it is also important to note that U.S. equities account for nearly two-thirds of global equity holdings, of which a substantial share is held in technology stocks. Any material correction or expansion in U.S. equities would likely have global implications, which in turn could feedback through to the U.S. economy.
Bottom Line
Equity markets have recorded exceptionally strong returns over the past three years on the back of significant investments in artificial intelligence technology infrastructure. The strength of returns has in turn helped to bolster consumption in the economy through an expansion of household wealth. However, questions of the sustainability of these trends have arisen in recent months, with the potential for an equity market correction to result in wealth destruction that could weigh on the U.S. and global economies. While equity markets have clearly exhibited exuberance in recent years, the question of whether it is irrational, and therefore the formation of a bubble, will depend on the future earnings potential of AI.
Disclaimer
This report is provided by TD Economics. It is for informational and educational purposes only as of the date of writing, and may not be appropriate for other purposes. The views and opinions expressed may change at any time based on market or other conditions and may not come to pass. This material is not intended to be relied upon as investment advice or recommendations, does not constitute a solicitation to buy or sell securities and should not be considered specific legal, investment or tax advice. The report does not provide material information about the business and affairs of TD Bank Group and the members of TD Economics are not spokespersons for TD Bank Group with respect to its business and affairs. The information contained in this report has been drawn from sources believed to be reliable, but is not guaranteed to be accurate or complete. This report contains economic analysis and views, including about future economic and financial markets performance. These are based on certain assumptions and other factors, and are subject to inherent risks and uncertainties. The actual outcome may be materially different. The Toronto-Dominion Bank and its affiliates and related entities that comprise the TD Bank Group are not liable for any errors or omissions in the information, analysis or views contained in this report, or for any loss or damage suffered.
Download
Share: