Inflation Tracker
Andrew Hencic, Senior Economist
Tarek Attia, Research Analyst
Date Published: October 4, 2022
- Category:
- U.S.
- Financial Markets
Highlights
- Inflation continues to linger at elevated levels in most advanced economies, although there are initial signs of relief from improving supply chain conditions and softening raw input prices.
- Labor markets remain tight in most of the G-7 and supportive of strong wage growth.
- Rate hikes by central banks will work to tame inflation, but the effects of policy rate changes can take months to manifest themselves.
Inflation continues to trend well above desired rates in most advanced economies. However, there are signs that the commodity price shock and supply chain problems that were behind the initial surge have abated - cooling some of the supply-side pressure. Central banks have also stepped up to the plate, raising interest rates at a brisk clip to temper the demand-side source of inflation and keep expectations for future price gains anchored. These factors should help cool inflation in the coming quarters. This report outlines the current state of inflation across advanced and emerging economies, and the forces affecting inflation like commodity prices, policy rates, and wages.
Advanced Economies
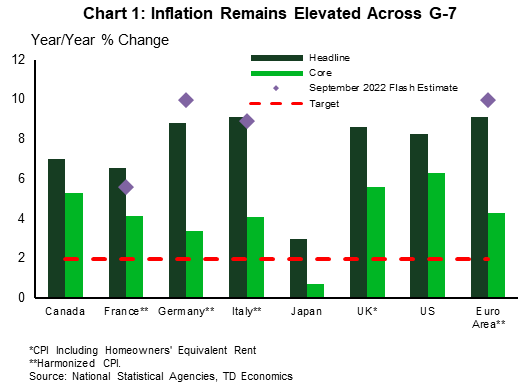
As of August, inflation continues to run well above desired levels across most major economies. Headline CPI in the euro area (+9.1% year-on-year, y/y) and Italy (+9.1% y/y) led the pack with the U.K. (+8.6% y/y) and the U.S. (+8.3% y/y) following closely behind. Moreover, preliminary September data show euro area and German headline inflation touching 10.0% and 10.9% y/y, respectively (Chart 1).
While there are some early signals that momentum in price gains might be slowing it’s important to note that not everything is what it seems (Table 1). In Europe, the reduced pace is partially attributable to policy interventions with limited shelf lives. For instance, Germany’s move to cap public transit costs took transportation service cost inflation from +3.6% y/y in May to -28.9% in June. Indeed, September’s preliminary figures indicate that the expiry of those temporary measures helped lift inflation from 8.8% in August to 10.9% in the month.
Table 1. Core Inflation in Advanced Economies
| Countries | 3-month over 3-month (annualized) | Year-over-Year | Accelerating/ Slowing |
| Germany | -0.8 | 3.4 | Slowing |
| U.K. | 5.2 | 5.6 | Slowing |
| U.S. | 7.1 | 6.3 | Accelerating |
| Euro Area* | 3.5 | 4.3 | Slowing |
| Canada | 6.0 | 5.3 | Accelerating |
| Italy* | 6.2 | 4.1 | Accelerating |
| France | 4.5 | 4.1 | Accelerating |
| Japan | 2.3 | 0.7 | Accelerating |
Looking forward, commitments in the U.K., France, and Germany to cap energy prices in 2023 will put a firm lid on headline price gains. The risks are that by preserving purchasing power for households, core inflation could become more entrenched. This would, in turn, precipitate further monetary policy tightening by central banks.
More recently, the planned tax cuts in the U.K. will add more fiscal stimulus to the economy and fuel aggregate demand. The full effect of the stimulus on inflation will now depend heavily on the degree of additional monetary policy tightening the Bank of England undertakes.
Commodities Prices
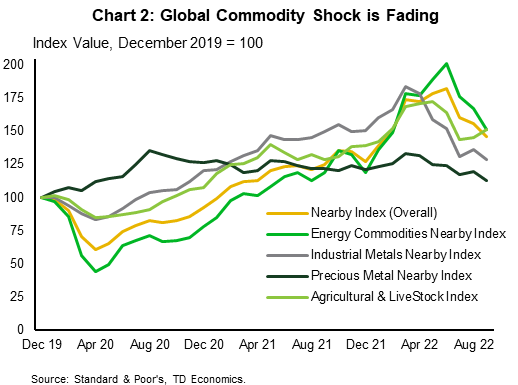
The commodity shock following the Russian invasion of Ukraine is fading (Chart 2). Apart from European natural gas, which remains supply constrained, softening global demand and easing supply concerns have seen commodity prices ease. Our current view is that as global demand continues to weaken prices will further retreat in 2023. That said, given tight supplies, European wholesale natural gas prices remain historically high and subject to a high degree of volatility.
Supply Chains
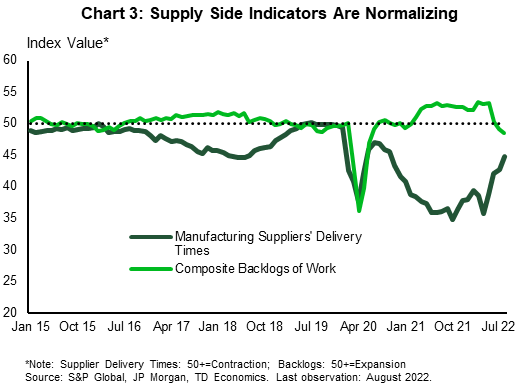
Supply chain problems have also shown material signs of improvement since last fall. Measures of supplier delivery times and order backlogs (Chart 3) are trending towards pre-pandemic norms. Moreover, as raw materials prices have begun to fall, the trend in input cost inflation has shifted, signaling less input cost pressure.
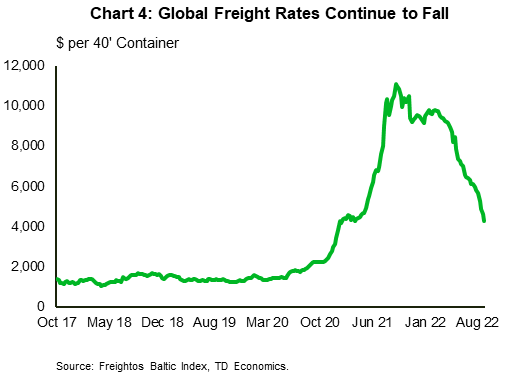
Notably, as amid weakening demand, freight costs have been falling (Chart 4). The cost of moving a 40-foot container is down by almost 61% from its peak in the fall of 2021. Together with falling gasoline prices, this should further help ease transportation costs for goods producers.
Expectations
The work by central bank officials to retain credibility appears to be paying dividends as financial market expectations have remained relatively stable over the past few months (Table 2). That said, consumers and businesses don’t appear to be as convinced, as near-term expectations have continue to drift higher as inflation continues to surprise to the upside.
The U.K. is a special case here, where authorities have moved to stabilize inflation in the near-term through price caps on energy bills, the government has also moved to implement a large fiscal expansion through unfunded tax cuts. The two policies have offsetting effects on inflation and muddle the picture for businesses and households alike.
Table 2. Inflation Expectations in G-7
| Financial Measures | ||||
| Country | Measure | Unit | Value | Change from 3 Months Ago/Prior Quarter |
| Germany | 5-Year Breakeven Inflation | % | 2.5 | Decrease |
| Germany | 10-Year Breakeven Inflation | % | 2.1 | Increase |
| U.K. | 5-Year Inflation Rate | % | 4.1 | Increase |
| U.K. | 10-Year Inflation Rate | % | 3.7 | Increase |
| U.S. | 5-Year Breakeven Inflation | % | 1.7 | Decrease |
| U.S. | 10-Year Breakeven Inflation | % | 2.1 | Decrease |
| Canada | 10-Year Breakeven Inflation | % | 2.2 | Decrease |
| Consumer Survey Measures | ||||
| Canada | CES - 2 Years Ahead | % | 5.0 | Increase |
| Canada | CES - 5 Years Ahead | % | 4.0 | Increase |
| Euro Area | Cons. Price Trends Next 12 Months | % Bal. | 41.0 | Decrease |
| France | INSEE Household Survey - 12 Months | % Bal. | 1.1 | Decrease |
| Italy | Bank of Italy 1-Year Cons. Price Exp. | % | 5.6 | Increase |
| Italy | Bank of Italy 2-Year Cons. Price Exp. | % | 4.8 | Increase |
| U.K. | BoE/Kantar Inflation Survey 1-Year | % | 4.6 | Increase |
| U.K. | BoE/Kantar Inflation Survey 5-Year | % | 3.5 | Increase |
| Japan | Bank of Japan Consumer Survey | % Bal. Expecting Higher Prices in 1 Yr | 85.6 | Increase |
| Japan | Bank of Japan Consumer Survey | % Bal. Expecting Higher Prices in 5 Yrs | 76.3 | Increase |
| U.S. | UMich. Consumer Inflation Exp. 1-Year | % | 4.7 | Decrease |
| U.S. | UMich. Consumer Inflation Exp. 5-Year | % | 2.7 | Decrease |
| Business Survey Measures | ||||
| Canada | Consensus Economics Inflation Exp. For 2022 | % | 6.9 | Increase |
| Canada | Consensus Economics Inflation Exp. For 2023 | % | 3.6 | Increase |
| Canada | Bank of Canada Business Outlook Survey | % of Firms. Expecting Prices above 3% | 78.0 | Increase |
| France | Consensus Economics Inflation Exp. For 2022 | % | 5.5 | Increase |
| France | Consensus Economics Inflation Exp. For 2023 | % | 3.6 | Increase |
| France | Bank of France MBS Price Forecast - Services | % Bal. | 11.1 | Decrease |
| France | Bank of France MBS Price Forecast - Total Industry | % Bal. | 16.0 | Decrease |
| Germany | Deutsche Bundesbank Inflation Exp. 1-Year | % | 4.5 | Decrease |
| Germany | Consensus Economics Inflation Exp. For 2022 | % | 7.8 | Increase |
| Germany | Consensus Economics Inflation Exp. For 2023 | % | 5.8 | Increase |
| Germany | ZEW Survey 12-Month Inf. Expectations | % Bal. | -12.1 | Increase |
| Italy | Consensus Economics Inflation Exp. For 2022 | % | 7.4 | Increase |
| Italy | Consensus Economics Inflation Exp. For 2023 | % | 4.3 | Increase |
| Italy | Bank of Italy Business Survey Inflation Exp. 1-Year | % | 5.6 | Increase |
| Italy | Bank of Italy Business Survey Inflation Exp. 2-Year | % | 4.8 | Increase |
| Japan | Consensus Economics Inflation Exp. For 2022 | % | 2.2 | Increase |
| Japan | Consensus Economics Inflation Exp. For 2023 | % | 1.4 | Increase |
| Japan | Tankan Survey Inflation Exp. 1-Year | % | 2.9 | Increase |
| Japan | Tankan Survey Inflation Exp. 3-Year | % | 3.5 | Increase |
| Japan | Tankan Survey Inflation Exp. 5-Year | % | 4.0 | Increase |
| Euro Area | Surv. Prof. Forecasters - Next Year | % | 2.4 | Increase |
| Euro Area | Surv. Prof. Forecasters - Two Years Ahead | % | 1.9 | Decrease |
| Euro Area | Surv. Prof. Forecasters - Long-Term | % | 2.1 | Increase |
| Euro Area | Surv. Prof. Forecasters - Next Year (Core) | % | 2.3 | Increase |
| Euro Area | Surv. Prof. Forecasters - Two Years Ahead (Core) | % | 2.0 | Increase |
| Euro Area | Surv. Prof. Forecasters - Long-Term (Core) | % | 1.9 | Decrease |
| Euro Area | Consensus Economics Inflation Exp. For 2022 | % | 8.2 | Increase |
| Euro Area | Consensus Economics Inflation Exp. For 2023 | % | 5.4 | Increase |
| U.K. | Consensus Economics Inflation Exp. For 2022 | % | 9.2 | Increase |
| U.K. | Consensus Economics Inflation Exp. For 2023 | % | 7.0 | Increase |
| U.K. | CBI - Change in General Prices Next 12 Mo. | % | 4.1 | Increase |
| U.S. | Consensus Economics Inflation Exp. For 2022 | % | 8.0 | Increase |
| U.S. | Consensus Economics Inflation Exp. For 2023 | % | 3.8 | Increase |
| U.S. | CFO Survey - Price Growth Next Year | % | 5.8 | Decrease |
Policy Rates
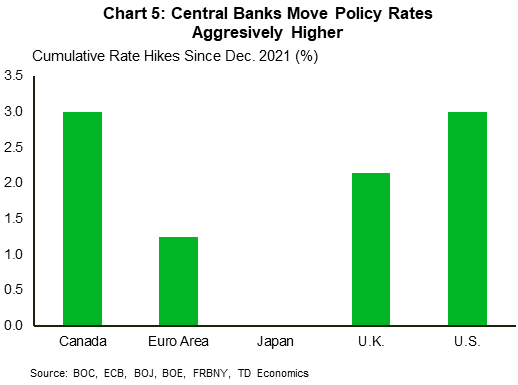
As inflation has accelerated, policymakers have acted decisively. Most central banks in the G-7 (with the notable exception of Japan) have tightened monetary policy rapidly by raising rates between 1.25 and 3.00 percentage points (Chart 5) and ending pandemic era bond buying programs. Moreover, to keep inflation expectations well anchored, central bankers have signaled a willingness to raise rates to restrictive levels and cool the economy to tame inflation. Note, however, that policy rate can take several months to feed through to the economy. As such, the current inflation figures are only just responding to the rate hikes from a few months ago and more recent hikes will be reflected in the months to come.
Wages
Wage pressures continue to support above-target inflation across the G-7. Relative to pre-pandemic trends, hourly wages are growing at a faster clip amid historically tight labor markets (Table 3). The U.S. and Canada are particular standouts where current wage growth is roughly two percentage points above pre-pandemic trend rates.
However, there are a few cracks starting to show through in Germany. Negotiated wages are puttering along at 2.3% y/y, well below the rate of inflation and still below pre-pandemic norms. This may reflect some restraint on the part of unions and firms in ongoing wage bargaining. The prospect of an economic slowdown along with a rising registered unemployment rate may be leading to a prioritization of job retention over cost-of-living wage increases in negotiations. Nonetheless, the erosion of real wages will add downward pressure to demand and subsequently inflation.
Table 3. Wage Growth
| Measures | U.S. | Germany*** | Canada | Italy*** | Japan* | U.K.** | France |
| Current (Y/Y) | 5.2 | 2.3 | 3.2 | 1.2 | 0.7 | 4.9 | 3.4 |
| Pre-Pandemic Avg. | 3.0 | 2.5 | 2.6 | 1.0 | 1.4 | 2.9 | 1.5 |
| Last Observation | August | July | July | August | June | June | June |
Emerging Markets
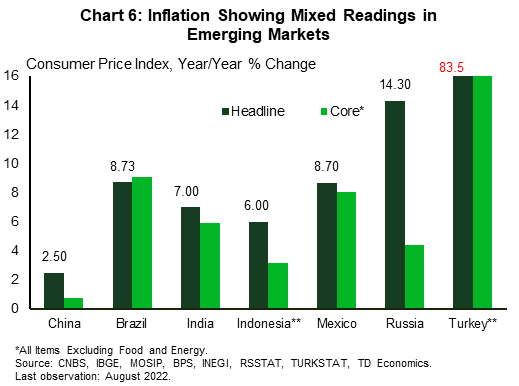
Inflation in emerging markets is also picking up pace – with China (+2.5% y/y) being a notable outlier (Chart 6). Price gains in Indonesia (+6.0% y/y), Brazil (+8.7% y/y), India (+7.0% y/y) and Mexico (+8.7% y/y) are running much hotter than recent history – although Brazil’s headline CPI has trended down in recent months. In Turkey, officials continue to pursue a policy of monetary easing despite inflation above 80% y/y, further exacerbating the feedback loop to prices. Meanwhile, strict sanctions imposed on Russia are hitting home as headline inflation has topped 14%.
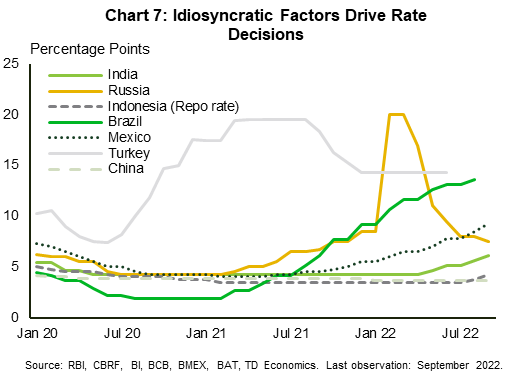
In response to rising inflation, most central banks have tightened policy relative to last year (Chart 7). The moves, however, aren’t ubiquitous as China, Turkey, and Russia are cutting rates. For Russia earlier rate hikes were adopted to defend the ruble and are now being unwound to support the domestic economy. In the case of China, the ongoing domestic headwinds from COVID-19 control policies and the slowing real estate sector are pushing authorities to try and stimulate demand.
Worryingly, the rapid tightening campaign by the Fed and global risk-off sentiment has fueled an epic rise in the U.S. dollar, forcing countries to run down their foreign exchange reserves. Further erosion in reserves could put additional pressure on currencies and add another leg to inflation. Again, Russia here is a notable outlier as capital controls and sanctions have limited the rundown of the ruble.
Disclaimer
This report is provided by TD Economics. It is for informational and educational purposes only as of the date of writing, and may not be appropriate for other purposes. The views and opinions expressed may change at any time based on market or other conditions and may not come to pass. This material is not intended to be relied upon as investment advice or recommendations, does not constitute a solicitation to buy or sell securities and should not be considered specific legal, investment or tax advice. The report does not provide material information about the business and affairs of TD Bank Group and the members of TD Economics are not spokespersons for TD Bank Group with respect to its business and affairs. The information contained in this report has been drawn from sources believed to be reliable, but is not guaranteed to be accurate or complete. This report contains economic analysis and views, including about future economic and financial markets performance. These are based on certain assumptions and other factors, and are subject to inherent risks and uncertainties. The actual outcome may be materially different. The Toronto-Dominion Bank and its affiliates and related entities that comprise the TD Bank Group are not liable for any errors or omissions in the information, analysis or views contained in this report, or for any loss or damage suffered.
Download
Share: