Fuel for Expansion: Rising Corporate
Borrowing Meets a Broader Investment Cycle
Ksenia Bushmeneva, Economist | 416-308-7392
Date Published: August 20, 2026
- Category:
- U.S.
- Business Investment
Highlights
- Business investment continues to be a bright spot in the U.S. economy. AI is still a key driving force, but growth has broadened, with spillovers into industrial equipment, R&D, and other non-tech categories.
- Rising investment has lifted corporate financing needs, with loan demand, M&A activity and corporate bond issuance all strengthening as firms fund expansion.
- Credit conditions remain accomodative, backed by a supportive bank lending backdrop, narrow corporate bond spreads and strong investor appetite. However, risks among lower-rated companies and AI-focused borrowers warrant monitoring.
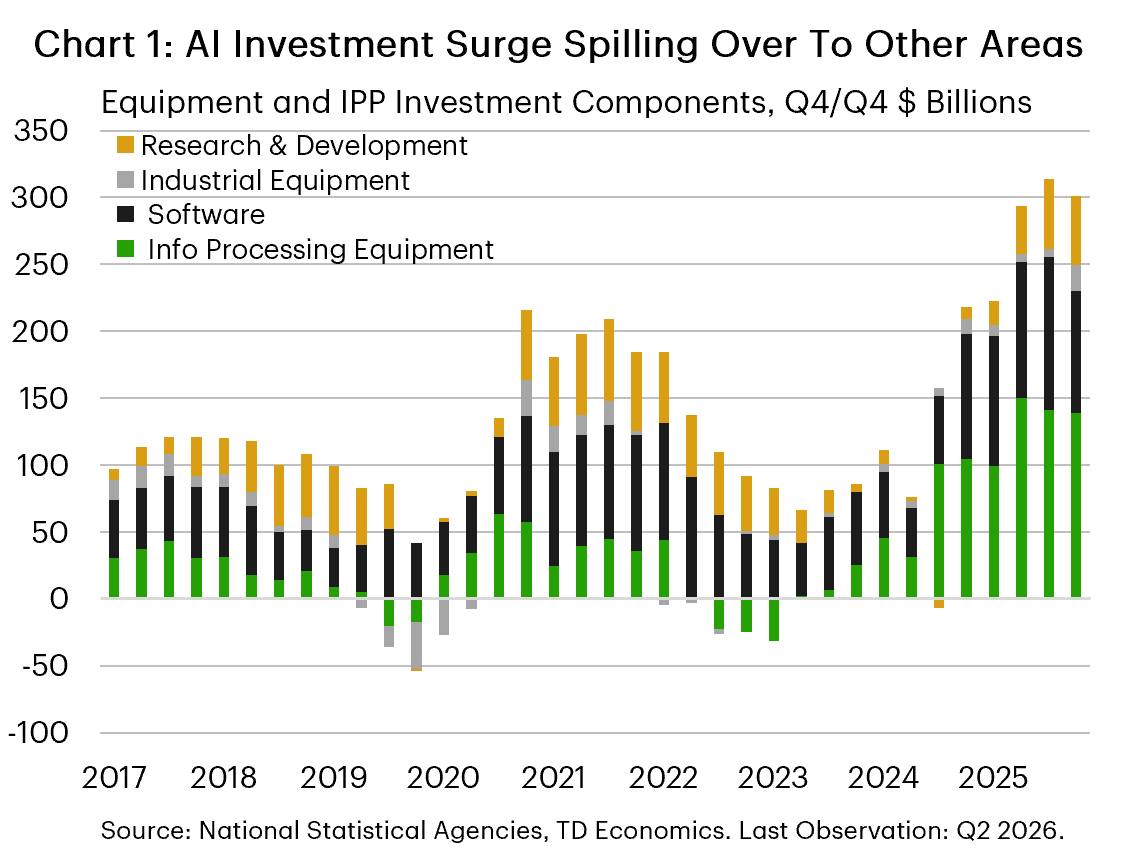
Business investment has emerged as one of the brightest spots in the U.S. economy this year. While much of the attention has centered on artificial intelligence, the current investment cycle is becoming more broad-based (Chart 1). Spending on industrial equipment and research and development (R&D) continues to accelerate; manufacturing activity is showing renewed momentum; and corporate investment intentions are improving despite ongoing trade and energy price uncertainty.
The pickup in investment has translated into stronger corporate financing needs. Businesses are increasingly turning to banks and capital markets to fund expansion, with C&I lending and corporate bond issuance accelerating. Increased borrowing is being supported by more accommodative lending conditions for C&I loans and narrow corporate spreads.
Borrowing is happening alongside resilient corporate profitability and generally healthy balance sheets. Corporate debt loads remain low relative to GDP. That being said, risks remain. Rising leverage among some AI-focused companies and the need for returns on large AI capital commitments require monitoring. In addtion, while most publicly traded companies are well positioned to service their debt, debt-servicing capacity is lower among some non-investment-grade firms and riskier private firms, especially those that rely on floating-rate debt such as leveraged loans and private credit. Overall, however, the combination of broadening investment, solid corporate fundamentals, and accommodative credit conditions points to a continued expansion in the business investment cycle.
Business Investment Has Broadened
As argued earlier this year, the upswing in investment is broadening beyond AI (report). One sign that investment is becoming more broad-based is the surge in industrial equipment spending, which rose 29% (annualized) in Q2. Zooming in on this category, growth in Q2 was led by a sharp increase in investment in special industry machinery, metalworking machinery, and general industrial equipment, suggesting that firms are expanding capacity across a wider range of industrial sectors. At the same time, the buildout of AI data centers and supporting electricity infrastructure still remains a dominant theme, as evidenced by the nearly 40% (annualized) jump in spending on electrical transmission, distribution, and industrial apparatus in Q2.
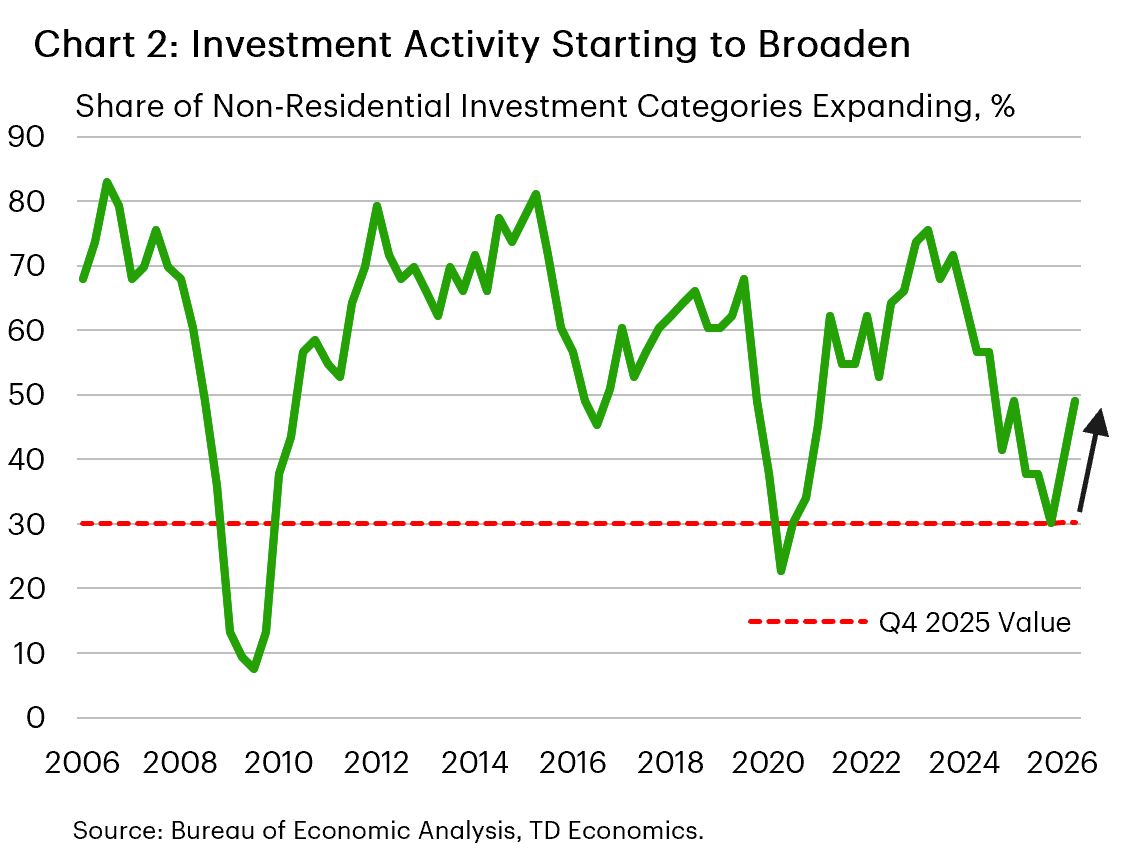
Another way to measure the breadth of investment is to count the number of investment categories where spending is rising. Excluding information processing equipment, about 50% of the 50+ detailed categories posted year-over-year growth in 2026Q2 (Chart 2) — still below the long-run average, but a significant improvement relative to the end of 2025 when it was only 30%.
Within the Intellectual Property Products (IPP) category, software remains the largest contributor to growth, but R&D spending is also gaining momentum. Part of that increase is likely tied to AI, but policy tailwinds are also reinforcing the investment outlook. The One Big Beautiful Bill Act’s restoration of immediate expensing for domestic R&D has lowered the after-tax cost of innovation across industries. Reshoring and supply-chain diversification driven by tariffs have also likely encouraged firms to expand domestic production capacity.
New Drivers of Investment Are Emerging
The gains in industrial equipment investment highlighted earlier appear consistent with improving conditions in the manufacturing sector. The ISM Manufacturing Index has risen steadily this year, with production, new orders, and employment all moving higher, pointing to a rebound in manufacturing production (report).
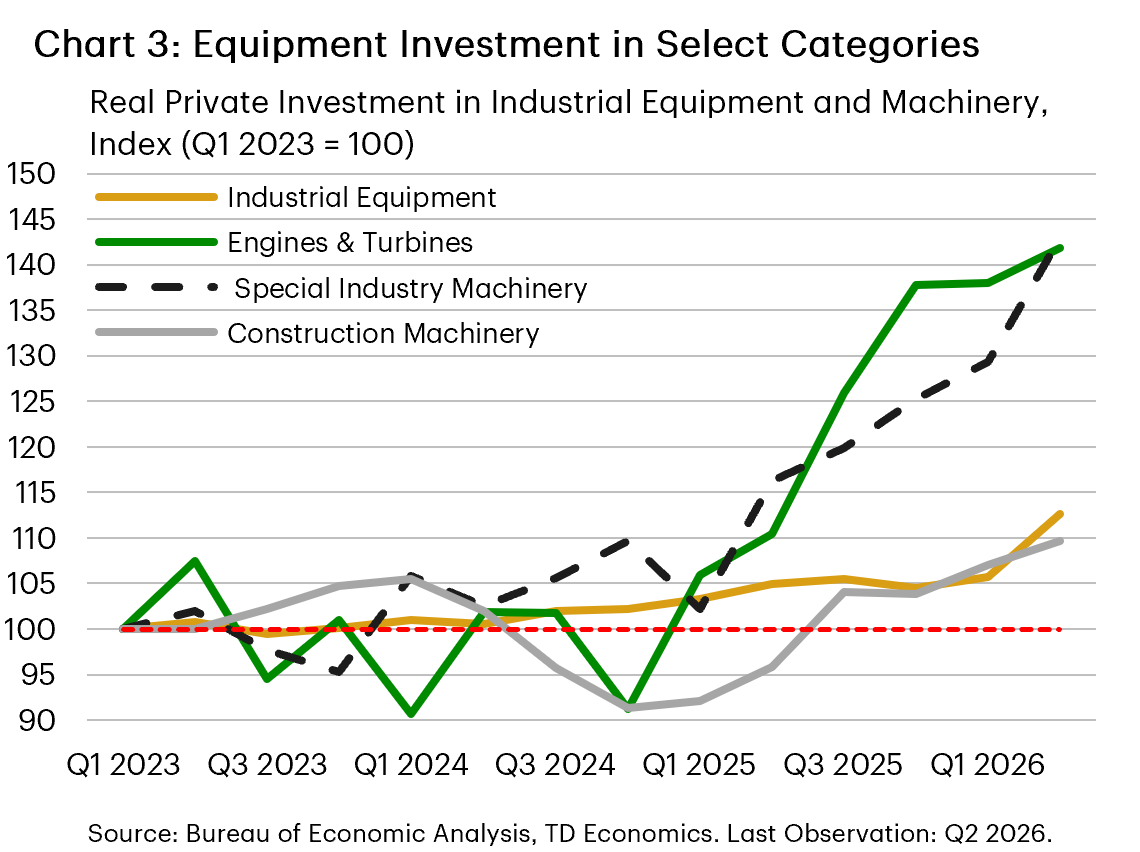
While investment in manufacturing structures remains down from a year ago, taking a breather following the brisk expansion in the 2022-2024 period, investment in equipment is on the rise. Growth is particularly strong within engines and turbines and special industry machinery (Chart 3). Investment in industrial equipment is up 7.4% from a year ago, while investment in construction machinery is up 14.5% year-over-year.
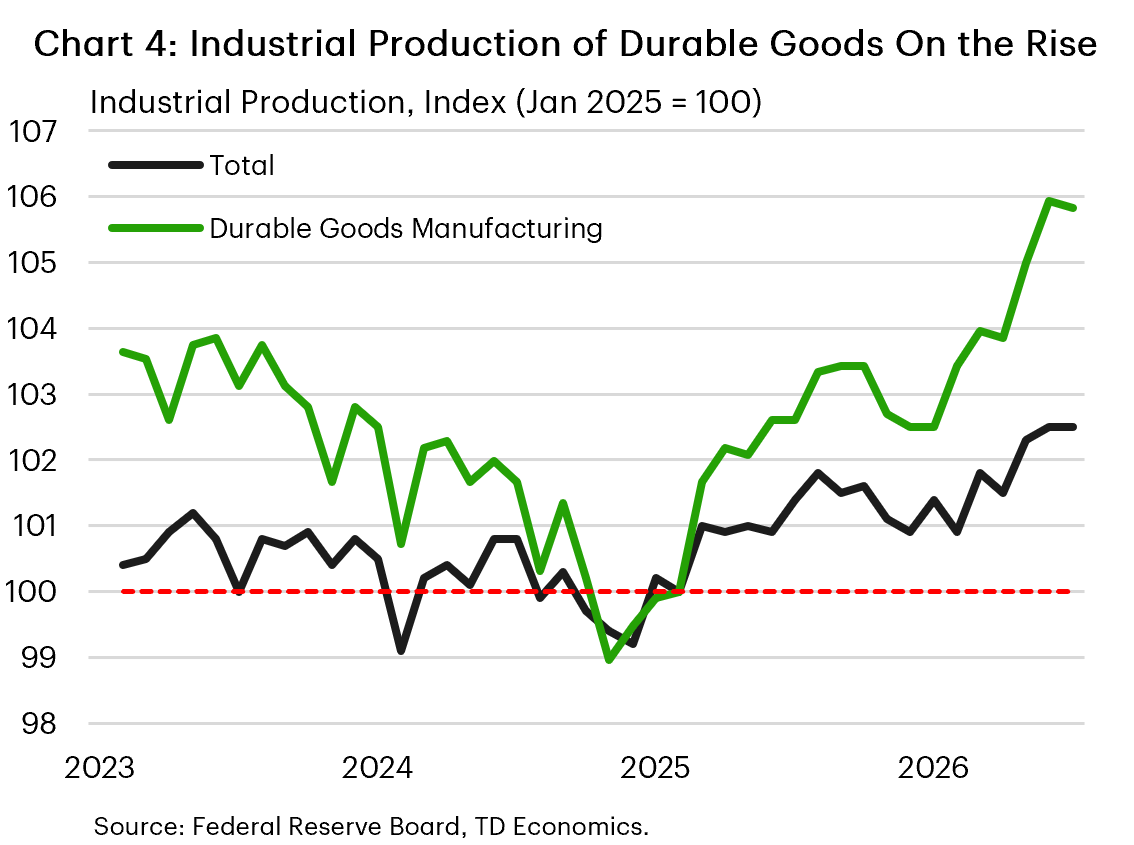
Industrial production of durable goods has also continued to trend higher alongside rising demand for capital goods (Chart 4). While capacity utilization within the broad manufacturing sector has changed little over the past two years, it has improved within durable goods, particularly in machinery, aerospace, and non-metallic mineral products. This points to rising capacity constraints within these subsectors, suggesting a need to increase capacity through investment.
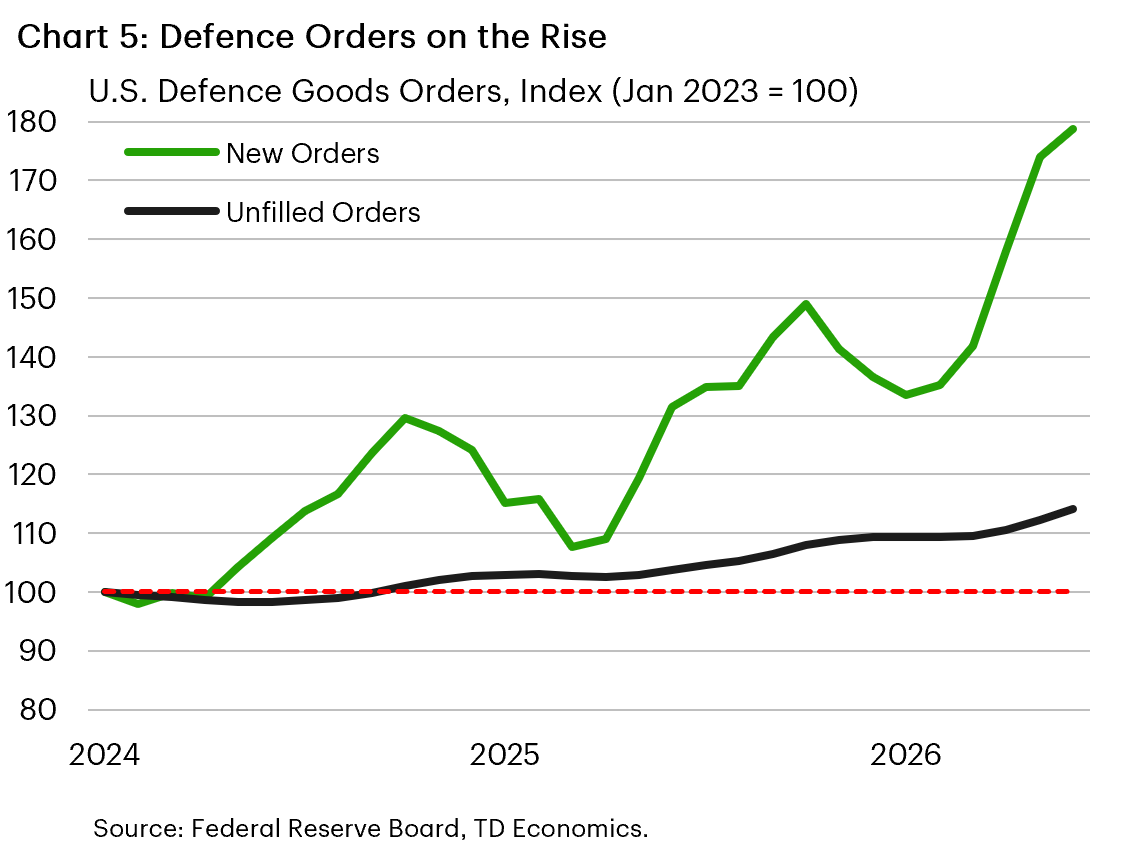
A second non-AI investment channel may be emerging from the defense-industrial base. Major defense contractors are expanding manufacturing capacity in response to higher U.S. military spending commitments, multi-year procurement contracts, efforts to replenish weapons inventories, and rising defense spending commitments among NATO members (see report). Supporting this trend, both new and unfilled defense orders have been rising, pointing to strong demand, growing backlogs, and a need for additional production capacity (Chart 5).
Corporate Investment Intentions Have Improved
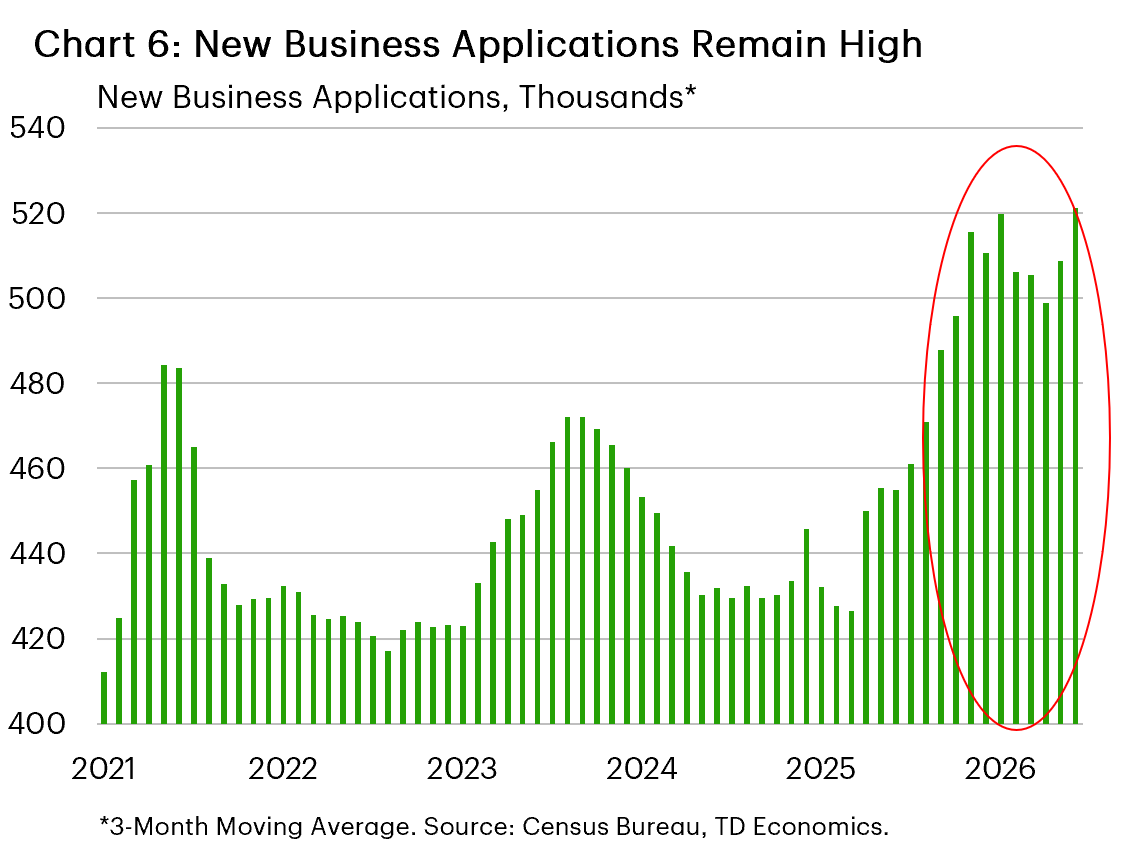
The broadening of investment is being reinforced by a corporate sector that remains willing to pursue growth opportunities despite ongoing economic uncertainty, with concerns about oil prices and tariffs dominating the headlines this year. Business formation remains historically strong, suggesting that entrepreneurs continue to identify profitable opportunities. New business applications have averaged more than 500,000 per month in recent months, surpassing the peak reached during the pandemic (Chart 6).
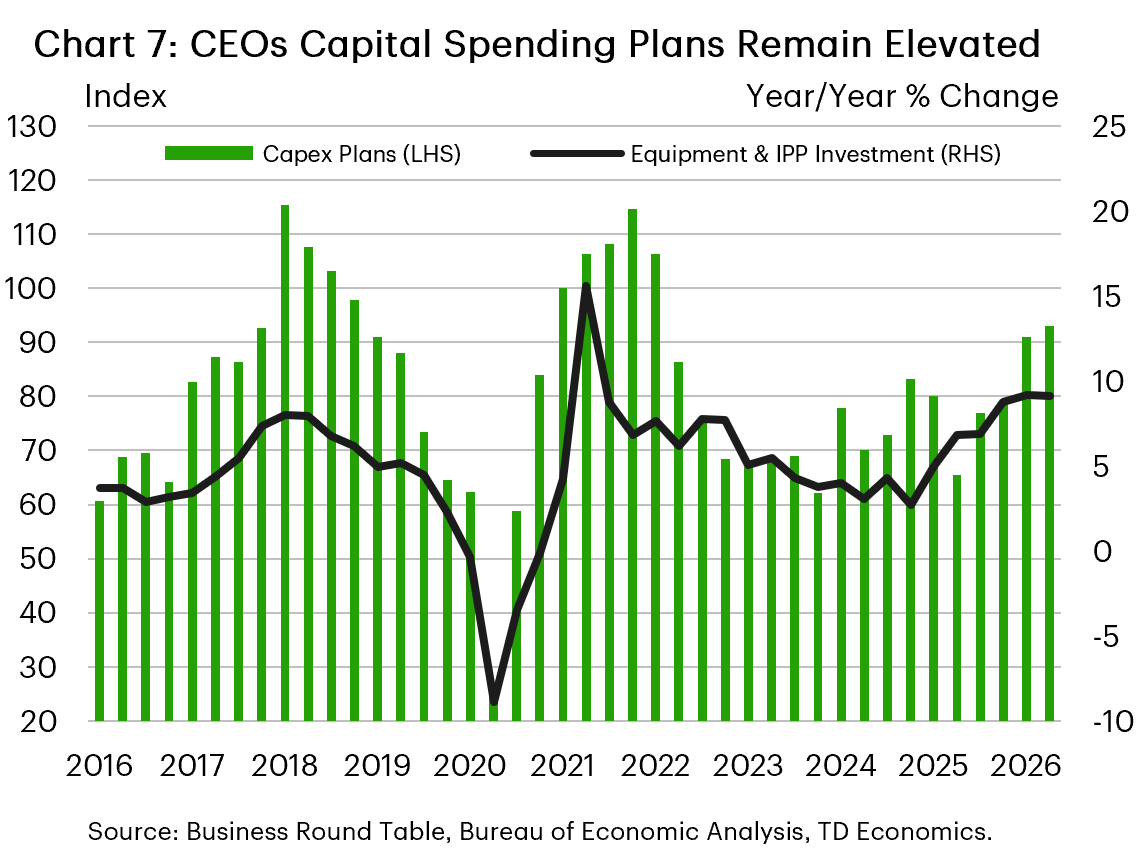
Survey evidence also points to elevated and improving capex sentiment among CEOs. Capital spending intentions in the Business Roundtable’s CEO Economic Outlook rose to 93 in the second quarter, the highest level since Q1 2022 and well above the long-run average (Chart 7).
Firms’ willingness to increase investment extends beyond organic capital expenditures. Companies are also pursuing growth through mergers and acquisitions (M&A). In the U.S., M&A activity accelerated sharply in Q2 2026, with transactions of US$100 million or more rising by 88% in value and 29% in volume compared with the same quarter a year ago.1
Investment Momentum Is Driving Stronger Demand for Capital
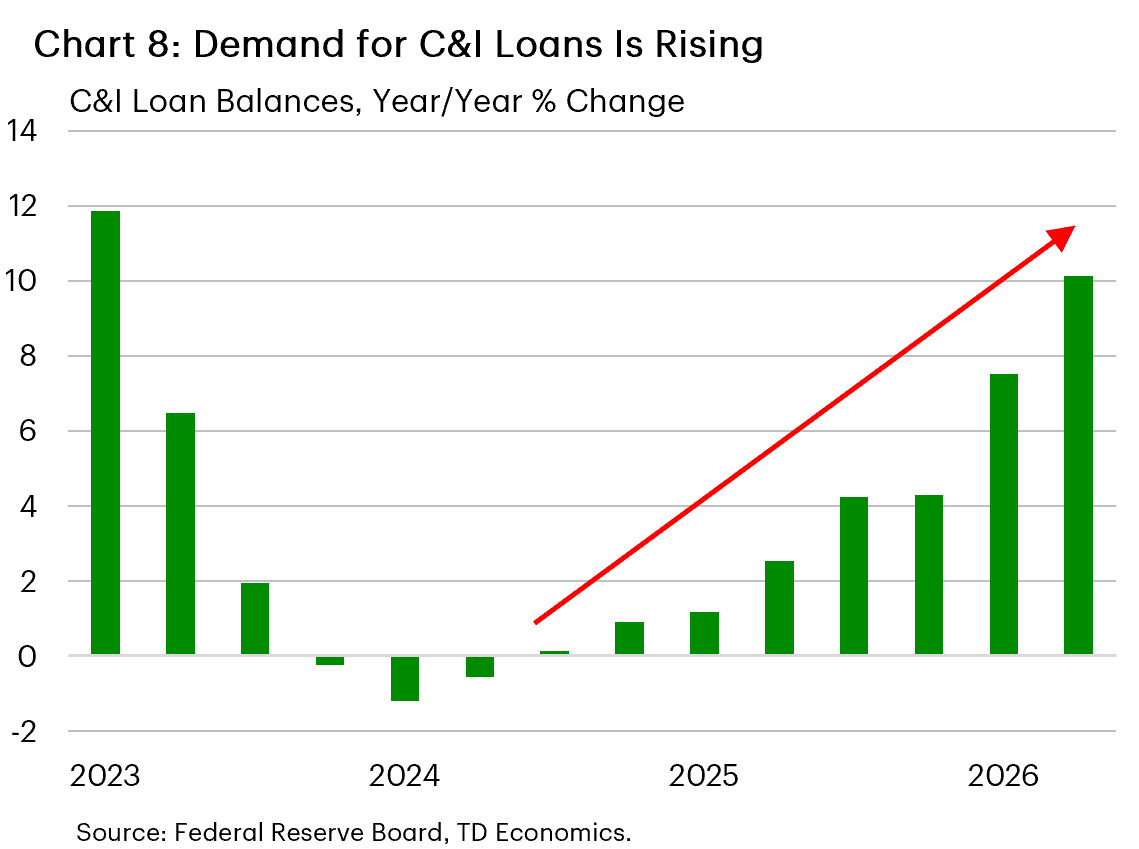
Healthy growth in business investment and brisk M&A activity is translating into stronger demand for financing across various funding sources. Banks’ commercial and industrial (C&I) lending has accelerated sharply this year, with balances up 10% in the second quarter from the year-ago levels (Chart 8). The rebound in M&A activity is likely providing support for business lending as well. Although many large transactions are ultimately financed through bond issuance, acquisitions typically initially rely on bridge financing, revolving credit facilities and syndicated bank loans.
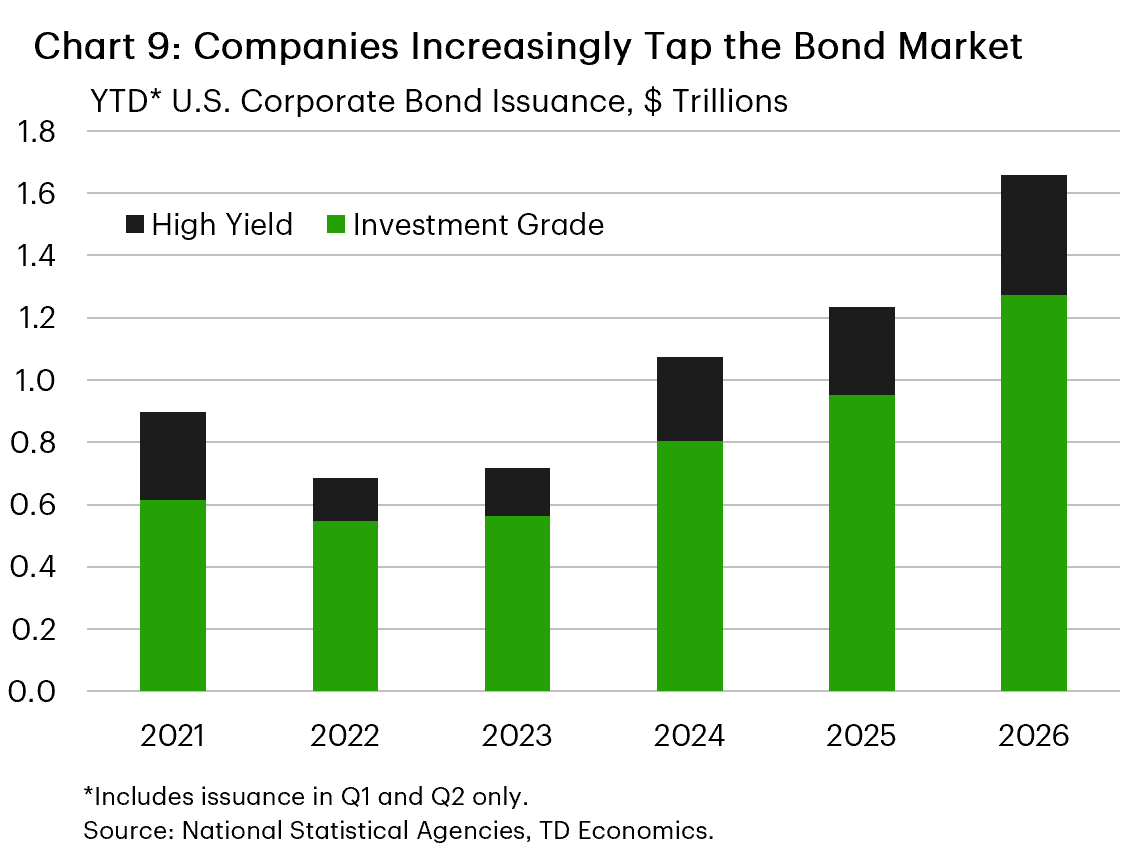
Corporate borrowing in bond markets has also surged. U.S. corporate bond issuance has reached a record pace of roughly $2 trillion in the first two quarters of 2026, with investment-grade (IG) issuance up 34% and high-yield (HY) issuance up by 36% (Chart 9).
AI-related investment is an important part of the story as it is increasingly being financed with debt. AI-related bond issuance topped $250 billion in in the first half of the year, accounting for 20% of the total IG and HY issuance.2 The four largest tech companies – Amazon, Alphabet, Meta Platforms, and Oracle – were responsible for about 70% of the total AI-related bond issuance as they burn through their free cash at an unprecedented pace and increasingly rely on debt financing.3 4
Rising Corporate Financing Needs Meet Supportive Lending Conditions
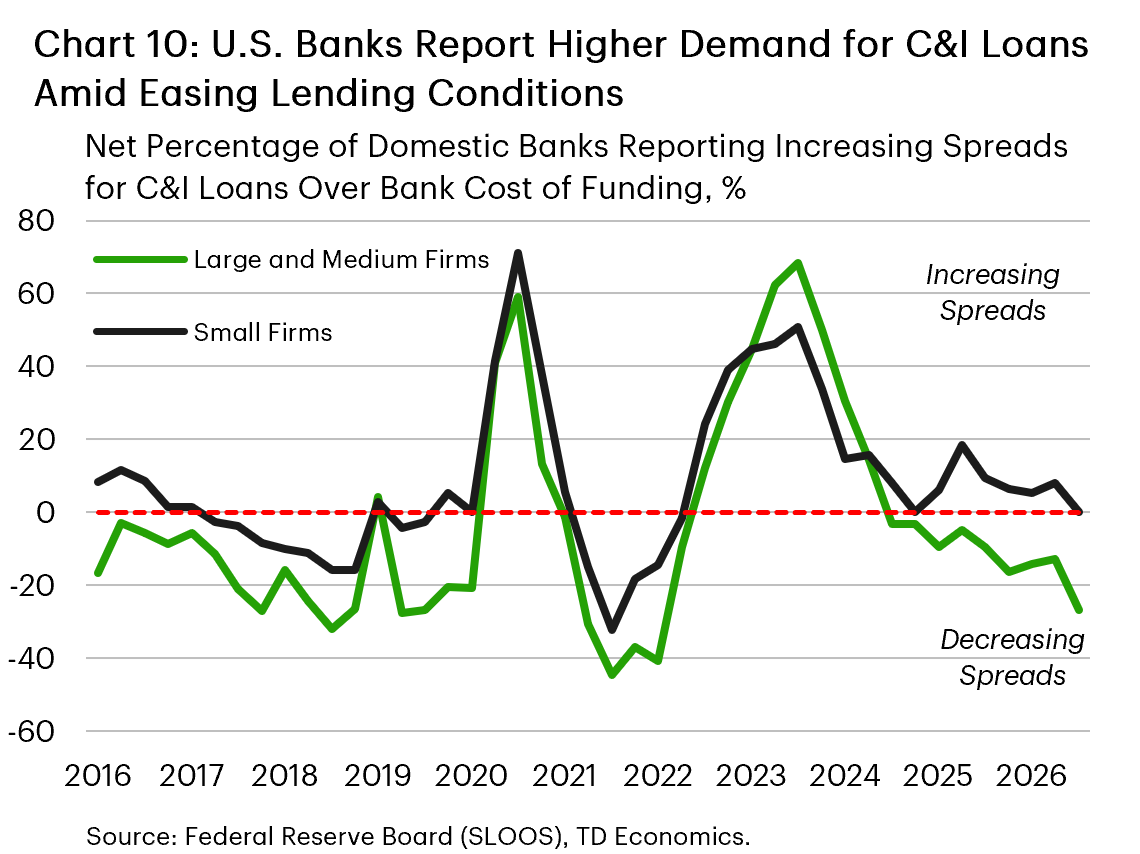
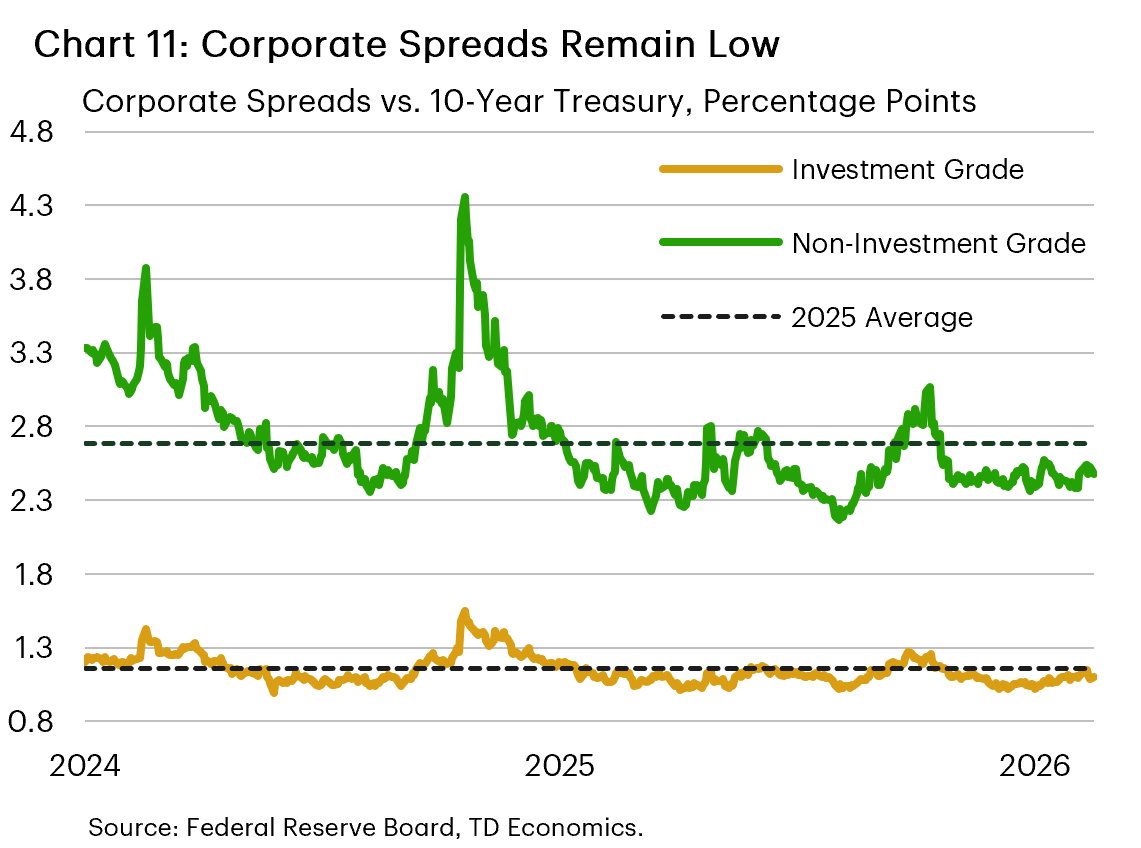
Importantly, despite some market jitters earlier this year around the scale of AI spending and private credit lenders’ exposure to the software sector, credit markets remain highly supportive and financial conditions remain accommodative. Lending terms for C&I loans continued to ease in Q2, particularly for large and medium-sized firms (Chart 10), while banks also reported increased competition for commercial borrowers. Corporate bond spreads also remain low as investor appetite for new issuance remains strong, allowing companies to raise substantial amounts of capital on favorable terms (Chart 11).
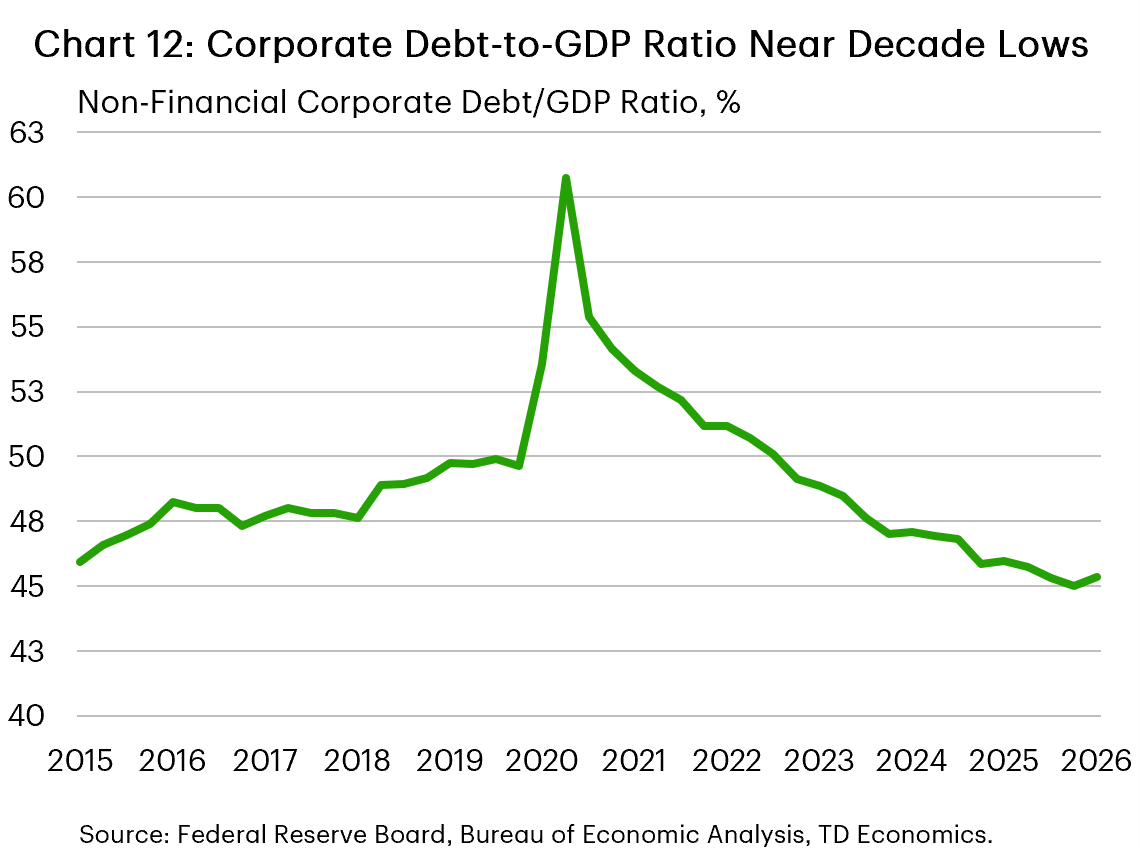
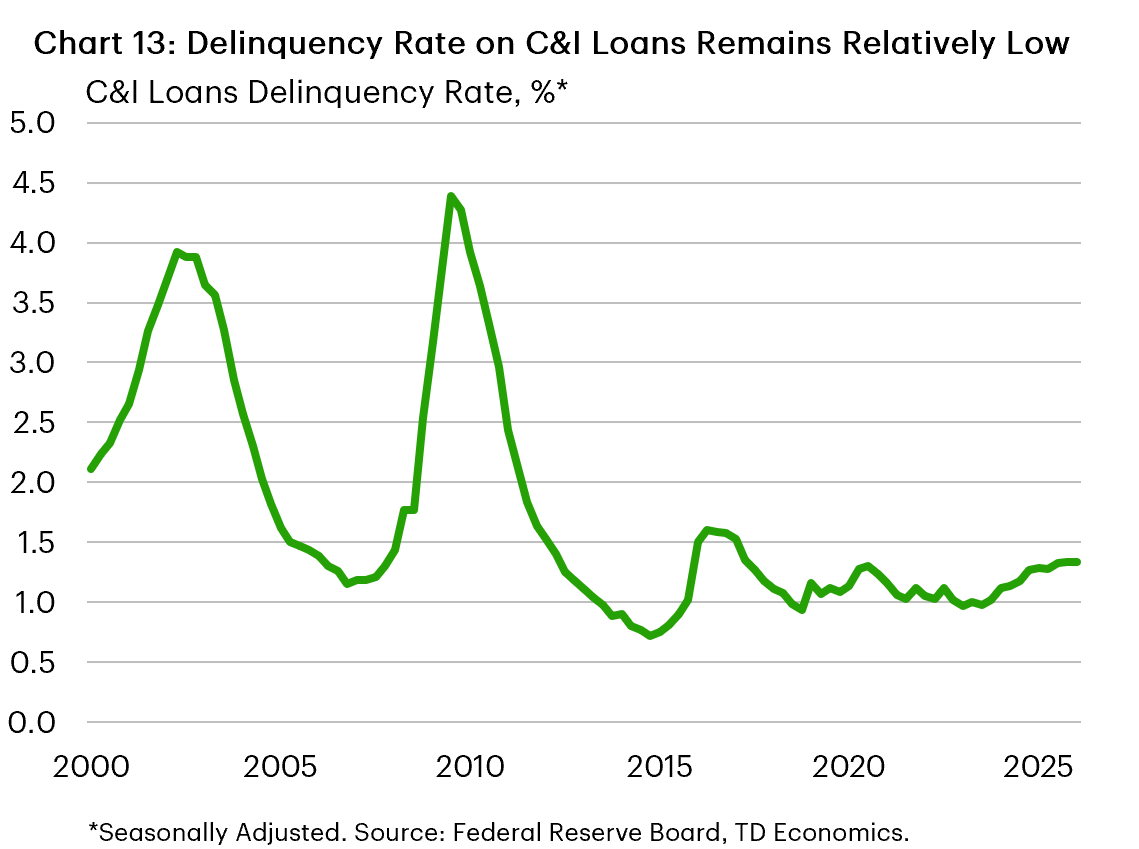
Importantly, the continued availability of credit does not appear to be masking a material deterioration in corporate fundamentals. Corporate profits remain high, up 12.8% from a year ago in the first quarter of this year. Corporate leverage also remains manageable. Measured as a share of GDP, aggregate leverage among U.S. non-financial corporates has declined from post-pandemic highs, falling to levels last seen in 2014 (Chart 12). The delinquency rate on C&I loans is up by about 35 basis points from its recent trough in Q3 2023 and is close to the peak level seen during the pandemic, but it does not appear concerning from a historical perspective (Chart 13).
The Federal Reserve continues to characterize vulnerabilities associated with business debt as moderate, noting that interest coverage ratios remain solid for investment-grade firms.6 Nevertheless, several risks warrant monitoring. First, the Federal Reserve noted that “debt-servicing capacity was lower among some publicly traded non-investment-grade firms and riskier private firms, especially those that rely on floating-rate debt such as leveraged loans and private credit”. These firms remain vulnerable should interest rates rise or remain elevated for longer than currently expected.
Second, while aggregate leverage has stabilized, recent corporate borrowing has become increasingly concentrated among a relatively small group of firms undertaking exceptionally large AI-related investment programs. Most hyperscalers continue to maintain strong balance sheets, meaning that the key risk is less about current leverage and more about whether future returns ultimately justify the scale of their current and future capital commitments. This is particularly relevant because a significant portion of those future commitments, including long-term data center leases, are not yet reflected on their balance sheets and thus are not being captured in traditional leverage measures.5
Third, the AI boom has increased equity-market concentration, with the five largest AI-related companies now accounting for roughly 24% of S&P 500 market capitalization, more than double their average share prior to the AI era. Thus, any material slowdown in AI-related demand, reassessment of AI-related earnings expectations, or deterioration in financial conditions could have a disproportionate impact on these companies’ valuations, financial markets, and the economy at large.
Bottom Line
Business investment is one of the brighter spots in the U.S. economy, and the upswing is becoming broader than the AI story alone. While AI-related spending continues to dominate headlines, investment growth is expanding into industrial equipment, driven by an upswing in manufacturing and defence, software, and research and development. Policy incentives, reshoring efforts, and improving capex intentions are reinforcing these trends, while stronger merger and acquisition activity points to a corporate sector that remains willing to pursue growth despite ongoing uncertainty.
For now, credit markets are meeting these rising financing needs with little strain. Bank lending standards have eased, loan demand has improved, and corporate bond issuance has set a record pace against a backdrop of narrow spreads and strong investor appetite.
Corporate fundamentals also remain solid, with high profitability and manageable leverage. Vulnerabilities remain concentrated among lower-rated and floating-rate borrowers, while a small group of AI-focused firms is undertaking exceptionally large capital commitments that increasingly rely on debt financing and future lease obligations. Still, with investment broadening beyond a handful of AI-related categories and credit conditions remaining accommodative, the pickup in borrowing looks more like fuel for expansion than evidence of widespread excess.
End Notes
- https://www.ey.com/en_us/insights/mergers-acquisitions/m-and-a-activity-report
- https://pitchbook.com/news/articles/bond-issuance-backing-ai-investment-tops-250b-testing-limits-of-voracious-investor-demand
- https://www.goldmansachs.com/insights/videos/will-ai-driven-corporate-debt-strain-credit-markets
- https://www.reuters.com/business/retail-consumer/ai-data-centre-race-builds-1-trillion-lease-burden-big-tech-2026-08-04/
- https://www.wsj.com/tech/ai/why-big-techs-ai-spending-is-3-trillion-higher-than-it-seems-e1067bb2?mod=djem10point “Why Big Tech’s AI Spending Is $3 Trillion Higher Than It Seems”
- https://www.federalreserve.gov/publications/files/financial-stability-report-20260508.pdf
Disclaimer
This report is provided by TD Economics. It is for informational and educational purposes only as of the date of writing, and may not be appropriate for other purposes. The views and opinions expressed may change at any time based on market or other conditions and may not come to pass. This material is not intended to be relied upon as investment advice or recommendations, does not constitute a solicitation to buy or sell securities and should not be considered specific legal, investment or tax advice. The report does not provide material information about the business and affairs of TD Bank Group and the members of TD Economics are not spokespersons for TD Bank Group with respect to its business and affairs. The information contained in this report has been drawn from sources believed to be reliable, but is not guaranteed to be accurate or complete. This report contains economic analysis and views, including about future economic and financial markets performance. These are based on certain assumptions and other factors, and are subject to inherent risks and uncertainties. The actual outcome may be materially different. The Toronto-Dominion Bank and its affiliates and related entities that comprise the TD Bank Group are not liable for any errors or omissions in the information, analysis or views contained in this report, or for any loss or damage suffered.
Download
Share: