Is the U.S. Manufacturing Rebound Real?
Andrew Foran, Economist | 416-350-8927
Date Published: August 13, 2026
Category: U.S. Commodities & Industry
Highlights
- The manufacturing rebound is real, but headline shipment growth overstates the underlying improvement once price effects are stripped out.
- Real output gains remain concentrated in transportation equipment, defense-related production, and technology supply chains tied to AI infrastructure, rather than a broad-based revival.
- Existing backlogs and announced capacity additions should support near-term activity, but elevated energy costs, tariff-related input pressures, and tighter financial conditions are likely to limit the expansion’s breadth and durability.
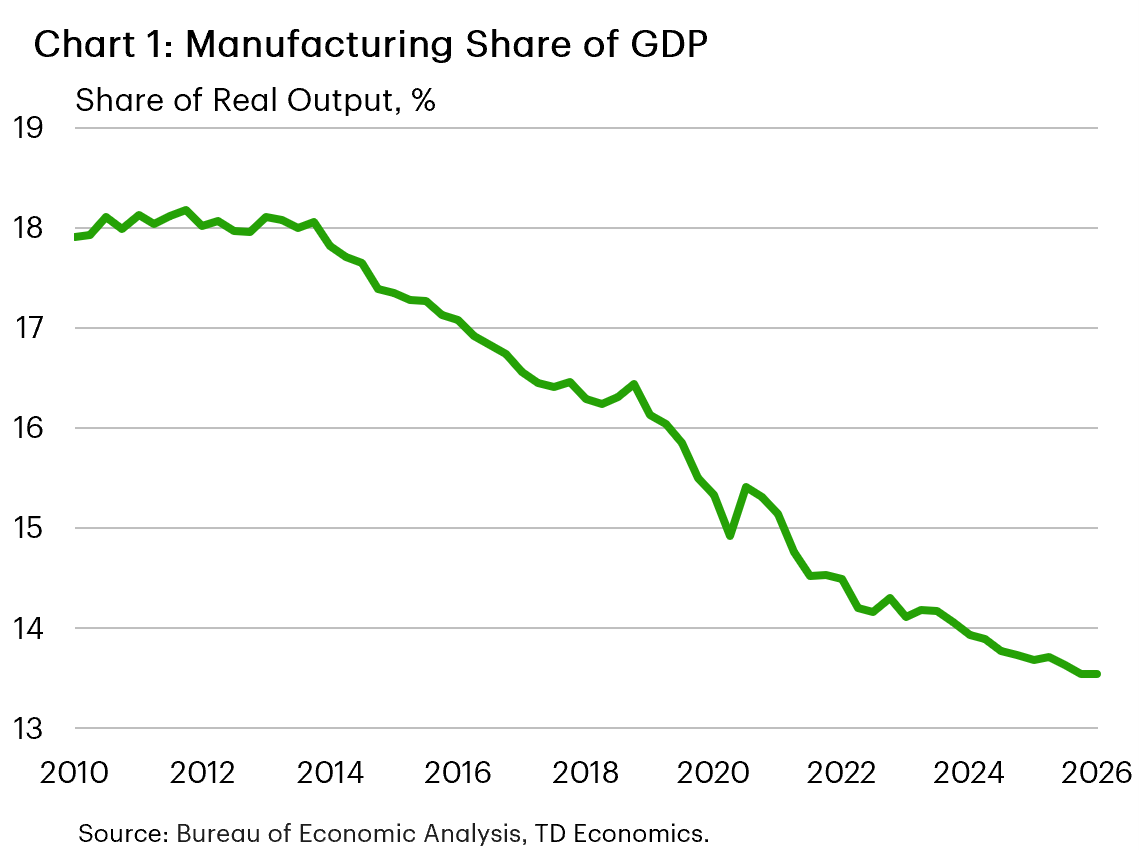
Manufacturing accounts for roughly one-seventh of U.S. gross output, representing approximately $7.5 trillion in annual economic activity. However, the sector’s share of total output has declined consistently over the past 15 years (Chart 1). More recently, that decline has begun to moderate, with manufacturing activity drifting into expansion territory in 2026. This raises questions about what is driving the improvement and whether it can be sustained.
At first glance, the evidence points to a decisive turnaround: manufacturing shipments have risen by approximately 9% over the past year, the strongest increase since late 2022. However, shipment values measure revenues rather than production volumes and can be heavily influenced by changes in prices. Looking beneath the headline figures reveals a more nuanced picture, raising questions about how much of the acceleration reflects a genuine increase in real output, which industries are driving the improvement, and whether the conditions are in place for a durable manufacturing recovery.
Is Manufacturing Activity Finally Turning the Corner?
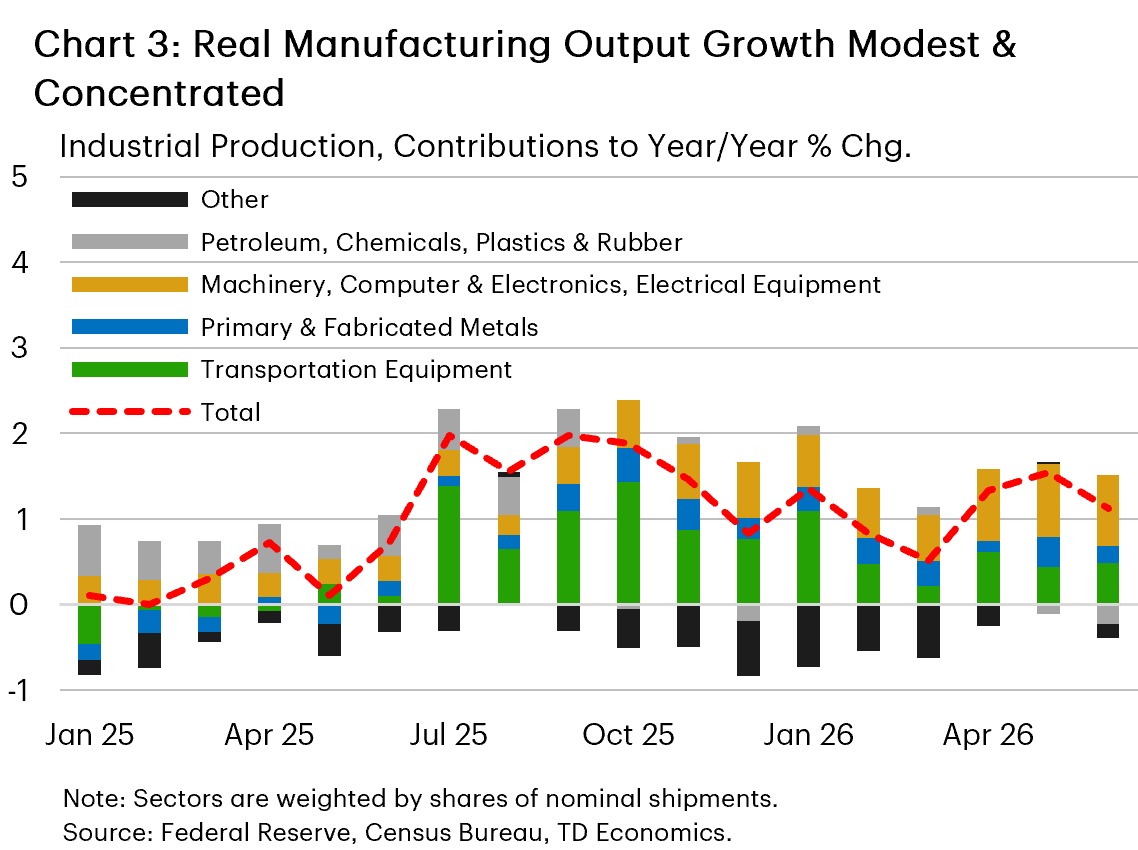
Across indicators, manufacturing has undoubtedly entered 2026 on a stronger footing. Shipments, new orders, and backlogged orders have all risen over the first half of the year, suggesting that demand has solidified. However, this strength is exaggerated by notable price pressures among certain product groups, with energy prices being the most significant. In fact, roughly half of the 9% year-on-year increase in manufacturing shipments is accounted for by petroleum, chemicals, and plastics & rubber products (Chart 2), with the latter two also exposed to energy price fluctuations. After adjusting for prices, real shipments across all three categories are flat to negative, indicating that their outsized contribution to nominal shipment growth largely reflects higher prices rather than an expansion in physical output. This is further corroborated by Federal Reserve industrial production data, which measure real activity and show modest contractions in petroleum and chemicals output, while plastics & rubber production has been roughly flat.
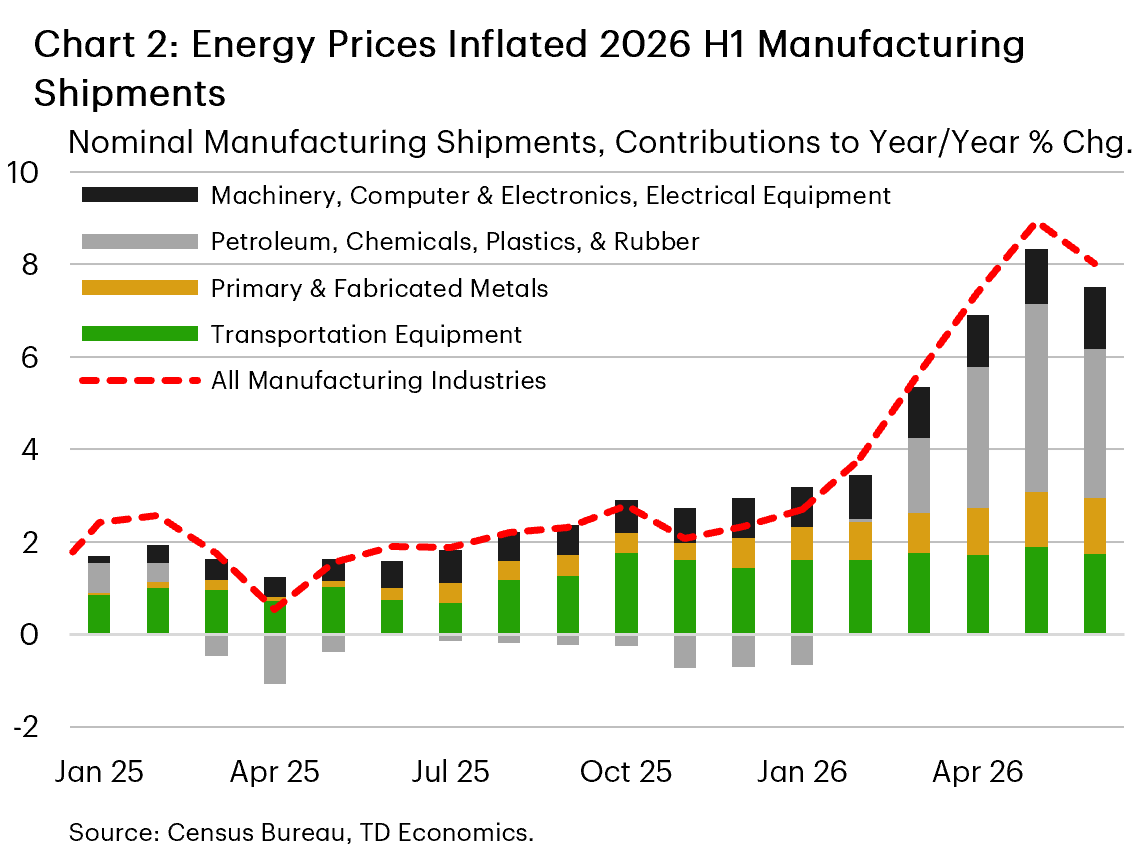
Beyond these energy-related industries, growth in nominal shipments has been supported by transportation equipment, machinery, computers & electronics, primary metals, and fabricated metals. Together, these industries account for a significant share of manufacturing activity and suggest that the recent improvement extends beyond sectors directly exposed to energy prices. However, price effects remain evident in several categories. Tariffs on steel, aluminum, and copper have likely supported shipment values within primary and fabricated metals, while strong demand for AI-related infrastructure appears to be contributing to higher prices within computer and electronic products.
Stripping away these price effects leaves a more modest manufacturing expansion. Transportation equipment and machinery show the clearest evidence of real growth, while computer and electronic products are also contributing to the broader upturn (Chart 3). Together, these industries have helped lift real manufacturing output by roughly 1% to 1.5% year-on-year for much of the past year. This is a step below the long-run average of 1.7%, reflecting the more subdued nature of real manufacturing output growth in the current economic environment.
Transportation & Technology Driving Manufacturing Growth
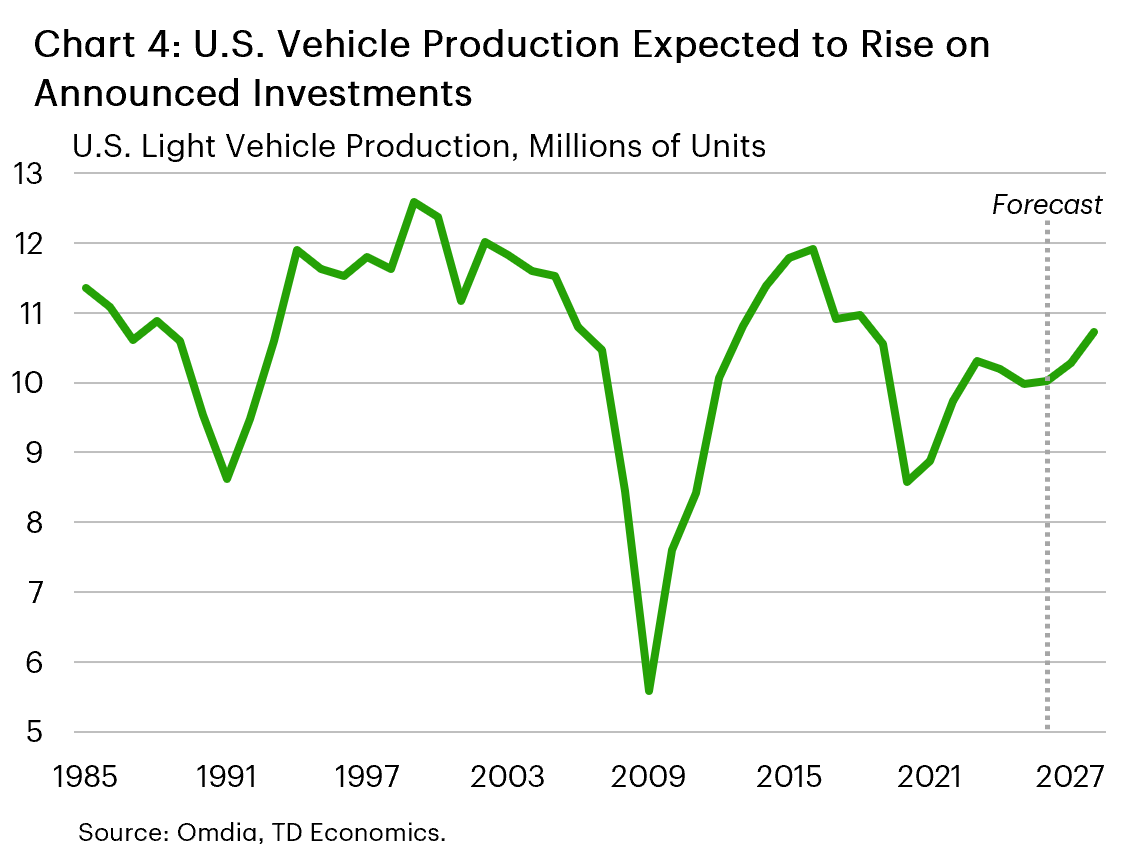
By far the largest manufacturing sector, transportation equipment, encompasses a broad range of products. Light and heavy vehicles, commercial airplanes, ships, and defense equipment are all captured by this category. Automotive manufacturing has been in the spotlight over the past year, as the first product targeted with new Section 232 (national security) tariffs in early 2025. In response to the tariffs, several automakers have announced investments to increase production capacity, however most of these production enhancements are not expected to become operational until 2027 or later.
The recent uptick in automotive production is more so related to a rebound following last year’s slump. Less than 10 million light vehicles were produced in the U.S. last year, marking a three-year low, as the industry adjusted to new tariff policies. Production is on an upward trend now and will soon be aided by production investments over the medium term through 2027-2028. Announced investments to date have been largely incremental in nature, with no new greenfield investments to date. This means that production is likely to expand back into the 10–11-million-unit range – its historical average – but not meaningfully above (Chart 4). This is partly a function of slowing population growth, which will weigh on demand for new vehicles over the long-term.
The other segment of transportation equipment manufacturing driving activity higher is related to rising defense spending. The One Big Beautiful Bill Act of 2025 allocated $150 billion to defense spending, which comes on top of baseline appropriations. The funding was allocated over the next 5-10 years, but the Department of War has stated that it will spend much of this funding between this year and next. This funding is also expected to be joined by another $60 billion, as Congress attempts to pass supplemental funding related to the conflict in the Middle East. Cumulatively, this puts defense spending for this year above $1 trillion, with the Department of War seeking $1.5 trillion for the coming fiscal year.
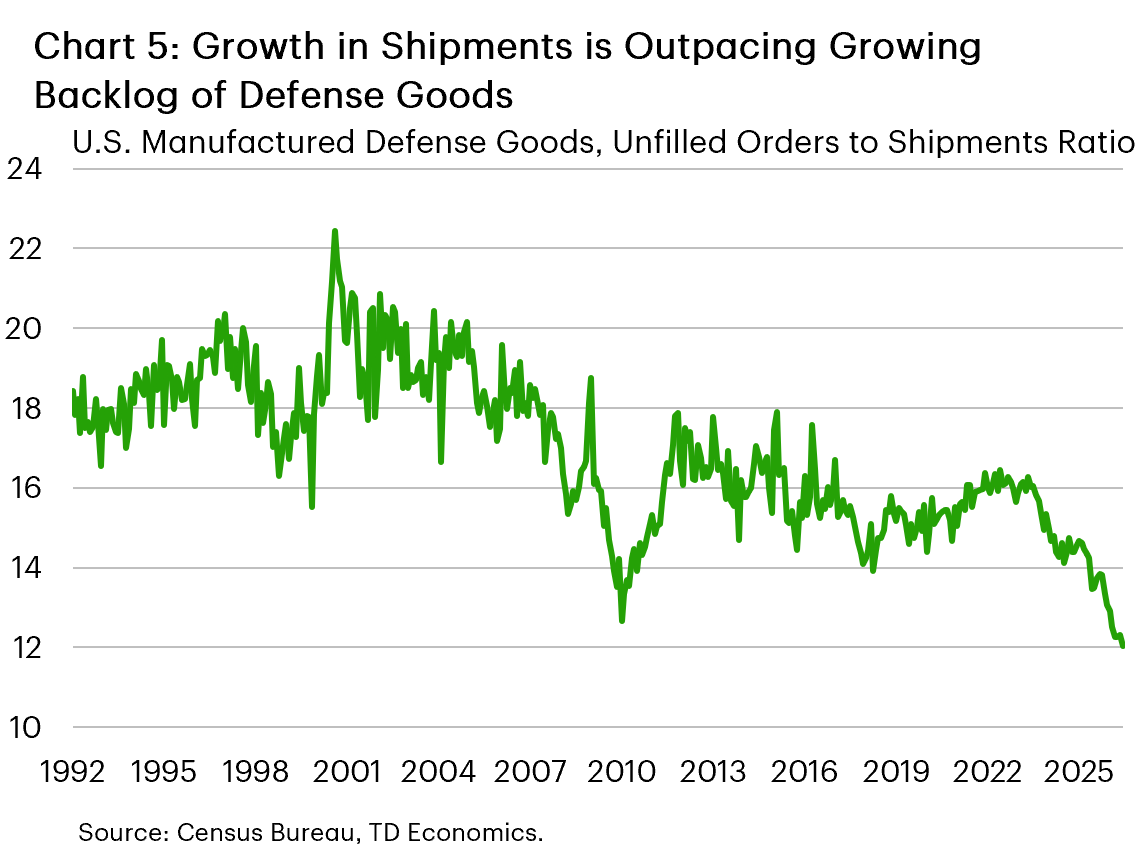
Although this is significant funding, the defense industrial base has struggled with production capacity constraints for years. Part of the One Big Beautiful Bill Act sought to alleviate these pressures through targeted investments, but it will take time for these investments to become operational. Nevertheless, the increase in funding combined with these investments is expected to remain a structural source of support for manufacturing activity over the coming years. Furthermore, the pace of shipments of defense goods has accelerated over the past few years, which may help to accelerate the time in which it takes to clear backlogs (Chart 5).
Beyond transportation equipment, technology manufacturing is the other sector currently supporting manufacturing activity. This includes the machinery, computer & electronics, and electrical equipment manufacturing sectors. Collectively these sectors account for 14-15% of manufacturing activity, but the significant expansion in AI infrastructure investments is leading to an outsized contribution to growth from these categories. While the machinery sector includes various subcategories (i.e. machinery for farming, construction, mining, etc.), the categories currently driving much of the growth are those used in datacenters (i.e. HVAC, power equipment, & semiconductors). Secondary categories, like construction machinery, are also seeing a boost which is likely at least partly related to the surge in datacenter construction activity.
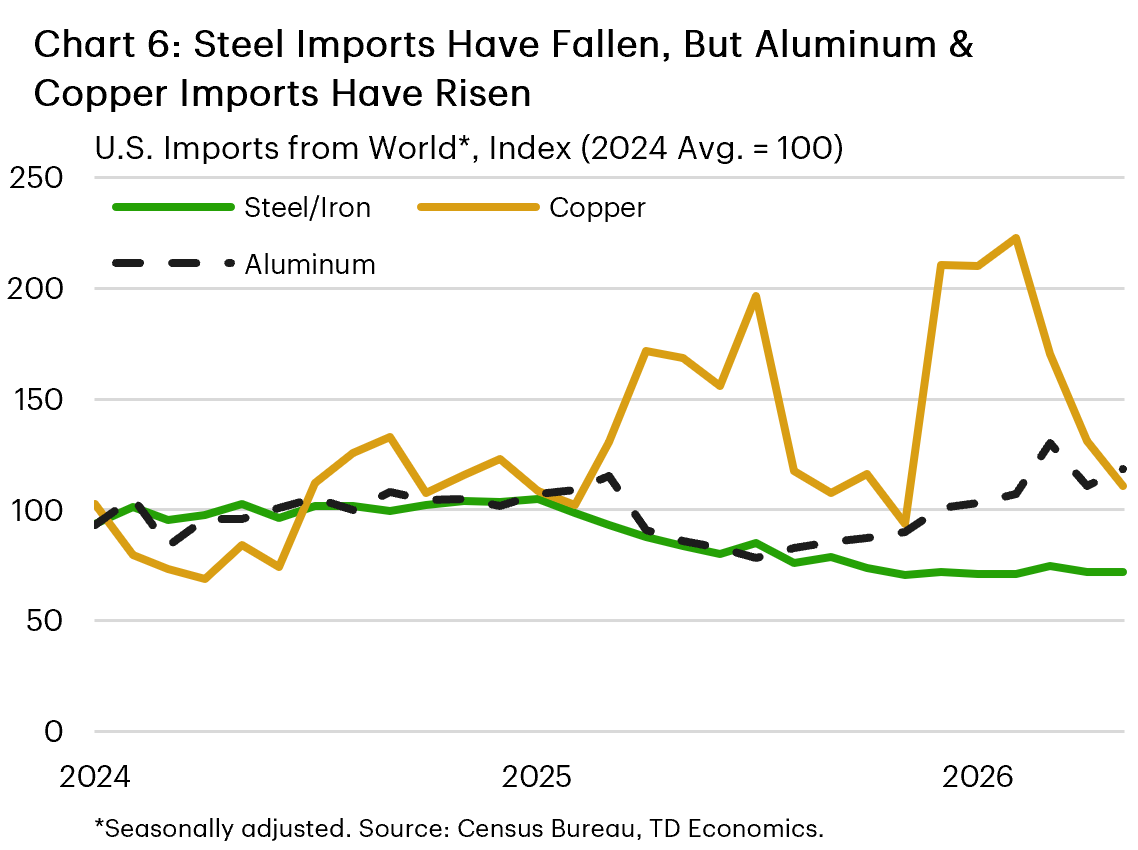
The remaining growth in manufacturing output is coming from higher real output in the primary metal and fabricated metal manufacturing sectors. Tariffs on steel, aluminum, and copper have remained at 50% for over a year now, which appears correlated with higher production in manufactured metals. Based on nominal import data, this seems to be concentrated in steel, for which imports are roughly 25% below late 2024 levels (Chart 6). In contrast, imports of aluminum and copper are both roughly 10-20% higher than late 2024 levels, although this likely incorporates the higher cost of imports with tariffs.
On aggregate, manufacturing has real catalysts supporting output, partly stemming from high tariffs on select goods, higher defense spending, and robust demand for AI infrastructure. Now the question becomes, can the expansion be sustained amid elevated energy prices and rising interest rates?
Accelerate, Decelerate, or Stay the Course?
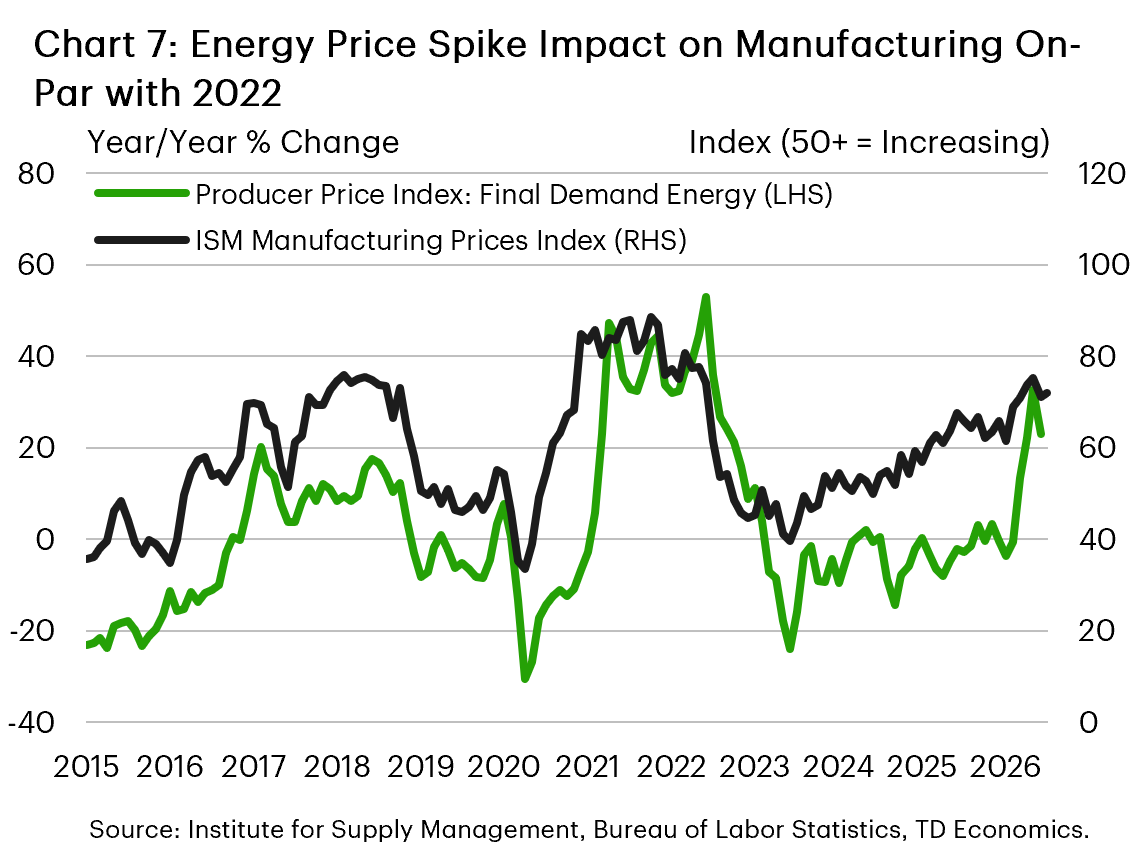
The biggest near-term headwind which could offset the tailwinds in automotives, defense, and technology is the increase in energy prices. Although this has bolstered revenues for domestic energy producers, it simultaneously creates challenges for most other manufacturing sectors. This has shown up clearly in the 20-30% year-on-year spike in the producer price index for energy (Chart 7). The ISM Manufacturing survey prices paid index is also in the range of 70-80, which is consistent with a period of pronounced price pressure, last recorded during the energy price spike in 2022 following the Russian invasion of Ukraine. Although oil prices initially fell following the ceasefire announced between the U.S. and Iran in June, the resumption of hostilities has kept oil prices roughly 50% above their pre-conflict level. If this is sustained, then manufacturers would likely face challenges in digesting these costs.
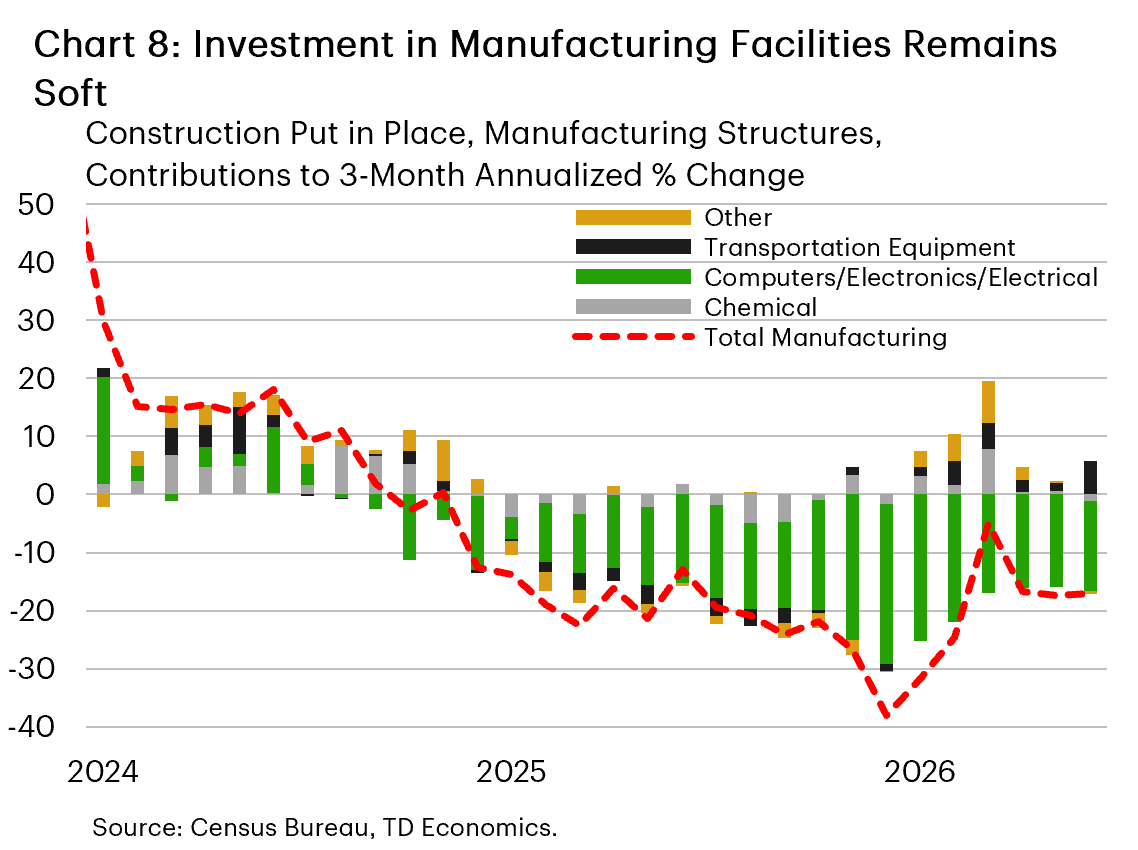
The second headwind facing manufacturers is that financial markets have increasingly priced in the possibility for the Federal Reserve to begin hiking interest rates in response to the impact that geopolitical tensions are having on inflation. This has already led to an uptick in bond yields, which is tightening financial conditions for businesses and will likely lead to continued restraint in investment activity (Chart 8). In turn this would likely weigh on future manufacturing production as investment is required to sustain growth over the long-term.
The third headwind, which is not net new in 2026, is the enactment of tariffs on imported goods. Looking at Chart 7, you can see that the ISM Manufacturing Index Prices Index was already trending near multi-year highs before the energy price spike earlier this year. Similar to the way in which higher energy prices are benefiting some industries but weighing on most others, tariffs are having a similar impact as they boost demand for certain domestic producers while raising costs for most others.
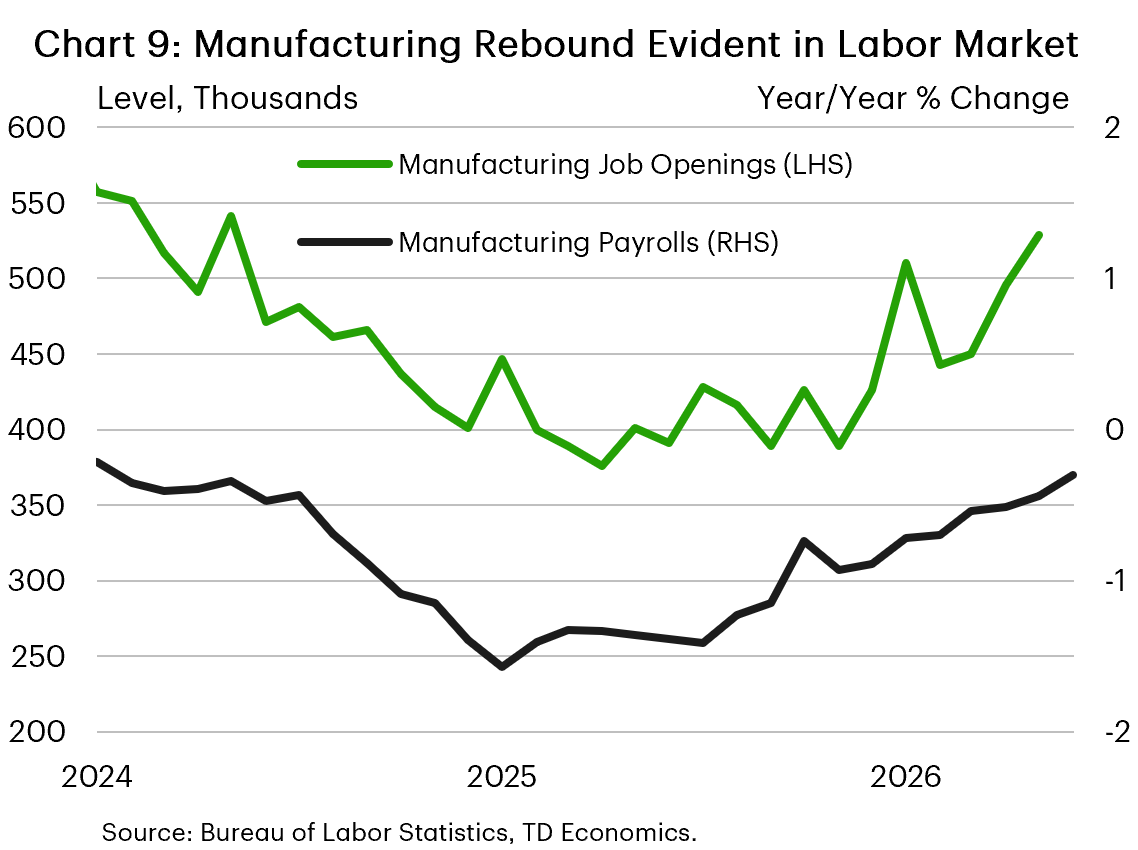
Cumulatively, these headwinds are likely to prevent the current expansion in manufacturing activity from broadening materially beyond its current concentration in automotives, defense products, and technology. However, the support coming from these sectors is likely to allow manufacturing to remain a net contributor to economic growth and the labor market (Chart 9) moving forward, sustaining the moderate rebound that it has thus far fostered.
Bottom Line
The manufacturing rebound is real, but it remains narrower and more qualified than headline shipment data suggest. After adjusting for price effects, the improvement is concentrated in transportation equipment, defense-related production, and technology supply chains tied to AI infrastructure, rather than a broad-based revival across the sector. These catalysts should keep manufacturing activity on a firmer footing over the near term, particularly as existing backlogs are worked down and announced capacity additions gradually come online. However, elevated energy costs, tariff-related input pressures, and tighter financial conditions are likely to limit the breadth and durability of the expansion. As a result, manufacturing should remain a modest contributor to growth, but the evidence does not yet point to a self-sustaining or economy-wide industrial resurgence.
Disclaimer
This report is provided by TD Economics. It is for informational and educational purposes only as of the date of writing, and may not be appropriate for other purposes. The views and opinions expressed may change at any time based on market or other conditions and may not come to pass. This material is not intended to be relied upon as investment advice or recommendations, does not constitute a solicitation to buy or sell securities and should not be considered specific legal, investment or tax advice. The report does not provide material information about the business and affairs of TD Bank Group and the members of TD Economics are not spokespersons for TD Bank Group with respect to its business and affairs. The information contained in this report has been drawn from sources believed to be reliable, but is not guaranteed to be accurate or complete. This report contains economic analysis and views, including about future economic and financial markets performance. These are based on certain assumptions and other factors, and are subject to inherent risks and uncertainties. The actual outcome may be materially different. The Toronto-Dominion Bank and its affiliates and related entities that comprise the TD Bank Group are not liable for any errors or omissions in the information, analysis or views contained in this report, or for any loss or damage suffered.
Download
Share: