Highlights
- Since December 2021 consumers have spent six percent of the $1.7 trillion in excess savings built up during the pandemic. Of the remainder, the top 50% of income earners are holding roughly 70%.
- The existence of excess savings argues for a steady pace of spending, especially by higher-income families, who tend to spend more on services that have not yet fully recovered.
- Should higher income consumers become dramatically more cautious and stop spending out of excess savings, the economy could fall into a recession. Still, the extent of economic deterioration should be rather mild as households will (at least partially) offset income losses by tapping into this pandemic windfall.
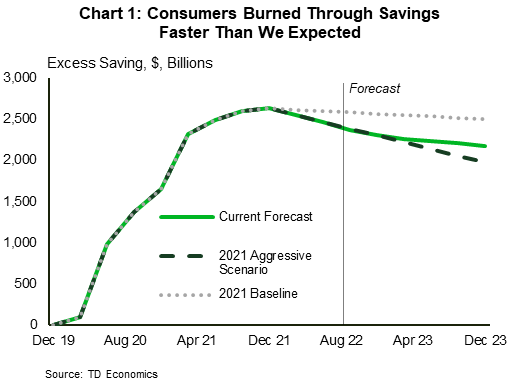
Americans amassed a record amount of excess savings through the pandemic. Excess savings is an intangible concept. We define it as the savings that built up during the pandemic that was beyond what pre-pandemic trends would have projected. This occurred both through forced spending reductions due to pandemic restrictions, and bonus income that came through multiple rounds of stimulus checks. According to our calculations, these “excess” savings reached a peak of $2.7 trillion or 10% of GDP by December 2021. Since peaking, some of those savings have made their way back into the economy, though a disproportionate share remains on household’s balance sheets today.
The drawdown in savings this year has been faster than we had expected. In fact, it closely mirrors the most aggressive drawdown scenario in our previous analysis. High inflation has forced households to rely on these savings to offset the rising costs of everyday goods. In fact, there’s a case to be made that absent these savings, households would have already buckled under the weight of rising interest rates and persistent inflationary pressures. Instead, consumers have shown a degree of resilience, with spending growth having slowed to a sub-trend pace through the first half of the year but remained in positive territory.
With inflation pressures likely to persist for some time and more rate hikes expected from the Federal Reserve, the headwinds facing consumers are unlikely to abate anytime soon. Our current baseline forecast assumes a two-year period of stagnant growth but a deeper retrenchment will hinge on consumer resiliency. History isn’t in the Fed’s favor. But, never before have consumers had such an arsenal of savings. Key to whether excess savings will be enough is who holds the excess savings. In this paper, we take a deeper dive into who is holding the excess saving and whether it alone can help households weather the storm.
Price Shock Burned a Hole in Excess Saving
In our previous report on excess savings, we assumed that only 5% (or $130 billion) of the pandemic buildup of savings would be spent by the end of 2023. One year later, consumers have already spent 6% of these savings within half the time (Chart 1). Indeed, some of the drawdown can be tied to consumers funding activities that had been forgone during the earlier stages of the pandemic. But this isn’t telling the whole story.
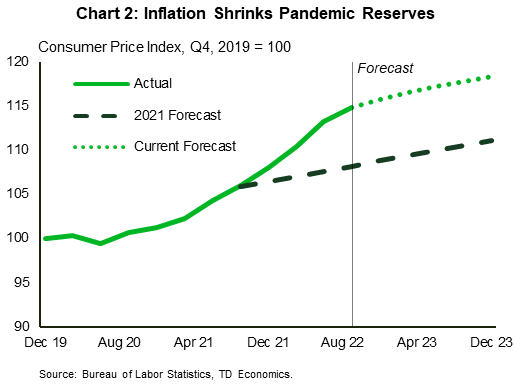
Inflation has come in far higher than we had expected and has been a key factor in the larger drawdown of excess savings (Chart 2). As the cost of non-discretionary goods increased, so too did household’s burn rate on excess savings. Through the first half of the year, nominal consumption increased by $176B, roughly the same as the drawdown in savings. This implies that households used the savings as a buffer to help absorb the unexpected food and energy price shock. Also, the excess savings cushion was the difference between consumer spending expanding and contracting through the first half of the year. Absent these savings, we might have been having a different conversation of whether the U.S. economy would skirt a recession.
Affluent Consumers Have More Savings to Support Spending
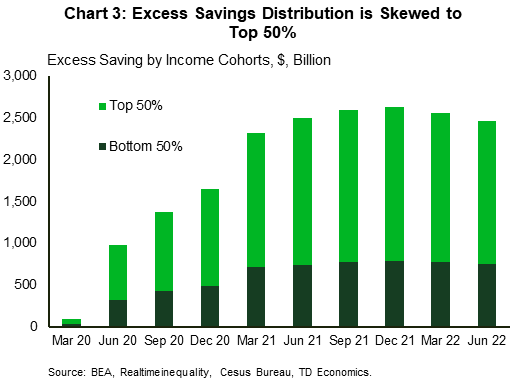
Gaining insights on who continues to hold most excess savings is useful in explaining whether the capacity remains to keep real spending growth positive in the face of persistently high inflation. To do that, we estimate an allocation of excess saving to families of various income distributions.1 Our estimates suggest that households in the lower half of the income distribution account for less than a third of excess saving with the top 50% holding most of the pandemic reserves (Chart 3). Higher income consumers spend less than one-fifth of their budgets on essential goods, and roughly 40% on discretionary services (ten percentage points higher than lower income consumers). It was services expenditures that were more severely curtailed by pandemic restrictions resulting in more forced savings at higher income levels. In addition, apart from those in the highest income brackets, many middle and high-middle income families were still eligible for stimulus checks.
In contrast, lower-income families were more likely to see their incomes reduced, and much of their excess saving came in the form of stimulus checks and unemployment benefits – bridge funds intended to be spent. Although these families’ cash cushion remains larger than before the pandemic, they remain more vulnerable to rising costs. As a result, these households may become relatively more cautious shoppers should they try to preserve financial security in case of a future downturn.
There’s Still Pent-up Demand for Services
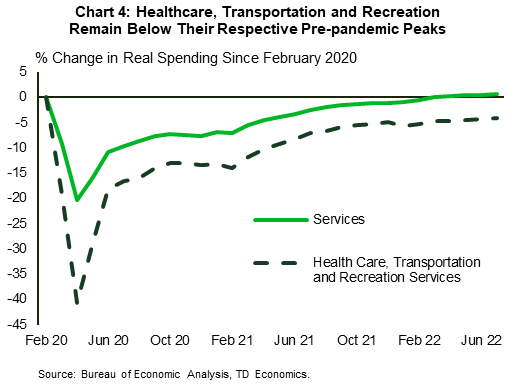
Still, on aggregate, consumer fundamentals remain strong and argue for a steady pace of spending, despite rising costs. Goods spending, apart from autos, is likely to remain sub-par after rising 14% above trend during the pandemic. However, services spending is still in recovery mode and should continue to gain ground, albeit at a slower pace than we expected earlier this year. Despite an acceleration in spending on some favorite pre-pandemic activities (like travel), consumers spending on services has not fully recovered in all areas.
Most of the weakness in services spending remains concentrated in the categories that suffered deeply early in the pandemic. The three sub-categories that remain below pre-pandemic levels are health care, transportation and recreation services. Collectively, these three spending categories, which accounted for half of the pandemic-induced collapse in total consumer services, remain 4.3% below their peak in January 2020 (Chart 4).
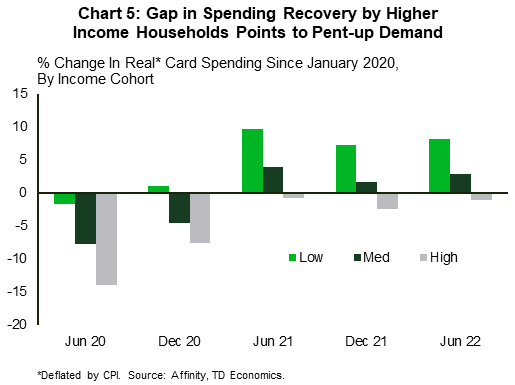
Socioeconomic factors offer some explanation as to why the degree of transitioning away from goods in favor of services is smaller than earlier anticipated. At least 60% of services spending is done by higher income households that have a greater ability to work remotely and stronger health-related reluctance to spent time in crowded places. According to the Opportunity Insights economic tracker – a publicly available database that tracks the economy in real time – to this day, there remains a gap between the card spending of households across income distributions.2 Specifically, spending of middle- and high-income families – those who account for at least two-thirds of overall expenditures– recovered by less in percentage terms. In fact, real spending by the most affluent consumers remained below their pre-pandemic levels (Chart 5).
Some of these changes in consumption behavior could result in an extremely long lag in the recovery of spending on some services. For example, intracity mass transport, which accounted for 4% of transportation services in February 2020, was still down by almost 50% in July, reflecting the impact of white-collar jobs moving to remote work
 arrangements. Indeed, transit agencies that conducted mobility recovery studies, such as Chicago Metropolitan Agency for Planning, NJ Transit and Bay Area Rapid Transit, don’t expect transit ridership to return to pre-pandemic levels until year 2030 or later.
Still, other categories, typically afforded by higher earners, may have better chances at full recovery as health concerns continue to subside. Americans are still emerging from what psychologists call “cave syndrome’’ – a reluctance to leave the safety and comfort of home, which stops people from going to museums, attending concerts and other recreational events.
Another example is healthcare services. During the pandemic, deferrals of certain elective surgeries have led to large backlogs in procedural care while reductions in new diagnoses and other specialties, like radiology, caused the deferral of millions of elective procedures. According to the study conducted by JAMA Network, the U.S. health care system is on the verge of advancing wave of surgical need as patient demand for elective procedures snaps back (although limited capacity may bound this recovery).
Aptitude to Spend
In summary, middle- and high-income families have more capacity to spend from excess savings as well as more pent-up demand relative to lower-income households. But having the capacity to spend, and doing it are two different things.
Recent readings of consumer confidence by income cohorts expose a substantial degree of concern among well-off consumers. Indeed, they were behind the decline since the beginning of the year (Chart 6). One reason could be a sizeable decline in the stock market, with the S&P 500 shedding around 20% of its value in the first six months of the year, dampening financial wealth. Sagging wealth, particularly in stocks that can easily be sold and used for spending, can weigh on consumer intentions.

A Penny Unsaved is a Penny Spent
All that excess savings should help keep the economy out of deep trouble. Our current estimates suggest that real expenditures will grow at an average annualized rate of 1.4% for the rest of the year and at roughly 1% in 2023 (assuming PCE inflation declines from 6.5% to 2.0% in the same period). These projections imply that consumers draw down about a quarter of their excess savings in total from their peak level, to support spending.
Taking it one step further, this estimate assumes that consumers will be saving 5.5% of their disposable income on average, or two percentage points less than what they did before the pre-pandemic. It’s important to understand that saving at a lower rate doesn’t mean consumer are getting themselves into trouble. The saving rate is a flow measure that estimates what share of aggregate household income is unspent in each period. Between March 2020 and December 2021, the average saving rate was abnormally high at 14.3%, well above the pre-pandemic trend level of around 7.5%. This resulted in “excess” savings. So a period of a lower saving rate occurs as consumers spend a greater share of their current period income funded by previous periods’ savings.
By extension, saving a higher proportion income now would mean that consumers treat the remainder of pandemic savings as wealth, perhaps due to heightened uncertainty about the future. For the sake of argument, let’s consider such a case and assume that consumers stop dipping into their excess saving by early 2023, and their spending is mainly financed by income. In this scenario, the saving rate returns to its pre-pandemic average. Assuming this lower spending doesn’t trigger changes in inflation, this results in one-and-a-half of a percentage point difference in real consumer spending in 2023. This is a sizeable gap that implies two quarters of negative consumption growth and higher odds of recession.
While this scenario is within the realm of possibilities, it’s unlikely such an abrupt halt in spending would occur absent an income shock. The latter, however, is hard to imagine in the context of a persistently tight labor market. While we anticipate some weakness in employment going forward, the unemployment rate is not expected to rise higher than 5.1% two years from now. And even if unemployment rises higher and faster, we take comfort from the fact that economic deterioration should be rather mild as households will (at least partially) offset income losses by tapping into this excess savings cushion.
Bottom Line
American households built up savings through the pandemic, which, despite burning through one-fifth of it, remains substantial. The concept of excess savings, whether in the form of long-term assets or liquid reserves, is somewhat metaphysical and creates a dilemma: spending it today gives the economy better chances at landing softly, spending it later will soften the blow in case of a recession. In a way, the difference of economists’ opinions on whether the economy avoids recession reflects which view of the world they choose. Our belief is that excess savings will mitigate a sharp pullback in consumer spending, and help ride out the inflation tidal wave and period of below-trend growth. Since higher income earners have capacity to spend, the risk of a hard-landing falls more onto their shoulders. Our forecast hinges on the desire of these consumers to resume activities curtailed by the pandemic. However, confidence is a key risk to our outlook. If higher income households are worried about a recession, they may choose to keep their precautionary savings for a rainy day, particularly after experiencing heavy losses in their equity portfolios.
End Notes
- We use Census Bureau’s Consumer Expenditure Survey to estimate consumption to 2021 the Realtime Inequality statistics to project income distribution.
- “The Economic Impacts of COVID-19: Evidence from a New Public Database Built Using Private Sector Data”, by Raj Chetty, John Friedman, Nathaniel Hendren, Michael Stepner, and the Opportunity Insights Team. November 2020. Available at: https://opportunityinsights.org/wp-content/uploads/2020/05/tracker_paper.pdf
Disclaimer
This report is provided by TD Economics. It is for informational and educational purposes only as of the date of writing, and may not be appropriate for other purposes. The views and opinions expressed may change at any time based on market or other conditions and may not come to pass. This material is not intended to be relied upon as investment advice or recommendations, does not constitute a solicitation to buy or sell securities and should not be considered specific legal, investment or tax advice. The report does not provide material information about the business and affairs of TD Bank Group and the members of TD Economics are not spokespersons for TD Bank Group with respect to its business and affairs. The information contained in this report has been drawn from sources believed to be reliable, but is not guaranteed to be accurate or complete. This report contains economic analysis and views, including about future economic and financial markets performance. These are based on certain assumptions and other factors, and are subject to inherent risks and uncertainties. The actual outcome may be materially different. The Toronto-Dominion Bank and its affiliates and related entities that comprise the TD Bank Group are not liable for any errors or omissions in the information, analysis or views contained in this report, or for any loss or damage suffered.
Download
Download
Share this: