Highlights
- Over the course of the pandemic, U.S. households accumulated approximately $2.7 trillion in excess saving, amounting to roughly 13% of GDP.
- With the majority of the country effectively reopened since Independence Day, households have regained much of their ability to spend freely on goods and services, notwithstanding concerns around the Delta variant. As a result, some of these funds will likely be directed to increased consumption. The question is “how much?”
- Our forecast assumes that between 5% and 10% of accumulated excess saving will be spent by the end of 2023. This is in line with economic theory and evidence that households treat foregone consumption as wealth, implying a relatively small impetus to future spending.
- Alternative scenario analysis suggests that spending 15% to 25% of these reserves would result in an additional 0.4 to 0.7 percentage points in annual real output growth over the next year and a half. This represents upside risk to our outlook.
Since the beginning of the pandemic, the personal saving rate has fluctuated between a high of 34% in April 2020 and a low of 9% reached in June 2021. While the saving rate usually goes up in recessions as households build precautionary reserves, its level through the pandemic is unprecedented. It dwarfs the peak of 7% hit during the Global Financial Crisis and compares only to the 28% rate during World War II that was the consequence of heavy rationing.
This time, households were able to build up substantial nest eggs thanks to a combination of generous fiscal transfers and an inability to spend due to pandemic-related restrictions. This was not just an American phenomenon. In Europe, the United Kingdom, Canada, Japan and Australia strict containment measures were accompanied by generous government support, resulting in large increases in cumulative saving.
As economic activity gradually returns to normal, this stock of savings could be used to satisfy pent-up demand for things that households have been unable to do for the past year and a half – travel, dine out, attend concerts, etc. For forecasters, this raises the question of how much of this unprecedented ‘bounty’ to build into the outlook for consumer spending.
The question is non-trivial. We estimate that American households were able to save approximately $2.7 trillion relative to the pre-pandemic trend, roughly 13% of GDP. This is approximately twice the average of other advanced economies. Our forecast assumes that between 5% and 10% of this accumulated saving is spent by the end of 2023. This is in line with economic theory and evidence that households treat foregone consumption as wealth, which they are less inclined to spend in short order. Given that much of the shortfall is in services, spending may also be constrained by how quickly these industries can return to full capacity and how safe households feel to return to pre-pandemic patterns of behavior. Nonetheless, should savings be drawn down at a faster rate, it would represent upside risk to our growth and inflation outlook with implications for bond yields and central bank policy.
What is excess saving?
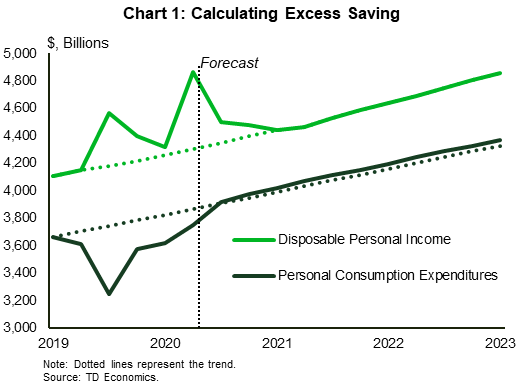
Excess saving amounts to the cumulative money an individual or household has saved above what they would have absent the pandemic. As an example, imagine a hypothetical individual earns $1,000 per month and spends $900 of it, saving $100 month or $1,200 a year. During the pandemic, she received an average of $1,100 (with government support programs) and spent an average of only $800 (due to restrictions), saving $300 a month or $3,600 a year. Her excess saving over that year is the difference – $2,400.
To calculate excess saving for the whole economy, we use the same approach, extending aggregate personal income and spending behavior evident prior to the pandemic and comparing it to what actually occurred. This results in an impressive $2.7 trillion in cumulative total excess household saving (Chart 1).
Time to save
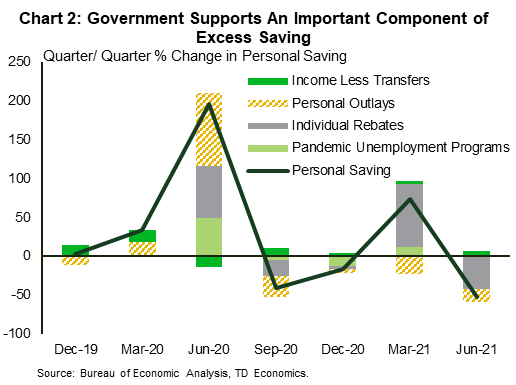 As evident in the above example, two major factors contributed to the unprecedented build-up in saving: higher income and lower spending. We can show the contributions of these factors to the growth of saving by comparing their evolution relative to pre-crisis and incorporating the change in income due to government support programs. One of the biggest drivers – higher personal income – was a direct result of these unprecedented fiscal transfers, of which the largest contributor was individual rebates (Chart 2). For some families, extra emergency unemployment benefits pushed earnings higher than they would have been had members remained employed, helping them build additional cash reserves.
The second factor that helped lift saving was constrained household spending as a result of restrictions and business closures. During the typical recession, households postpone purchases. Those whose near-term income prospects are most impacted or uncertain tend to reduce discretionary spending more than others. This time, even families that didn’t see their income cut or threatened reduced consumption. Spending on services declined by 20% in April of 2020 and did not recover to its pre-pandemic level until June 2021. Some of the unspent resources rotated to consumption of goods, but the remainder helped households put aside more saving than they would have otherwise. All told, excess saving due to foregone consumption makes up roughly 50% of the accumulated total.
Time to spend
With the economy gradually reopening, households are regaining their ability to spend freely. As a result, some of these funds will be used. The question is “how much?”
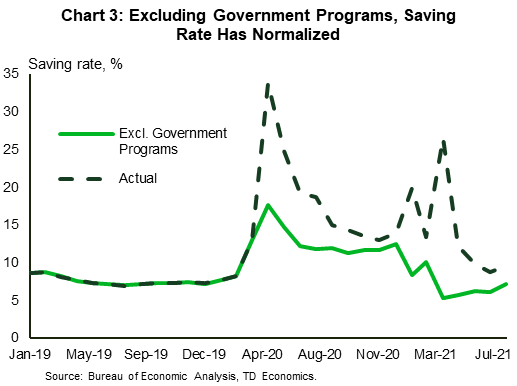
At one extreme, no excess saving will be spent. Theoretically, households are more likely to save government transfers financed by debt since they know these will have to be made up by higher taxes later on. This concept, known as Ricardian equivalence, however, does not appear to hold very well in practice. When we remove all the fiscal transfers from personal income, the level of saving sits below its pre-pandemic level (Chart 3). This suggests that consumers have already tapped into a portion of saving that was accumulated as a result of these transfers (i.e. they didn’t save all of the transfers for future tax payments).
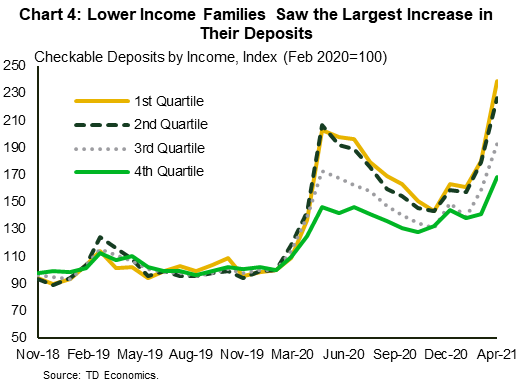
The distribution of saving by income levels may also play an important role in how much is spent, as low- and middle-income households tend to have a higher marginal propensity to consume (MPC) than the most affluent families. This matters because transfers were targeted at lower income levels and these households tended to see bigger increases relative to their pre-pandemic incomes (Chart 4).1 This is also backed by survey data. According to the New York Fed’s Survey of Consumer Expectations, households plan to spend between 25% and 30% of their individual rebates, with lower income families leaning towards the higher limit of that range.2 Judging by the amount of spending to-date relative to the size of the boost provided by income support measures, at least a portion of the savings from fiscal transfers will continue to be spent. The same survey found that households plan to use between 33% and 37% of individual rebates for debt repayment, which constitutes a form of saving. Lower debt levels, especially revolving credit, (which has fallen considerably over the course of the pandemic) gives households additional flexibility, but is likely not to be utilized extensively before excess savings are reduced (see report).
The additional savings built up as a result of foregone spending due to the pandemic are another matter. Excess saving from constrained consumption is more likely to be treated as wealth and therefore less likely to be spent in short order. Standard estimates of the marginal propensity to consume (MPC) out of wealth are much smaller than out of income (around 5%).3
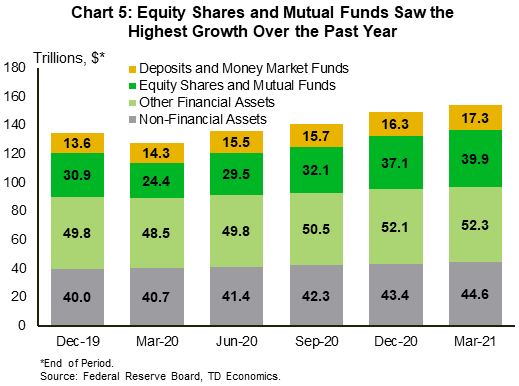
Over the past year, aggregate household financial assets jumped by 15%, from $134 to almost $154 trillion. More than a third of that is made up of equity shares and mutual funds, which accounted for approximately half of the overall asset growth over that period (Chart 5). Given that at least half of the cumulative excess saving was due to foregone consumption and some of it allocated toward financial assets, this is an argument for a slow roll off of excess savings and caution in how much is spent over the next two years.
Considering some alternatives
Our forecast assumes that between 5% and 10% of the $2.7 trillion in excess saving accumulated to-date will be spent by the end of 2023. This is informed by evidence of a low MPC out of excess savings due to foregone consumption, which makes up at least half of the estimated total. Still, there are upside risks to this expectation. It could well be that households, pent up for almost two years, are itching to get back to normal and will even splurge on more expensive outings once they feel safe to do so.
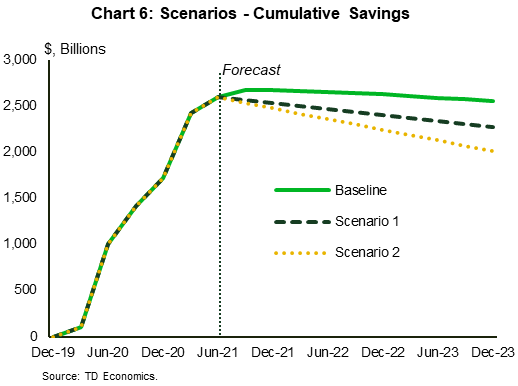
To help us understand the impact of potentially higher spending we run two simple scenarios. One where households spend 15% (Scenario 1) and one where they spend 25% (Scenario 2) of excess saving (Chart 6). These scenarios lie within the range of empirical estimates of marginal propensities to consume (MPC) in the economic literature.4 As this spending may prompt greater investment and spending elsewhere in the economy, it could multiply up to even greater economic activity.
The results of these scenarios are outlined in Table 1. Relative to our baseline forecast, should households draw down 15% excess saving, consumer spending growth will be around 0.4 percentage points faster (annualized) over the next year and a half. It follows that with 25% drawdown, the increase will be double at 0.8 percentage points. Applying the fiscal multiplier for rebates and unemployment insurance of 1.2 times, this would lift to real output by roughly the same amount over this period (0.4 and 0.7 percentage points for scenario 1 and 2, respectively). With respect to prices, our model suggests that higher output would result in an increase in inflation that would be around 0.1 percentage points higher over the estimated period, on average.
Table 1: Impact of Excess Saving Drawdown on Consumption and Output
(Year/Year Percent Change)
| Scenarios | Real Consumption | Real GDP | ||||||
| 2020 | 2021F | 2022F | 2023F | 2020 | 2021F | 2022F | 2023F | |
| Baseline | -3.8 | 7.7 | 2.9 | 2.3 | -3.4 | 5.7 | 4.2 | 2.6 |
| 15% of ES spent | -3.8 | 8.1 | 3.3 | 2.2 | -3.4 | 6.0 | 4.5 | 2.5 |
| 25% of ES spent | -3.8 | 8.5 | 3.6 | 2.2 | -3.4 | 6.3 | 4.7 | 2.5 |
Since the incremental consumption will not be fueled by personal disposable income, the future saving rate (the share of income that’s not spent) will decline. Our baseline assumes that some of the future spending will be supported by accumulated saving rather than current income, the saving rate will gradually decline from almost 10% the pre-pandemic level. These alternative scenarios result in a saving rate that are roughly half and full percentage points below the pre-pandemic average.
These estimates come with some caveats. For simplicity, we assume that excess saving is consumed at a constant rate between now and the end of 2023. In practice, consumption will be lumpier and will, of course, depend on the evolution of the virus. Given the recovery to date, the economy is already operating close to potential. As such, economic capacity may prove a limiting factor to growth of this magnitude and will reduce the size of the spending multiplier. Pushing the economy further into excess demand territory may show up in higher-than-estimated inflation rather than increased real output. In today’s environment, these constraints are exacerbated due to lingering effects of the pandemic that are impeding labor market normalization and prolonging supply-chain disruptions.
Conclusion
An unprecedented level of stimulus payments and containment-induced reduction in spending during the pandemic resulted in an accumulation of roughly $2.7 trillion in excess saving. The extent of excess saving draw-down boils down to the question who’s holding these reserves. Excess saving concentrated in the hands of high-income households are more likely end up converted into financial and real assets. Low- and medium- income households, who have higher marginal propensity to consume, saw a greater increase in their deposits than their affluent neighbors. This means that there is a good chance that at least some of the excess saving will be spent on goods and services, lifting growth and inflation prospects. All told, that we assume that between 5% and 10% of these reserves will be channeled to consumption over the next two and a half years.
Motivated by a question of what more consumption of excess saving would do, we ran two alternative scenarios where households draw-down 15% and 25% of saving accumulated during the pandemic. These scenarios result in an additional 0.4 to 0.7 percentage points in real output growth – quite an impressive lift. However, actual output may not be augmented by this amount as it pushes against supply constraints. Instead, it could put upward pressure on prices, requiring an earlier withdrawal of monetary policy from the Federal Reserve.
If materialized, these scenarios present an upside risk to our outlook. Still, the balance of economic arguments is tilted towards a moderate reduction in excess saving due to a lower aggregate propensity to consume as well as lingering uncertainty that continues to limit consumption choices.
End Notes
- This matches our internal data on checking account balances, which shows lower income families saw the biggest year-on-year percent increase in balances.
- https://libertystreeteconomics.newyorkfed.org/2021/04/an-update-on-how-households-are-using-stimulus-checks/
- https://www.bankofengland.co.uk/-/media/boe/files/monetary-policy-report/2021/february/monetary-policy-report-february-2021.pdf
- https://www.piie.com/blogs/realtime-economic-issues-watch/defense-concerns-over-19-trillion-relief-plan .
Disclaimer
This report is provided by TD Economics. It is for informational and educational purposes only as of the date of writing, and may not be appropriate for other purposes. The views and opinions expressed may change at any time based on market or other conditions and may not come to pass. This material is not intended to be relied upon as investment advice or recommendations, does not constitute a solicitation to buy or sell securities and should not be considered specific legal, investment or tax advice. The report does not provide material information about the business and affairs of TD Bank Group and the members of TD Economics are not spokespersons for TD Bank Group with respect to its business and affairs. The information contained in this report has been drawn from sources believed to be reliable, but is not guaranteed to be accurate or complete. This report contains economic analysis and views, including about future economic and financial markets performance. These are based on certain assumptions and other factors, and are subject to inherent risks and uncertainties. The actual outcome may be materially different. The Toronto-Dominion Bank and its affiliates and related entities that comprise the TD Bank Group are not liable for any errors or omissions in the information, analysis or views contained in this report, or for any loss or damage suffered.
Download
Share: