Reliable Energy Supply is Crucial for the
Sustainability of the Clean Energy Transition
Francis Fong, Managing Director & Senior Economist
Likeleli Seitlheko, Economist
Mekdes Gebreselassie, Research Analyst
Date Published: April 13, 2022
Highlights
- The shift from fossil fuels to clean energy alternatives creates a challenge in maintaining the reliability of energy supply. Price shocks related to the transition could diminish public support for climate change mitigation policies.
- Current underinvestment in the clean energy sector leaves the global economy on track to reduce oil and gas production faster than it is replacing it with alternatives. If the status-quo continues, there is increased risk of price volatility and elevated energy costs due to the mismatch between the supply and demand of fossil fuels. A significant acceleration in clean energy investment can lower the need for additional upstream fossil fuel investment.
- Last year's extreme weather events were another reminder of the urgent need to make the energy system more resilient to climate impacts. Part of the investment in the energy system should be geared towards strengthening infrastructure against physical damage and building sufficient electricity generation capacity to cover demand spikes from extreme temperatures.
The latest United Nations Climate Change Conference in Glasgow (COP26) reaffirmed the commitment made in 2015 at the COP21 Paris summit to limit average global warming to well below 2°C, and ideally to no more than 1.5°C, above pre-industrial levels. Reaching this target will require large-scale reductions in greenhouse gas emissions, of which decarbonizing the energy system is a critical component. The system currently accounts for about three-quarters of greenhouse gas emissions from human activity.1
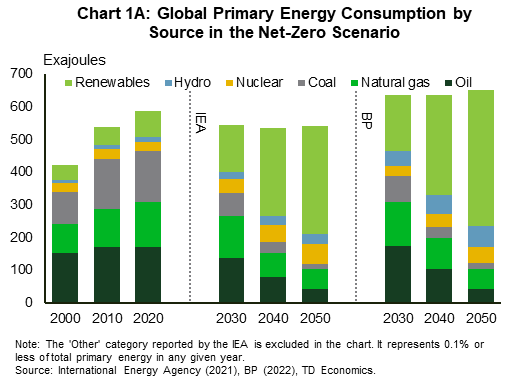
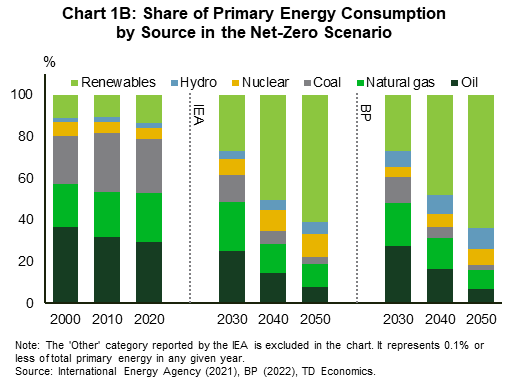
In previous reports, we presented the main pathways for abating emissions and an argument for why carbon capture technologies should not be dismissed as part of the solution towards net zero emissions. In this report, we address the scale and complexity related to the production and deployment of clean energy technologies, including the necessary infrastructure and R&D investment that are not yet fully addressed within current government policies and incentive structures. While the aspirations of how the composition of the energy system should evolve are largely set, lesser discussed is how the reliability of our energy supply will be impacted as fossil fuels are replaced by clean energy alternatives. The transition is likely to be a challenging endeavor given the world's strong dependence on fossil fuels and the short time frame within which we must transform energy consumption (chart 1). Though there is optimism in the possibilities opened by, for example, the declining costs of solar panels, wind turbines and electric cars, the global economy is still heavily underinvesting in clean energy technologies and infrastructure. In addition, there are technical challenges and potential growing pains to replacing the majority of the world's energy infrastructure.
These challenges make it difficult to determine how fast the world should be reducing investment in fossil fuels. A faster ramp down in fossil fuel supply that is not combined with an offsetting increase in renewables and the decarbonization of the demand side would lead to supply shortfalls and price spikes, with economic repercussions that include higher inflation and slower economic growth. This, in turn, risks reducing political support for the set of policies and frameworks necessary to support the energy transition in the first place. There are already warning signs appearing on the global stage. The surge in the price of energy and other commodities following Russia's invasion of Ukraine has worsened inflation and risks hurting economic growth. In response, some governments have reversed policies by cutting gasoline taxes, providing income transfers, releasing supply from strategic reserves or taking other measures. This highlights risk aversion within the public and governments to bear the economic cost that comes with sudden supply shortages.
To minimize the likelihood of future energy shortages, climate policy planning needs to strike a balance between the long-term decarbonization vision and ensuring that we do not move faster on dismantling the existing energy supply than we do on building clean energy alternatives. As well, increasing weather variability introduces new concerns for a world that is to be progressively powered by energy sources that are weather dependent. Overall, policy makers must keep a holistic view on how the interaction of various decarbonization measures could affect the reliability of energy supply and where necessary, craft policies to ensure that the energy system has enough buffers in place. Below we provide an overview of the ongoing energy crunch focusing on Europe, followed by a discussion of the risks that could affect the reliability of energy supply over the coming years.
The 2021-22 energy crunch
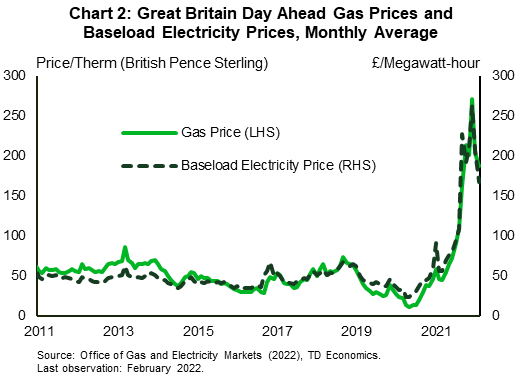
Prices of various energy products were surging last year due to supply shortages, well before the war in Ukraine further exposed Europe's vulnerabilities and supply chain dependencies. Given the role of Russia as one of the top exporters of oil and natural gas, the partial loss of its supplies due to official sanctions and self-sanctioning by traders has worsened the energy crunch that began in 2021. The impact has been especially pronounced in Europe because it depends heavily on imports of oil, natural gas and coal from Russia. Prior to the war, the energy crisis in Europe was largely confined to natural gas and electricity markets. The factors behind the pre-war gas supply shortages included low regional gas inventories and lower than normal gas imports from Russia. Additionally, a substantial decline in wind power generation due to calm wind conditions and emergency maintenance outages at several nuclear reactors in France contributed to robust gas demand at varying points in the past several months. As a result of the tight market conditions, the average quarterly gas price at the Dutch TTF hub rose by 405% between Q1 and Q4 of 2021, while the average monthly gas price in Britain has been triple its level in January 2021 since September 2021.2,3 Because gas plants tend to set wholesale electricity prices in many countries in Europe, the surge in natural gas prices has led to high electricity prices (chart 2). In both the EU and the UK, rising carbon emissions allowance prices also contributed to increasing electricity costs. More recently, the Russia-Ukraine conflict has added to these pre-existing tensions.
Europe's experience raises a number of important points with implications for the clean energy transition. First, the prolonged period of low wind power generation highlights the need for more dispatchable generation to offset intermittent resources. This role is currently filled by gas-fired and other conventional generators, but there is also a need to invest more in battery storage, dispatchable low carbon generators and carbon capture technologies. The second point has to do with the fact that intermittent and non-dispatchable resources like wind are unable to provide backup when unexpected generation losses occur, such as the recent nuclear maintenance outages in France. That limitation means conventional dispatchable generators will continue to be necessary until low carbon alternatives are ready. Third, although Europe is one of the leading regions in installing solar and wind capacity, the continent is still strongly dependent on natural gas. At the same time, declining domestic gas production has left Europe increasingly dependent on imports, especially from Russia, and with limited options for dealing with supply shortages.
The importance of reliable energy supply in the transition debate
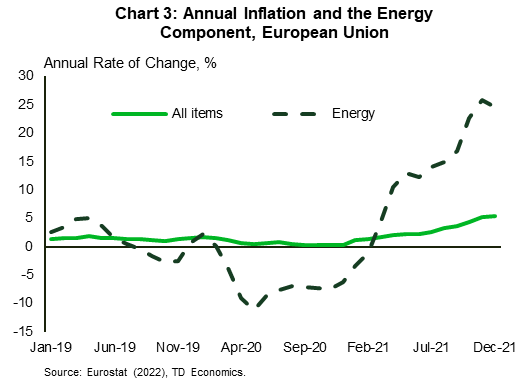
Price shocks due to volatile energy supply could potentially diminish public and political support for climate change mitigation measures. For example, faced with energy prices rising at more than 10% since April 2021 and over 20% since October 2021 on an annual basis, leaders in several EU countries have become more hesitant to support a proposal to expand the emissions trading system (ETS) to the road transport and heating sectors.4 The new ETS program is among the measures that were proposed by the European Commission in July 2021 to aid achieving the target to reduce EU emissions by at least 55% by 2030 relative to 1990. However, the surge in energy prices has heightened concerns over the program's impact on households. If adopted, the new ETS would take effect around 2025, but it would still be difficult for governments to make a program that, by design, is intended to make fossil fuels more expensive acceptable to the public at a time when energy prices are already high. As it is, current soaring energy bills led to protests in parts of Europe last year,5 indicating that countries have to maintain a delicate balance between setting appropriate price signals to encourage a move away from fossil fuels, while also ensuring that prices do not rise too much and make energy unaffordable. All this rests on keeping supply reliable to prevent price shocks.
Potential risks to the reliability of energy supply
There are several vulnerabilities in the energy system that could impair the reliability of energy supply over the coming years. These include current underinvestment in the energy system; physical impacts of weather and the changing climate; the intermittency of solar and wind and the challenges it poses for maintaining reliable electricity grids; and risks related to the geographic concentration of critical natural resources. The list is by no means exhaustive but merely covers a handful of examples.
Underinvestment in the energy system
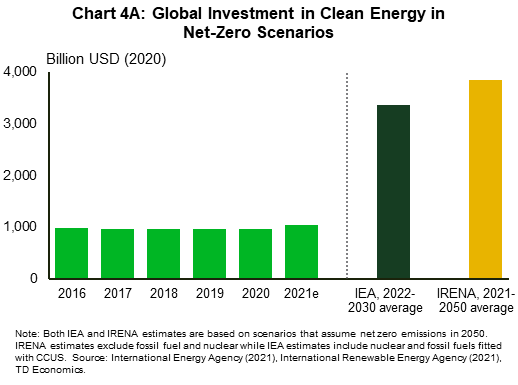
Global investment estimates from the last few years show a mismatch between investment in clean energy and upstream oil and gas, which indicates a disparity between the pace in which the world is adopting clean energy versus the pace of the ramp down in supply on the fossil fuel side. Specifically, investment in clean energy is a third lower than what is consistent with the net zero emissions by 2050 pathway (chart 4A).6,7 On the other hand, investment in oil and gas production in 2020 and 2021 was close to the level estimated to be consistent with the net zero path developed by the International Energy Agency (IEA) and BP (chart 4B).6,8 To put the numbers in context, under the IEA and BP net zero by 2050 scenarios, current investment levels in upstream oil and gas are aligned with a world in which oil demand in 2030 would be lower than its 2019 level by 8%-26% while natural gas demand would be about 4% below its pre-pandemic level (charts 5A and 5B).1,8 However, as we discuss below, that is not the demand trajectory the world is currently on, which increases the risk of a mismatch between the supply and demand of oil and gas if the clean energy sector is unable to scale up and if efforts to decarbonize end-use services are not adopted fast enough.

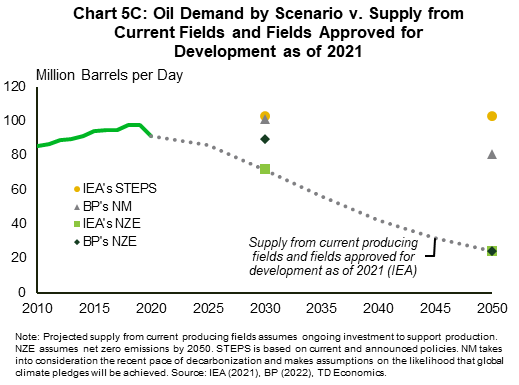
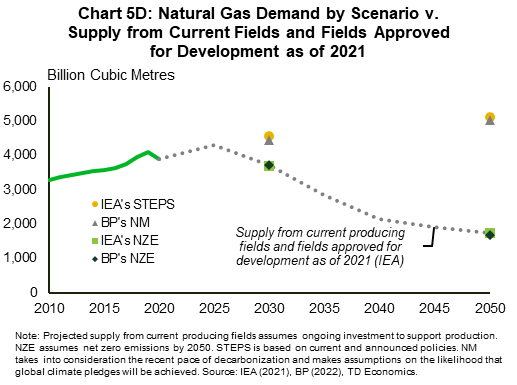
After declining in 2020, demand for natural gas had fully recovered by the end of 2021. Oil demand was also on track to reach its pre-pandemic level this year, prior to the recent rally in energy prices due to the war in Ukraine (charts 5A and 5B).9,10,11 Additionally, projections from the IEA's Stated Policies Scenario (STEPS) and BP's New Momentum scenario (NM) suggest that oil and gas demand could remain strong over the next several decades. STEPS is based on current and announced policies while NM takes into consideration the recent pace of decarbonization and makes assumptions on the likelihood that global climate pledges will be achieved. In these trajectories, gas demand in 2030 is higher than its pre-pandemic level by about 15% and oil demand is 5% higher than its 2019 level. The projected demand for 2030 would exceed supply from current producing fields and those already approved for development as of 2021 by around 40% for oil and about 20% for gas (charts 5C and 5D). Under these demand scenarios, average annual investment in upstream oil and gas over the coming years would have to increase to up to double its level in 2020 and 2021 and new fields would need to be approved for development to ensure that future supply would be compatible with demand. The climate implications of our current fossil fuel demand trajectory are dire as continuing on this path virtually guarantees that global emissions will not reach net zero by 2050.


Naturally, the actual path of oil and gas demand this decade will depend on the progress the world makes on boosting the supply of clean energy and replacing technologies that run on fossil fuels with clean energy substitutes. Investment needs to increase significantly across all sectors to reduce the need for further oil and gas investment. Renewable generation capacity has made great strides, led by solar and wind capacity, and its growth is expected to accelerate. That said, the projected annual capacity addition for 2021-26 is just over half of the level required for net zero by 2050. Simply put, investment needs to nearly double beyond what is already planned for this period.12 In the transportation sector, countries have to work towards increasing the share of electric vehicles (EVs) in the global passenger car stock from 1% in 2020 to 20% by 2030.1 Norway, where the share of EVs was already 17% in 2020, serves as a model for the measures that other countries could employ to meaningfully move the needle. Progress in other sectors has also been slow, for instance electrifying space heating in residential and commercial sectors and improving building insulation. Increased R&D spending is needed to develop solutions for sectors such as aviation that currently have limited decarbonization options.
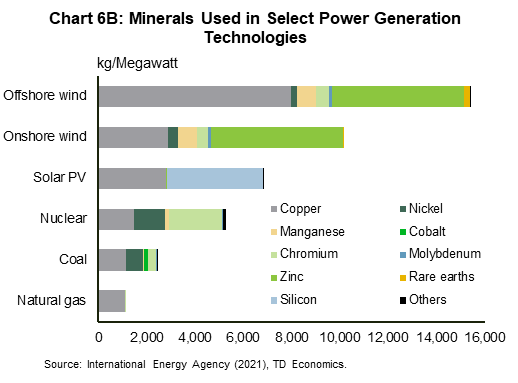
The final aspect of the clean energy underinvestment story relates to mineral supply. Clean energy technologies such as electric cars are more mineral intensive than conventional technologies (chart 6). For virtually all minerals, mining and processing capacity and output must increase significantly to match the expected demand. However, investment plans for many of the minerals are lower than the levels that are required to enable a faster transition.13

Geographic concentration of critical natural resources
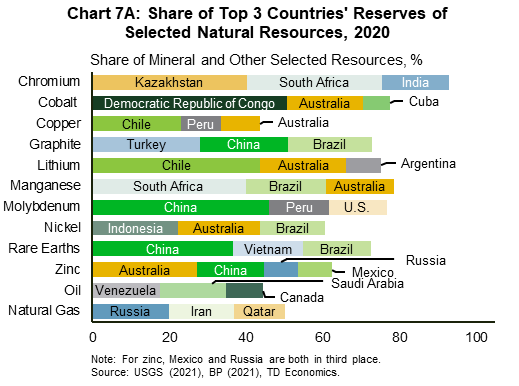
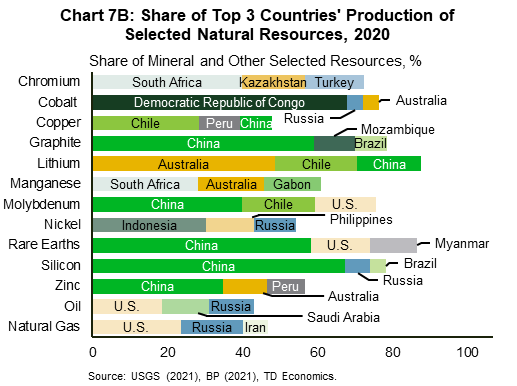
Although solar and wind resources are widely available, there is geographical concentration in many of the metals and minerals that are utilized in manufacturing components of solar photovoltaic modules and wind turbines, and of other products like battery storage systems. For example, over 70% of the reserves of minerals like lithium, cobalt and rare earths are in just three countries.14 Reserves refer to the portion of mineral resources that is estimated to be commercially viable based on current economic conditions. Similarly, the production of minerals is primarily dominated by a handful of countries (chart 7). There is also concentration on the processing side, as China accounts for over half of cobalt and lithium processing and more than four-fifths of rare earth mineral processing.13 The concentration of supply in a few countries poses the risk that disruptions in a major producer due to natural disasters or adverse political, regulatory and economic changes could not just slow the pace of the clean energy transition, but also undermine its success.
The Russia-Ukraine conflict could exacerbate the clean energy sector's supply chain issues that began last year. In addition to being a top three producer of oil and gas, Russia is also one of the leading producers of minerals such as nickel, silicon and cobalt and holds large reserves of rare earth minerals, zinc, nickel and copper.14 Beyond their impact on oil and gas supply, sanctions and the avoidance of Russian commodities by traders could also affect the country's exports of minerals, with implications for long-term supply.
Intermittency of solar and wind
Global solar and wind electricity generation has risen exponentially in recent years. From 2010 to 2020, their combined power output increased sixfold while their share of generation increased from 2% to about 9%.15 The two energy sources are slated to expand further over the coming decades as more capacity is installed to meet clean energy targets. Though good for emissions reduction, the two resources create challenges for grid reliability because they only produce electricity when the sun is shining or the wind is blowing and thus, cannot be counted on to be available when needed. Intermittency can happen on all timescales from seconds to hours and even across seasons. In Canada, for example, solar power generation is significantly higher in the spring and summer relative to the fall and winter despite solar panels being more efficient in cooler weather. 16
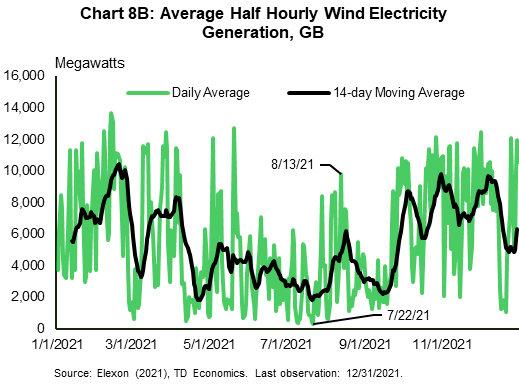
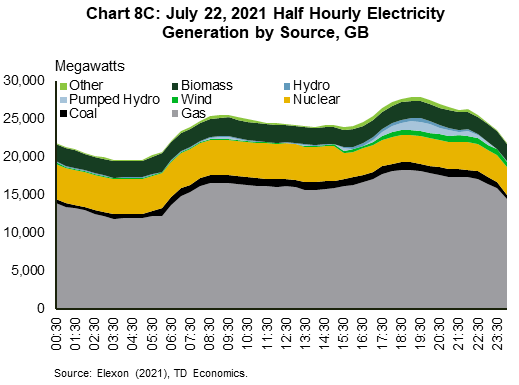
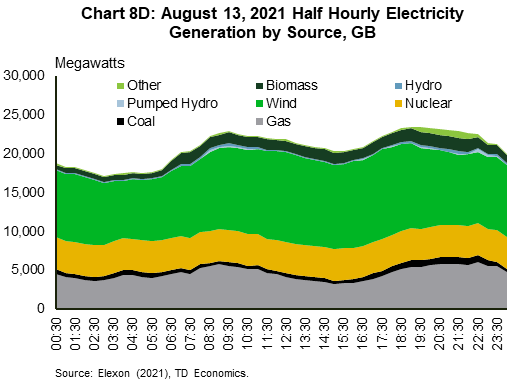
The variability issue came into focus in Europe last year when unusually low wind conditions – likely driven by a decrease in average wind speeds caused by climate change, referred to as global stilling – led to a reduction in wind power generation. In the UK, wind power generation dropped by 14%-30% in the first three quarters of 2021 compared to the same periods in 2020, while wind's share of power generation declined by more than 4 percentage points year-over-year.17 For context, installed wind capacity increased by 2%-4% year-on-year over the same period. On the worst windless days such as July 22nd (chart 8), wind's contribution to domestic power output was negligible with natural gas making up most of the shortfall. The Intergovernmental Panel on Climate Change has estimated that global warming could lead to lower wind speeds in Europe especially during the summer,18 implying that jurisdictions should be planning for potential future extended lulls in wind power generation. Wind intermittency is an issue in other regions too. For instance, New York state had 74 low-wind incidences in 2020 during which wind power output was less than 5% of installed capacity for at least 8 consecutive hours.19
As the share of solar and wind capacity rises relative to conventional capacity, electricity systems will require sufficient dispatchable resources to balance electricity demand and supply. Conventional generators currently provide most of the flexible capacity globally, but lithium-ion battery capacity is growing in some jurisdictions enabled by falling costs of the technology. While current battery assets can store enough energy to provide backup for just a few hours, as illustrated by the lithium-ion battery storage projects contracted by the US utility PG&E in 2020,20,21 technological advancements for solid state batteries offer promise for longer-duration storage. Providing backup for weeks-long or seasonal intermittency will require dispatchable low-carbon power generators such as nuclear and there may also be a role for fossil fuel-fired generators paired with carbon capture. With electricity demand expected to rise rapidly in the coming decades as more sectors are electrified, the reliability of supply from the grid will become even more important.

Physical climate impacts
The energy system is the main contributor of the greenhouse gas emissions that are driving climate change. At the same time, the system is vulnerable to the impacts of the changing climate. Extreme weather events have become more common and are expected to increase in frequency and intensity with rising global temperatures. This means the world needs to be preparing to deal with more years like 2021, which came with a broad range of extreme weather events that affected the energy system, from winter storms to floods, droughts, wildfires and heat waves. Both energy demand and supply are vulnerable to the impacts of extreme weather.

On the demand side, extreme temperatures can significantly increase energy demand for heating and cooling. For instance, during the heat wave that hit British Columbia in June 2021, electricity demand (both peak load and total load) during the hottest days was as much as 20% higher than demand from a typical day in June in the three-year period from 2017-19. If household air conditioner ownership in British Columbia (33% in 2019) were as common as in Ontario (82%) and Manitoba (85%),22 electricity demand at the peak of the heat wave would have jumped up more. Likewise, the extreme cold temperatures that the province experienced towards the end of December set new records for electricity consumption (chart 9). While British Columbia has sufficient generating capacity and can more easily absorb increases in demand due to extreme temperatures, demand spikes can put a strain on the electric grid in regions that have limited generating reserves. That said, even in regions like British Columbia which have excess generating capacity, heat waves can still disrupt supply by damaging grid infrastructure as seen in June. The high temperatures caused a number of transformers to fail, which led to localized power outages.
Extreme weather such as droughts and storms can lead to a shutdown or reduction in energy supply or in some situations damage infrastructure, potentially resulting in long disruptions in supply to the extent that it takes a while to repair the damage. Examples here include the ongoing historic drought in the Western U.S. which led to a 19% decline in hydropower output in California in 2021 compared to 2020.23 The power outages that were caused by a winter storm in Texas at the beginning of 2021 represent a worst-case scenario of the failure of energy supply. Millions of people were left without electricity and heat during one of the coldest periods in the state's history when the snow and freezing conditions knocked out much of the grid infrastructure including coal plants, natural gas plants, gas pipelines, solar panels and wind turbines. After previous cold winters impacted power output, the state was advised to winterize its energy infrastructure, but these recommendations were never implemented because the risk of extreme cold leading to widespread blackouts was considered low.24 However, the incident serves as a warning that countries should be doing more to make the energy system resilient to climate impacts, including climate risks that may have looked negligible in the past.
Going forward
The clean energy transition is expected to substantially transform the energy system over the next couple of decades at a speed and scale without historical precedence. This is not going to be an easy undertaking due to the complexity of the energy system and the transition itself. However, ensuring that energy supply remains stable as the system moves from old forms to new forms of energy should be a priority and will require addressing the challenges highlighted above.
This should include a substantial increase in investment in the energy system. On the clean energy front, there is a need for more policy support to incentivize households and firms to pivot away from fossil fuel technologies. In general, regions that have done better at promoting the adoption of clean energy technologies relied on a variety of policy measures such as purchase subsidies, tax incentives and supporting the development of the enabling infrastructure. Additionally, it is also important to diversify clean energy supply chains beyond the few countries that currently dominate the sector as a way of building resiliency into the supply system. Diversification is needed across the entire value chain from the extraction of raw materials to the manufacturing of final products. There is room for Canada to play a bigger role given its deposits of critical minerals like nickel and rare earths, mining and manufacturing expertise, and skilled labor force.
The threat posed by extreme weather events requires regions to be more proactive in making the energy system more resilient to the effects of extreme weather and better able to recover quickly when disruptions do happen. Adopted measures could include demand-side solutions such as insulating buildings or supply-side options such as refurbishing infrastructure to strengthen it against physical damage. Regions have to also make sure that there is sufficient generating capacity to cover spikes in demand due to extreme temperatures, including taking into account the possible unavailability of intermittent variable generation in areas that have high shares of them or the possibility of reduced hydropower capacity in areas prone to droughts.
Finally, the transition will require flexibility to adapt plans if conditions change either positively or negatively or as more information on the impact of adopted decarbonization measures on the reliability of energy supply becomes available. To end on a more positive note, technologies that are required for the clean energy transition are evolving and increased investment in R&D could lead to breakthroughs that improve the performance of existing technologies or introduce new technologies that could enable a faster transition beyond what seems possible now based on current technologies.
End Notes
- International Energy Agency, Net Zero by 2050: A Roadmap for the Global Energy Sector, May 2021
- The European Commission, Quarterly reports on European gas and electricity markets, Q1-Q4 2021
- Ofgem, Wholesale market indicators
- Ainger, John, European Energy Crisis Fuels Carbon Trading Expansion Concerns, Bloomberg, October 6, 2021
- Alderman, Liz, Europe fears that rising cost of climate action is stirring anger, The New York Times, November 1, 2021
- International Energy Agency, World Energy Outlook 2021, October 2021
- International Renewable Energy Agency, World Energy Transitions Outlook: 1.5°C Pathway, June 2021
- BP, Energy Outlook 2022 Edition, March 2022
- World Bank Group, Commodity Markets Outlook: October 2021
- International Energy Agency, Gas Market Report, Q1-2022: Including Gas Market Highlights 2021, January 2022
- International Energy Agency, Oil Market Report – January 2022
- International Energy Agency, Renewables 2021: Analysis and forecasts to 2026, December 2021
- International Energy Agency, The Role of Critical Minerals in Clean Energy Transitions, May 2021
- US Geological Survey, Mineral Commodity Summaries 2021, February 2021
- BP, Statistical Review of World Energy – all data, 1965-2020, July 2021
- Canada Energy Regulator, Market Snapshot: Solar power generation in Canada is highly seasonal, February 20, 2019
- UK's Department for Business, Energy & Industrial Strategy, Renewable electricity capacity and generation (ET 6.1 - quarterly), March 2022
- The Intergovernmental Panel on Climate Change, IPCC WGI Interactive Atlas: Regional Information (Simple)
- New York ISO, Power Trends 2021: New York's Clean Energy Grid of the Future, May 2021
- Blunt, Katherine, California Scrambles to Find Electricity to Offset Plant Closures, The Wall Street Journal, October 16, 2021
- PG&E, PG&E Poised to Expand Battery Energy Storage Capacity by More Than 420 Megawatts, May 19, 2020
- Statistics Canada, Table 38-10-0019-01: Air conditioners, October 19, 2021
- The US Energy Information Administration, California’s hydroelectric generation affected by historic drought, July 7, 2021
- Ball, Jeffrey, The Texas Blackout Is the Story of a Disaster Foretold, Texas Monthly, February 19, 2021
Disclaimer
This report is provided by TD Economics. It is for informational and educational purposes only as of the date of writing, and may not be appropriate for other purposes. The views and opinions expressed may change at any time based on market or other conditions and may not come to pass. This material is not intended to be relied upon as investment advice or recommendations, does not constitute a solicitation to buy or sell securities and should not be considered specific legal, investment or tax advice. The report does not provide material information about the business and affairs of TD Bank Group and the members of TD Economics are not spokespersons for TD Bank Group with respect to its business and affairs. The information contained in this report has been drawn from sources believed to be reliable, but is not guaranteed to be accurate or complete. This report contains economic analysis and views, including about future economic and financial markets performance. These are based on certain assumptions and other factors, and are subject to inherent risks and uncertainties. The actual outcome may be materially different. The Toronto-Dominion Bank and its affiliates and related entities that comprise the TD Bank Group are not liable for any errors or omissions in the information, analysis or views contained in this report, or for any loss or damage suffered.
Download
Share: