Highlights
- With extreme weather events occurring with both increased frequency and greater severity, public consensus is growing on the need to act. However, decarbonizing the world's energy system is a complex process that will require an unprecedented collective global effort to transition how energy is produced, transported and consumed.
- Decarbonization can be thought of from a macro perspective as having four main constituent parts: energy efficiency, electrification, fuel switching, and carbon capture. In turn, four enabling factors support decarbonization, including the development and scaling of new technologies, building the necessary infrastructure, changing consumer and firm behaviours and the implementation of public policies and incentives.
- Each part of this decarbonization framework represents a critical aspect of the clean energy transition that will need to be utilized to varying degrees. However, there is not a one-size-fits-all formula to reaching net zero by 2050 as it depends on a country's economic DNA and energy system dependencies. Each country should be encouraged to leverage all available tools to achieve their emissions reduction targets, while mitigating the negative transitional impacts on people's livelihoods.
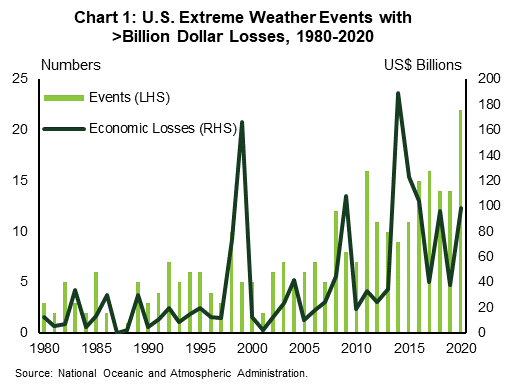
Climate change forces are making their presence known on the geographical and social landscape. Extreme weather events, including flooding, severe precipitation, wildfires, and droughts are occurring with increased frequency and with greater severity. According to the U.S. National Oceanic and Atmospheric Administration, the number of extreme weather events that have led to more than a billion dollars in economic losses in the U.S. has trended consistently upward since 1980, reaching a record high of 22 events in 2020, with the economic losses rising in tandem (chart 1). In lockstep, public consensus is growing in the need to act. So, on Earth Day in April of this year, a number of the world's largest emitters, including the U.S., Canada, the UK, and Japan, pledged ambitious emission reduction targets ranging from 30 to 64% below current levels within the next 15 years.
The commitments are a critical first step, but the path to get there is complex. China and Europe both offered recent reminders of this, as the regions face energy transition disruptions at a level that threatens production and household security.1 The unprecedented collective global effort will need to fundamentally change how energy is produced, traded and consumed. In turn, this requires proactive policy measures to ensure the appropriate scale in new energy infrastructure is in place to facilitate the transition. To borrow from Field of Dreams, if you build it, they will come. Failure on this front creates a negative economic incentive. Countries may be pressured to default back to the more stable, high-emitting infrastructure. Likewise, a sudden escalation in the cost of energy and any resulting insecurity risks disenfranchising longer term public support.
The transition to clean energy captures four main constituent parts – energy efficiency, electrification (and using electricity from non-emitting sources), fuel switching and carbon capture. Each country will need to employ these to varying degrees, depending on its economic-DNA. For instance, we've written previously on the importance that Canada's energy transition occurs in parallel with the worker transition, in order to mitigate widespread worker displacement. A country like Canada has an outsized economic and labour market dependence relative to a country like Switzerland or the United Kingdom. There is not a one-size-fits all formula to decarbonization – some countries could feasibly reach net zero through electrification and fuel switching with little economic disruption, while others like Canada will likely leverage technologies like carbon capture to a greater degree given the predominance of the upstream energy sector. Each country should be encouraged to leverage all available tools to achieve their emissions reduction targets, while mitigating the negative transitional impacts on people's livelihoods. This report provides an overview into this macro picture.
Understanding the problem
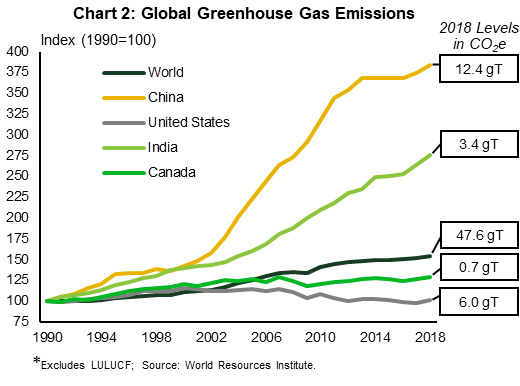
The first step in understanding this clean energy transition is in understanding greenhouse gas (GHG) emissions and where they come from. The primary driver of climate change is human-made emissions of GHGs. This has grown exponentially over the last several decades, reaching a record high 47.6 gigatonnes (gT) of CO2-equivalent in 2018 (chart 2). Of that, the U.S. and Canada contributed 6 gT and roughly 0.7 gT, respectively.
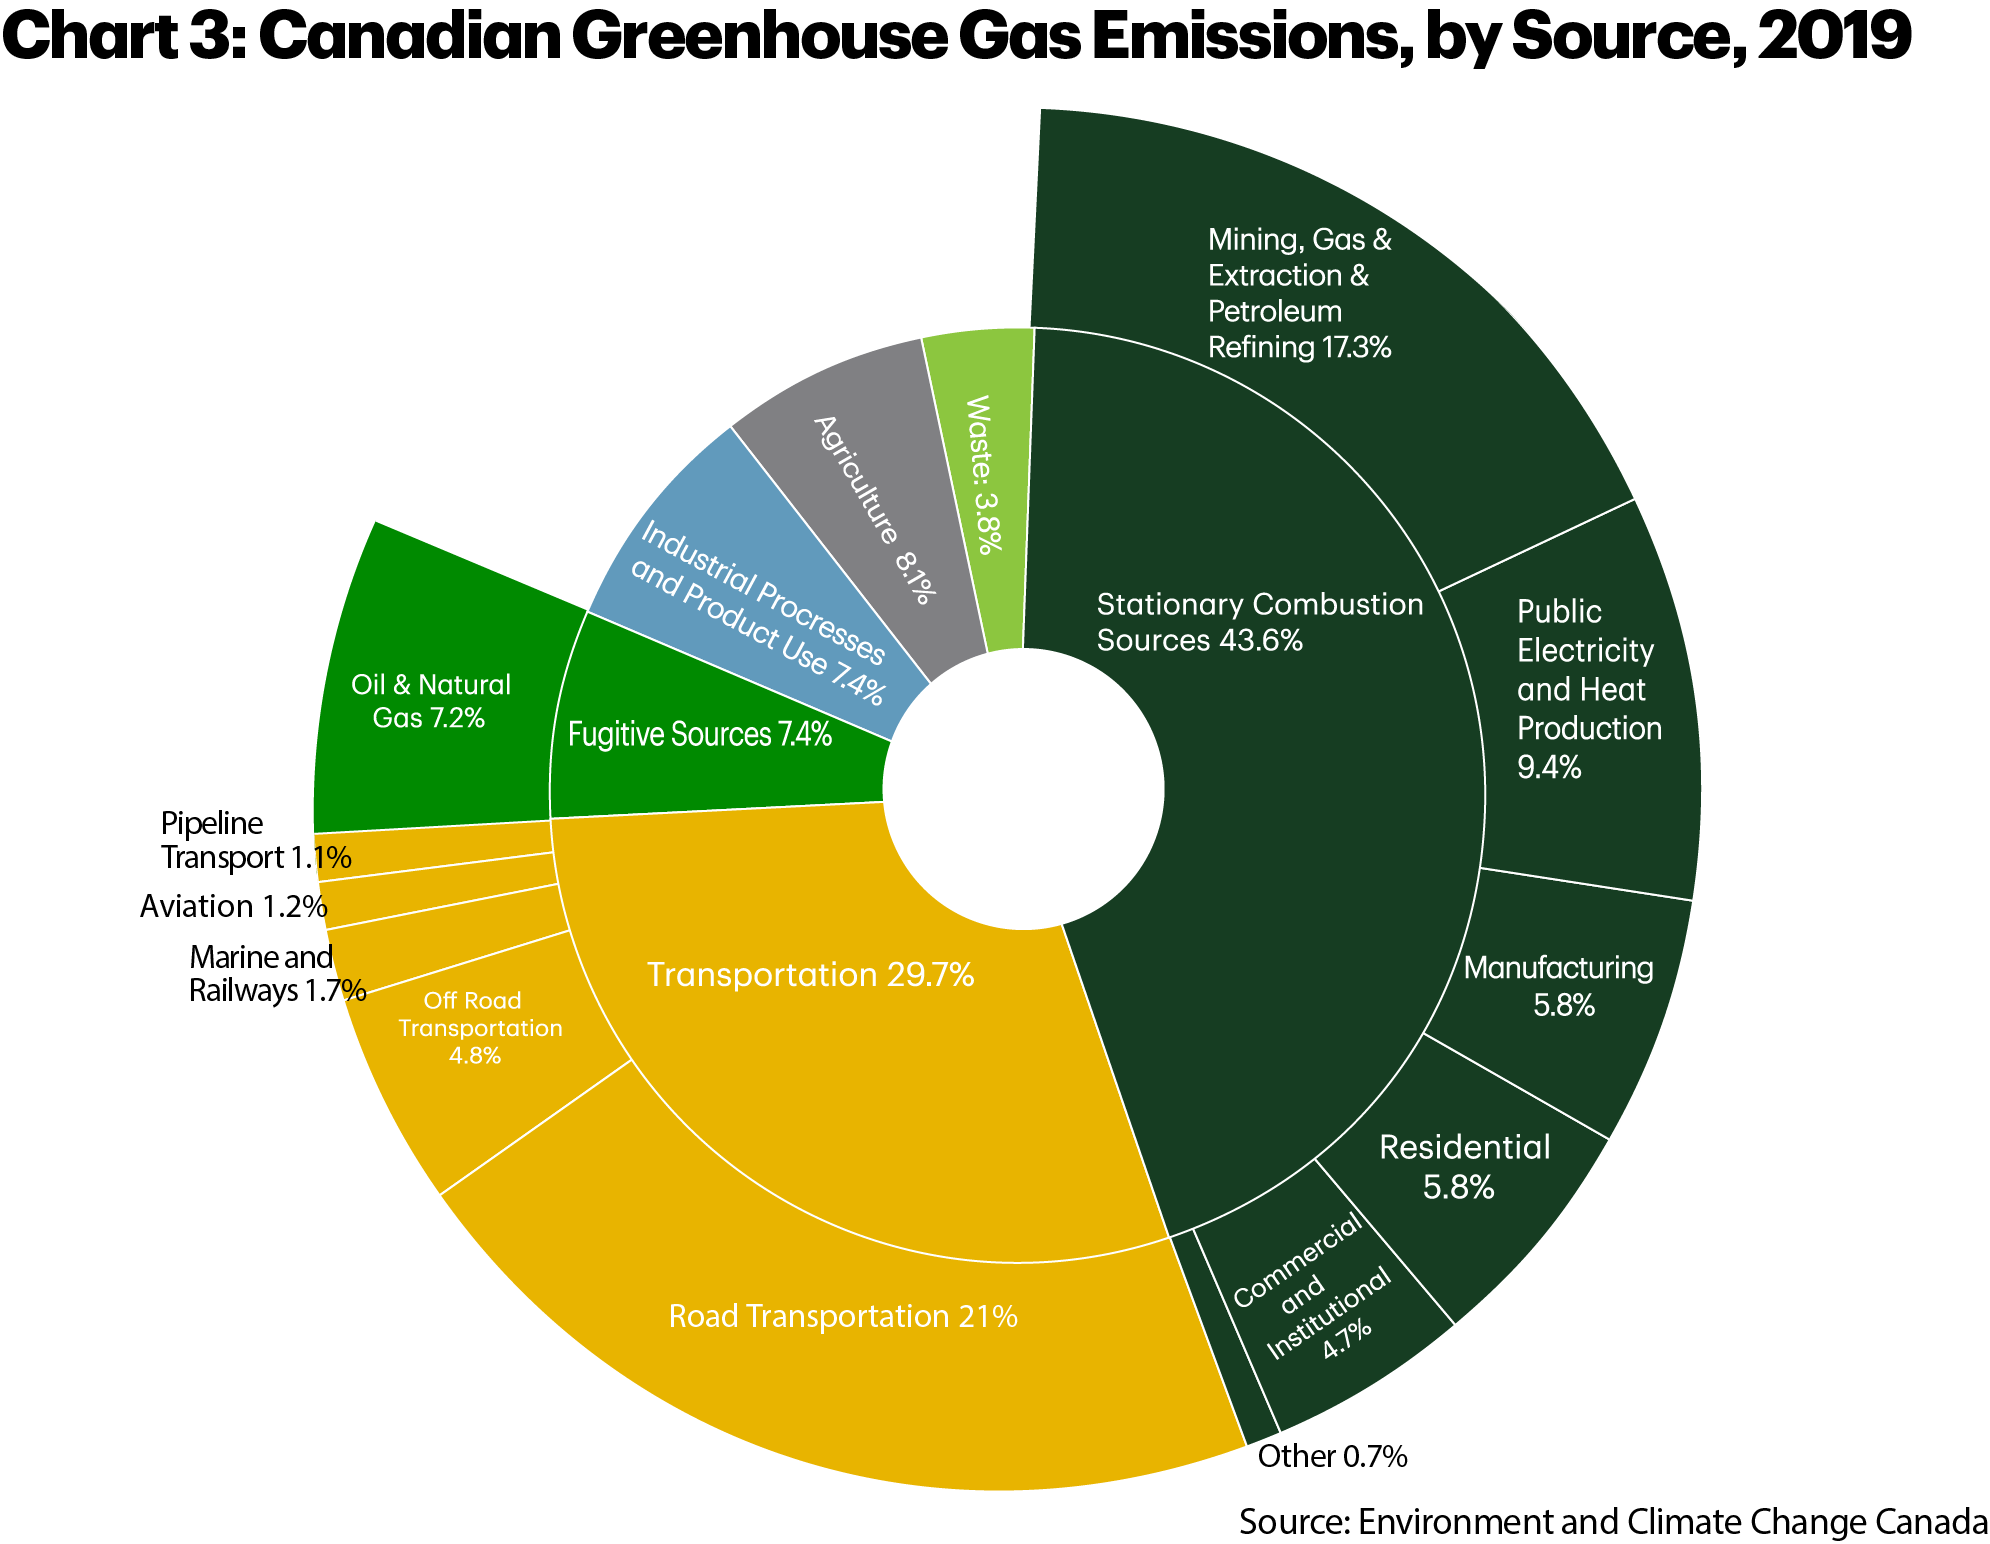
From a broad perspective, GHG emissions only come from a handful of primary sources (inner circle, chart 3). The lion's share is from the combustion of fossil fuels, either as a stationary source of energy, such as fossil-based electricity generation, or within the transportation sector. The other key source includes what's referred to as "fugitive emissions", which can come from the extraction and transportation of oil & gas, as well as from legacy or depleted wells. And lastly, the agriculture sector and industrial processes represent the remainder, such as GHGs emitted from cement production or due to organic waste decomposition.
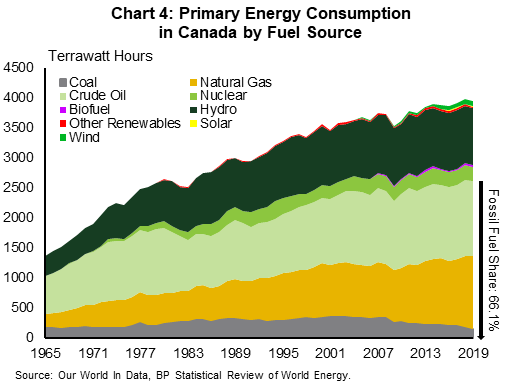
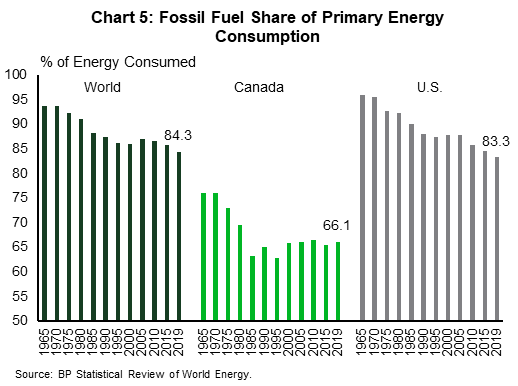
Net zero GHG emissions by 2050 was established by the scientific community as giving us the best chance of avoiding the worst outcomes of climate change. And this is why, to date, 16 countries have either proposed legislation or enshrined a net zero target into law, while an additional 42 countries have cited a net zero target in policy documents. In total, over 130 countries have communicated a net zero target in some form.2 However, turning the dial on these emissions is incredibly complex. This is primarily because households and businesses continue to depend on burning fossil fuels to feed their energy demand. In Canada, just shy of two-thirds of primary energy consumption is fueled by burning natural gas, crude oil, or coal (chart 4), while globally and in the U.S., those figures are 84.3% and 83.3%, respectively (chart 5).
Primary energy consumption refers to how we power daily activities. This captures a wide spectrum of activities, including how homes and offices are heated, to how people get around every day, to how industrial activity and everything people consume is produced. Each slice of the pie in chart 3 can thus be further broken down into those thousands of individual activities and processes that emit greenhouse gases. It is this complexity that underscores the difficulty of reaching net zero. It requires people and businesses to decarbonize each action, equating to a rethinking of how we produce and consume energy.
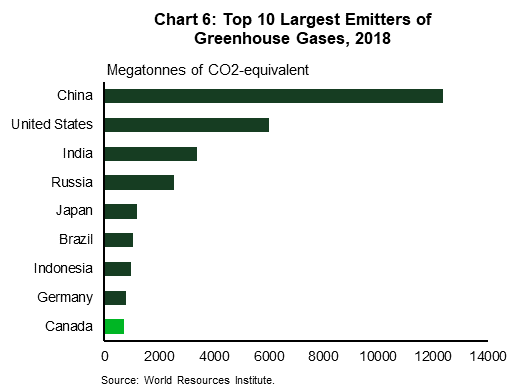
It's often cited that the largest emitters should be responsible for addressing climate change. Canada represents only a small proportion of global emissions, at just 1.5% as of 2018. And, recent emissions growth has been largely driven by those within the emerging markets. China, India, Brazil, Indonesia and Iran combined have contributed more than 75% of the net increase in global emissions since 1990. However, a static view of the current level of emissions ignores that climate change is driven by the accumulation of emissions that have added to the global atmospheric concentration of GHGs. So while it is certainly true that advanced economies acting on climate change without similar action from high-emitting emerging markets would be ineffective in addressing climate change, the opposite is true as well, particularly from countries that have historically contributed a significant share of emissions.
And Canada is not even a small emitter. At 1.5%, Canada is still the 10th largest emitter on the planet (chart 6). If every country smaller than Canada adopted an attitude that only the largest emitters should be held responsible for addressing climate change, then 40% of global emissions would go unabated. In addition, emerging markets are, in part, producing GHGs due to the production and trade demand stemming from other countries, particularly advanced economies. So no matter how you slice this problem, all countries need to re-orient energy production and consumption habits.
A framework for understanding the decarbonization process
Rather than going down a laundry list of individual activities, decarbonization can be placed within a macro perspective. By returning to the principle that there are only a few primary sources of GHGs, we can tackle them in the order of importance. The biggest source of emissions comes from our energy system – namely, the infrastructure, technology & equipment, supply chains and behaviours that are all designed around extracting, producing and consuming electricity and fuel. In chart 3, this system encapsulates stationary combustion sources, most of the transportation sector, and most fugitive emissions – in fact, decarbonizing the energy system dominates most conversations about the clean energy transition.
This might seem complex given that it encapsulates most activities, but there's a basic decarbonization framework that has just four steps and applies to most sectors:
- Energy efficiency & process improvements
- Electrification
- Fuel switching/Clean Fuels
- Carbon capture
These four elements represent the technological pathway to abating emissions in each sector. However, in order to convert a framework into practical implementation, it requires four "enabling factors". These are:
- Developing and scaling clean technology
- Building the necessary infrastructure
- Changing consumer and firm behaviours
- Implementing public policies and incentives
This framework and the following sections the following sections that describe each step represent a holistic view of all of the available levers that countries have available to them. It is important for countries to pull all of these levers to achieve net-zero emissions because the complexity of the problem is such that focusing on too narrow a solution may result in not achieving our climate goals at all. In turn, different economic structures and dependencies between countries will require that each lever be pulled to varying degrees.
Energy Efficiency & Process Improvements
Energy efficiency has become one of the lesser speaking points within the decarbonization debate, but it may be the most important step in the near term. It refers to the implementation of new technology, process innovations, and retrofits that either reduce the amount of energy that is needed for a given activity or more efficiently uses the energy that is already produced. Two common applications are rising fuel economy standards for vehicles and better insulation standards in home heating.
Energy efficiency creates a practical and immediate reduction in emissions in the period where new technologies and innovations are being explored and/or attempting to reach economic scale. The U.S. and Canada committed to an interim goal of reducing emissions by up to 45% by 2030, time is short and the path to get there is important. Each year, the world breaks new records on annual emissions and most net zero solutions are complex and long-term, requiring significant investments in new technology and infrastructure to be viable. In the meantime, there is a lot of potential for emissions reductions, or at least avoided emissions, simply through better energy efficiency.
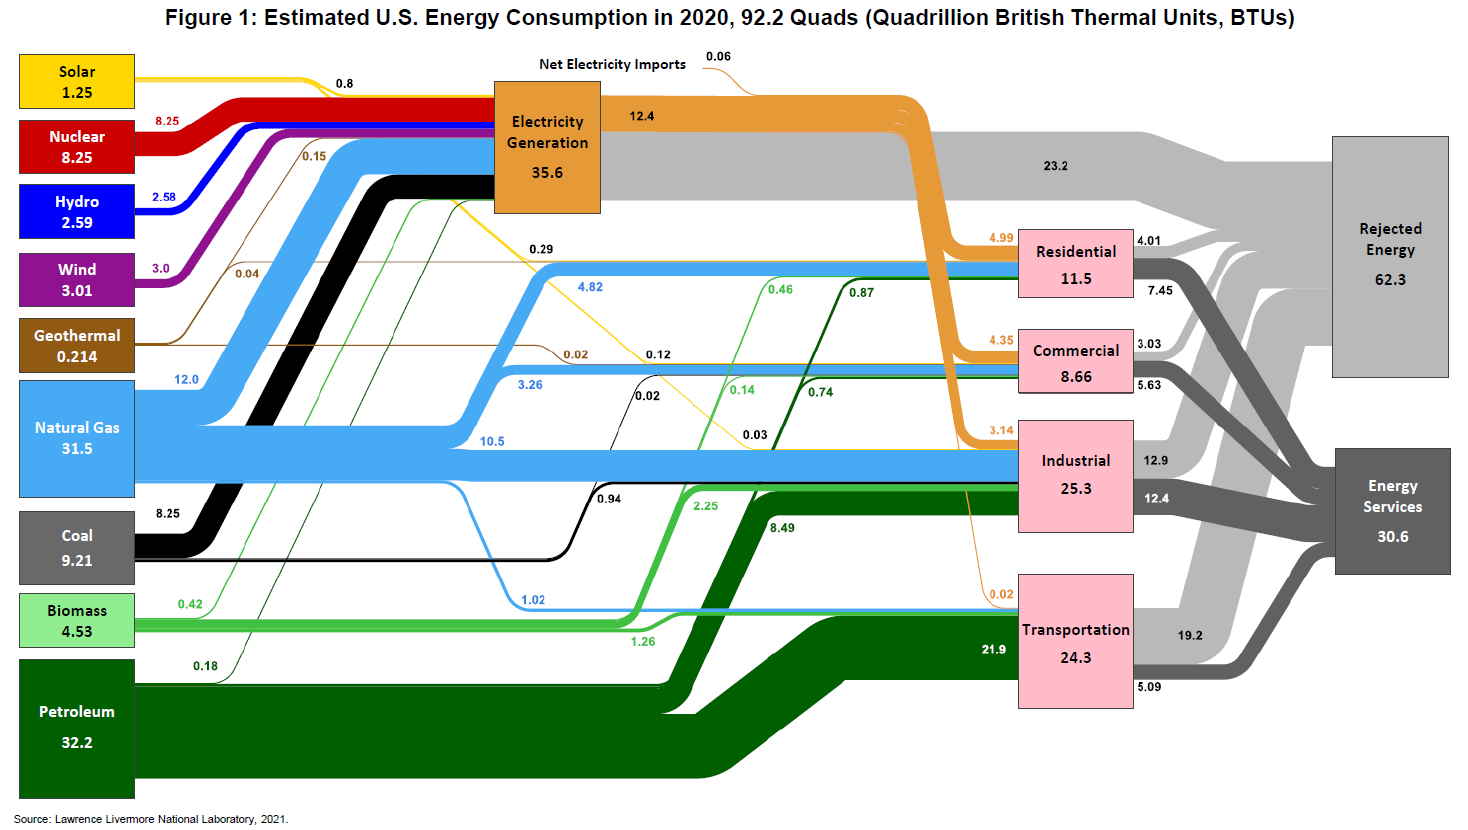
According to the Lawrence Livermore National Laboratory, an estimated two-thirds of all energy produced in the U.S. every year is wasted or rejected energy (see figure 1). This typically comes in the form of heat waste and represents the inefficiencies in our technology and equipment to fully capture and utilize the energy we produce. Some rejected energy is inevitable, but the scope for higher energy efficiency to reduce emissions is significant. The International Energy Agency (IEA) estimates that in a status quo scenario where all energy efficiency measures available today were implemented, we might see the world's population rise by 20% and global GDP double by 2040, yet GHG emissions would still have fallen by 12% due to declining energy intensity.3
Even beyond the short-term, energy efficiency still has a role to play. For example, in the IEA's scenario to achieve net zero by 2050, energy efficiency would be responsible for 5.3 gigatonnes of emissions reductions through 2050.4
Electrification
On a longer-term basis, however, deeper decarbonization necessitates a rethink of our energy system. The primary way this can be achieved is through the widespread substitution of fuel-based end-use activities towards electrification. This has two stages. The first is a wholesale shift in electricity generation to non-emitting sources. These include renewable sources, such as wind, solar photovoltaic (PV), geothermal, and hydro, and non-renewable, non-emitting sources, such as nuclear. Bioenergy and fossil fuels can play a significant role in the energy mix in net zero economies, but their ongoing relevance will be dependent on the ability to abate emissions through carbon capture.
The second stage is to implement technology that will allow the substitution of electricity for higher-emissions fossil fuels in as many end-use activities and services as possible. Examples include the adoption of electric vehicles in the transportation sector or replacing fossil-based heating systems such as furnaces, water boilers, and other appliances for electric alternatives.
Electrification is considered the primary method of decarbonization because the pathway is well-understood with the existing technology facing fewer barriers for deployment. A 2017 study by the U.S. National Renewable Energy Laboratory estimated that the combination of power sector decarbonization and the electrification of end uses could result in GHG emissions reductions of 74% below 2005 levels by 2050. The electrification of end uses alone resulted in a 41% reduction.5
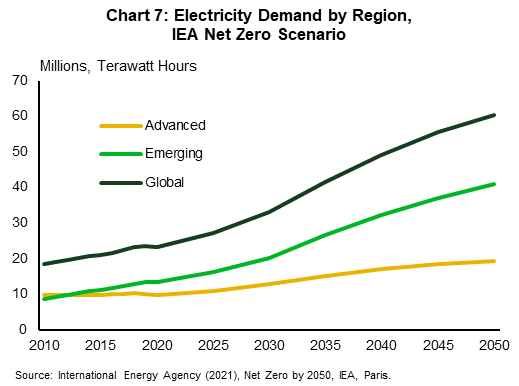
Significantly higher electricity usage thus features prominently in most outlooks for net zero. In the IEA's recent scenario, electricity demand doubles through 2050 in advanced economies and quadruples in emerging markets (chart 7). However, electrification has its challenges. It is simply not possible to electrify every single end-use service and activity.
Fuel Switching/Clean Fuels
This reinforces the importance for decarbonization processes to build upon several platforms, with the other being clean fuel sources to replace fossil fuels. Clean fuels are essentially renewable or low carbon alternatives to traditionally extracted fossil fuels and can be derived from a variety of sources.
Most clean fuels fall into two main categories:- Hydrogen, including fossil-based hydrogen and green hydrogen produced via electrolysis, and hydrogen-based fuels, including methane and electrofuels.
- Biofuels, including green or drop-in fuels that can be used in existing equipment and infrastructure, and synthetic or renewable hydrocarbons that are lower carbon versions of existing fossil fuels.
Fuel switching is considered a secondary method of decarbonization, mainly because many clean fuels are at a relatively early stage of development. This makes them expensive to produce and causes significant barriers to deployment relative to electrification. Hydrogen, for example, can be produced in one of two main ways. One method is to crack natural gas (or methane) with steam in order to produce hydrogen molecules, referred to as blue hydrogen. A second approach is to split water molecules into hydrogen and oxygen using electrolysis, or green hydrogen. Both processes are nascent and expensive, particularly green hydrogen which is a cleaner version since it does not require the extraction of natural gas. By extension, these same technical limitations apply to hydrogen-based fuels.
There is also limited infrastructure to transport hydrogen in the same capacity as natural gas. New pipelines would need to be built or existing pipelines retrofitted. Lastly, very little of our end-use equipment uses hydrogen. This would require replacing or retrofitting infrastructure systems where hydrogen is a feasible alternative.
Clean fuels also must contend with a lower level of energy density relative to their fossil-based counterparts. Both, hydrogen and biofuels, are unable to be used in certain industrial applications. Replacing jet fuel in aviation is an oft-cited example, where no clean fuel can produce the amount of energy needed to power an airplane. Some biofuels can be produced to mimic their fossil counterparts. These are referred to as synthetic hydrocarbons, such as bio or renewable natural gas, propane, and kerosene. However, like hydrogen, they are at an early stage of development and still require additional investment to become scalable and viable as direct replacements for traditional fossil fuels. Synthetic hydrocarbons are also only "clean" on the production side with the use of carbon capture, as emissions are produced when they are combusted. These fuels are considered carbon neutral because the emissions produced are part of a cycle where organic feedstocks grown for the purposes of fuel production notionally absorb those same emissions.
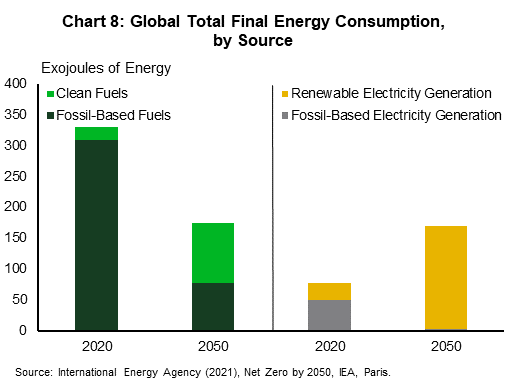
These are challenging barriers to overcome and far more complicated than building renewable electricity generation and more transmission lines. And, like electrification, there are still activities and end-use services that will likely require the continued usage of fossil fuels. The IEA estimates that, as of 2020, fuels accounted for 81% of global final energy consumption across all sectors of the economy. Of that, only 6% are clean fuels. In their net zero projections, energy demand is increasingly met by electrification, but even by 2050, fuels still represent 51% of energy consumption, with the clean fuel share rising to about 55% (chart 8).
Carbon Capture, Utilization, and Storage
Another option to eliminate emissions is to physically sequester them. Depending on the country's economic make-up, this process can be employed as a substitute or compliment to the other processes. As we've repeatedly pointed out, the path to net-zero is herculean and complex. There is no silver bullet. All processes and technologies need to be on the table, even if some are viewed only as an interim step.
There are three separate elements to the process of sequestration: carbon capture, carbon utilization, and carbon storage, collectively known as CCUS Carbon capture is the process of extracting and isolating carbon emissions, of which there are two different types:
- Point source capture, which is primarily used in industry to capture flue gas or waste emissions. In this form, carbon capture typically involves equipment that is either retrofitted or built into an industrial application, in which carbon can be extracted at different points in the process.
- Carbon dioxide removal (CDR), which removes carbon from the ambient air, including afforestation and natural carbon sinks, bioenergy with carbon capture and storage (BECCS), and direct air capture (DAC).
Carbon utilization refers to industrial applications of captured carbon, where there are only a limited number currently. Meanwhile, carbon storage refers to the long-term dedicated geological storage of captured carbon, where it is pumped into a variety of underground sites including saline mines, salt rock formations, or depleted oil & gas reservoirs.
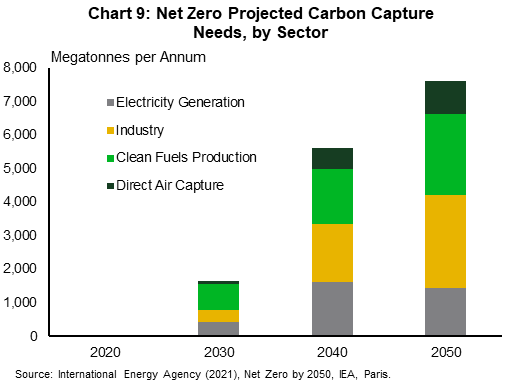
The importance of CCUS to the clean energy transition must be emphasized. The IEA estimates that 7.6 gT of emissions will need to be captured annually by 2050 in a net zero world (chart 9). Recall that global emissions were 47.6 gT of GHGs in 2018. This means that carbon capture alone is responsible for roughly 16% of the cumulative emissions reductions from current levels.
However, like clean fuels, carbon capture technology is at varying stages of development. It can be expensive and requires an entirely new infrastructure and the development of end uses to support it. According to the Global CCS Institute, there are 65 commercial carbon capture facilities, of which 26 are currently operational. These capture a total of 40 megatonnes of carbon per year6 globally, which is a small fraction of the 7.6 gigatonnes the IEA estimates will be needed. In addition, the Net-Zero America project from Princeton University estimates that roughly 110,000 km of CO2 pipelines are needed to support the transition to net zero.7 This is roughly comparable to the aggregate length of the U.S. liquid fuel pipeline mileage that has been built since 2000.8
Putting the framework to use – the transportation sector as an example
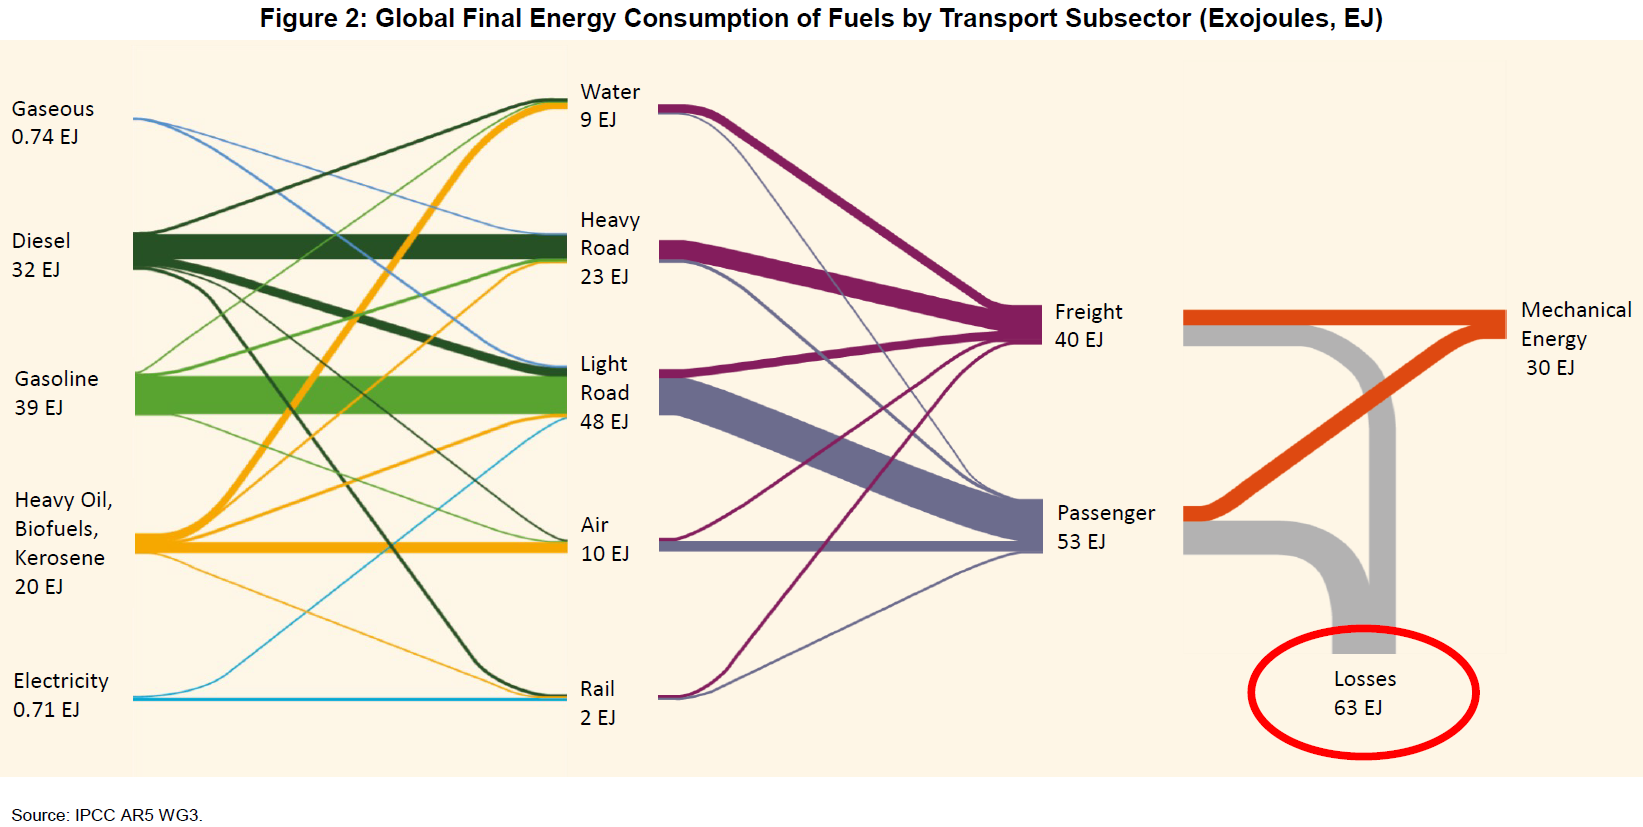
With the four main decarbonization concepts now explained, it can be applied against the transportation sector as a practical example of the necessity to keep all options open. Transportation represents 14% of global emissions,9 30% in Canada (chart 3), and 29% in the U.S.10 There are three main subsectors that tend to be the focus for decarbonization: passenger transportation, freight, and aviation.
Energy Efficiency
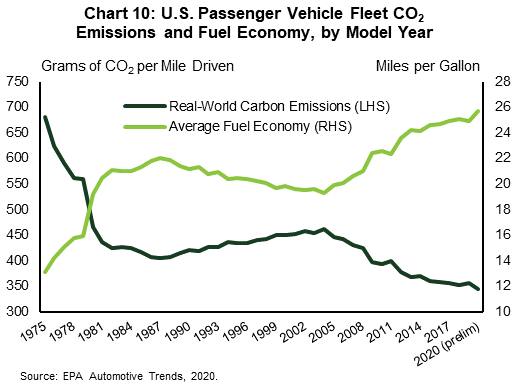
The first step in decarbonizing the sector is to increase the energy efficiency of end-use equipment, the most prominent being internal combustion engines (ICE). This has, in fact, already been occurring due to a combination of federal and subnational policies around average fuel standards and changing consumer preferences. According to the U.S. Environmental Protection Agency, the average fuel economy of the U.S. passenger vehicle fleet has increased by 33% since 2004 and has almost doubled since 1975. Consequently, the amount of carbon emissions per mile driven has fallen by 25% and 49%, respectively. Over the near term, increasingly stringent fuel economy regulations will be a primary source of continued decarbonization. The Biden administration and the U.S. Department of Transportation recently reversed a Trump-era policy by reinstating an 8% annual increase in fuel economy standards for the 2024-26 model years. In Canada, a 2014 amendment to GHG emissions standards for light-duty vehicles required a 5% annual reduction in CO2 per mile driven between the 2017 and 2025 model years.
Electrification
Over the longer-term, electrification will play the biggest role in decarbonizing passenger transportation. Zero-emissions vehicles (ZEV) – which primarily refers to battery electric vehicles (BEV), though hydrogen fuel cell electric vehicles (FCEV) are also included – will replace ICE vehicles. Governments around the world have already announced aggressive near-term targets for ZEV sales. Both the U.S. and Canadian governments hope to reach 50% ZEV sales by 2030, with the Canadian government having a further aspirational goal of 100% of sales by 2035.11 National and subnational governments, including state and provincial, have even begun to announce ICE vehicle sales bans. Norway, France, the UK, California, and British Columbia have all set various deadlines within the next decade or so to outright end sales.
Clean Fuels
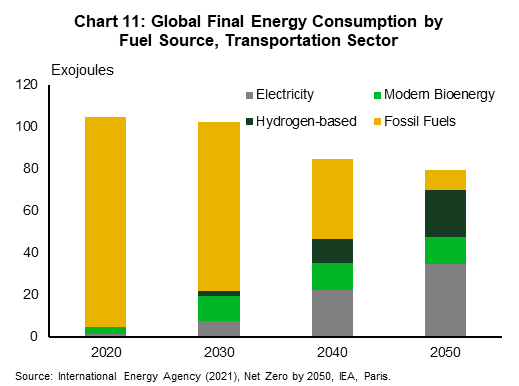
Electrification also features in decarbonizing the freight sector, but to a lesser extent. Freight is separated into rail, road freight, including heavy duty vehicles (HDV), and shipping, with the latter two requiring a denser energy source that traditional batteries are not able to provide. Applying this framework, shifting freight towards electrified rail is one method of decarbonizing the subsector, but given that most freight is transported via trucks and other HDVs, clean fuels become the next candidate for decarbonizing the sector. This will also be the most likely path for decarbonizing freight and passenger aviation, as well. HDVs that can run on biofuels and hydrogen-based fuels, such as renewable natural gas (RNG), hydrogen, or synthetic hydrocarbons are becoming increasingly common.12 And although it is still in early development, sustainable aviation fuel (SAF) is expected to be dominated by synthetic paraffinic kerosene (SPK) which is a synthetic version of fossil-based jet fuel (kerosene) derived from organic material such as algae or other plant sources.13 According to the IEA, electricity and bio/hydrogen-based fuels account for just 4.5% of final energy consumption in the transportation sector today. That share is projected to grow to 88% by 2050 (chart 11).
CCUS and the Enabling Factors
The challenge in reaching these levels of electrification and clean fuel adoption, however, lie in the enabling factors. On the passenger transportation front, the key barriers to BEV adoption are threefold: the upfront cost differential between EVs and ICE vehicles, range anxiety,14 and the convenience of charging, including the network of stations available. The financial benefit of driving an electric vehicle is already well-established due to both lower lifetime fuel costs15 and lower maintenance16. However, a 2020 Ipsos poll indicated that only 30% of Americans stated they would purchase an eco-friendly vehicle, with the biggest barrier cited as the sticker price difference relative to an ICE vehicle.17 To address the differential, continued innovation and scaling will be needed in battery technology, electric motors and drivetrains, and general assembly to lower the overall costs of electric vehicles. Government rebates have been and will continue to play a critical role in addressing this issue. Technological innovation in battery technology should also notionally address range anxiety, as well.
The Ipsos study also cited the network of charging stations and convenience of charging as a barrier. According to the U.S. Department of Energy Alternative Fuels Data Center, there were 31,738 public and private EV charging stations across the country as of December 2020 and President Biden's upcoming infrastructure bill is expected to add between 250,000 and 500,000 more, depending on approved funding.18 Unfortunately, this is only a fraction of what will ultimately be needed: the Net Zero America Project estimates that 15.1 million chargers will be needed to sustain a U.S. fleet of 96% EV stock. In other words, significant public and private investments to expand the charging network will be critical in incentivizing further adoption. This is a reminder of the importance pre-emptive policy plays in facilitating the scaling up of new technology adoption by households: 'if you build it, they will come'.
From a freight and aviation perspective, the key to increasing clean fuel adoption is much the same with a greater focus on technological innovation given that the sector is not as far along as that of BEVs. The first priority is to continue to scale up both the production of clean fuels and of end-use equipment in order to make it financially feasible for firms to replace their existing fleets. However, the build out of the infrastructure necessary to support that transition is even greater than it is for passenger transportation. Clean fuels naturally require a significant build-out of not only production and technology given their stage of development. In addition, they might also require the development of carbon capture technology and infrastructure, pipeline transportation, and the related supply chains around feedstocks that will be used to produce those clean fuels.
Final thoughts
End Notes
- https://www.ft.com/content/72d0ec90-29e3-4e95-9280-6a4ad6b481a3
- https://eciu.net/netzerotracker .
- https://iea.blob.core.windows.net/assets/d0f81f5f-8f87-487e-a56b-8e0167d18c56/Market_Report_Series_Energy_Efficiency_2018.pdf
- https://www.iea.org/reports/net-zero-by-2050
- https://www.nrel.gov/docs/fy17osti/68214.pdf
- https://www.globalccsinstitute.com/resources/global-status-report/
- https://netzeroamerica.princeton.edu/img/Princeton_NZA_Interim_Report_15_Dec_2020_FINAL.pdf
- https://www.ft.com/content/e06e005d-94a6-49c3-8f00-fe1156279149
- https://www.ipcc.ch/report/ar5/syr/
- https://www.epa.gov/ghgemissions/inventory-us-greenhouse-gas-emissions-and-sinks
- https://liberal.ca/climate/100-zero-emissions-car-sales-by-2035/
- https://www.reuters.com/article/us-amazon-engines-natural-gas-exclusive-idUSKBN2A52ML
- https://www.iea.org/commentaries/are-aviation-biofuels-ready-for-take-off
- Worry on the part of a person driving an electric vehicle that the battery will fully deplete prior to either reaching one's destination or a suitable charging point
- https://www.nrel.gov/news/press/2020/research-determines-financial-benefit-from-driving-electric-vehicles.html
- https://www.energy.gov/eere/vehicles/articles/fotw-1190-june-14-2021-battery-electric-vehicles-have-lower-scheduled
- https://www.ipsos.com/en-us/news-polls/Battery-Electric-Vehicles
- https://www.wired.com/story/biden-wants-more-evs-charging-stations/#:~:text=Biden%20initially%20asked%20for%20%2415,chargers%2C%20it%20could%20finance%20more. .
Disclaimer
This report is provided by TD Economics. It is for informational and educational purposes only as of the date of writing, and may not be appropriate for other purposes. The views and opinions expressed may change at any time based on market or other conditions and may not come to pass. This material is not intended to be relied upon as investment advice or recommendations, does not constitute a solicitation to buy or sell securities and should not be considered specific legal, investment or tax advice. The report does not provide material information about the business and affairs of TD Bank Group and the members of TD Economics are not spokespersons for TD Bank Group with respect to its business and affairs. The information contained in this report has been drawn from sources believed to be reliable, but is not guaranteed to be accurate or complete. This report contains economic analysis and views, including about future economic and financial markets performance. These are based on certain assumptions and other factors, and are subject to inherent risks and uncertainties. The actual outcome may be materially different. The Toronto-Dominion Bank and its affiliates and related entities that comprise the TD Bank Group are not liable for any errors or omissions in the information, analysis or views contained in this report, or for any loss or damage suffered.
Download
Share: