U.S. East Coast Labor Market Pulse Check:
Healthier in the South
Admir Kolaj, Economist | 416-944-6318
Date Published: September 27, 2023
- Category:
- US
- Labor
- State & Local Analysis
Highlights
- U.S. job growth is slowing, and we expect labor market conditions to cool further in the quarters ahead. Zooming in on the East Coast, labor market performance and prospects appear generally softer in the northern half of the region, with job growth recently slowest in New England, followed by the Mid-Atlantic region, although for different reasons.
- The Mid-Atlantic appears to have the weakest job market along the East Coast, with a higher average unemployment rate and fewer job openings relative to people looking for work. Slow population growth will nonetheless help limit the upside pressure on the region’s unemployment rate as job growth is poised to lose speed further ahead.
- The labor market in the southern half of the East Coast remains on much better footing, especially in the Lower South Atlantic, with strength spearheaded by Florida. Job markets are generally tighter, with labor demand looking stronger, suggesting it should continue to maintain an edge on hiring over the nation.
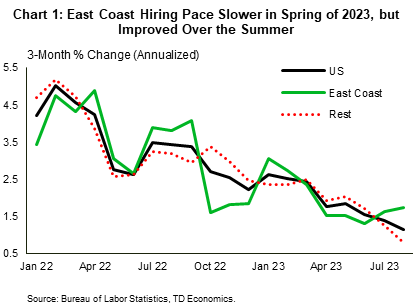
The resiliency of the U.S. labor market has been central to the economy’s sturdy performance so far this year (see latest forecast). But, recent data show that hiring has already started to cool, with the overall quits rate normalizing lower recently and job openings coming down. Zeroing in on the East Coast, job creation in the first half of this year lagged the rest of the country. More recently, momentum has improved, with job creation shifting slightly ahead of the nation over the summer (Chart 1). However, the recent progress has not been enough for the East Coast to pull ahead of the rest of the nation on hiring in year-over-year terms. The one exception is the Lower South Atlantic region, which has outpaced the nation for some time. This is consistent with a longstanding theme, with more strength generally found the further south you go.
Hiring in New England Restrained by Worker Shortage
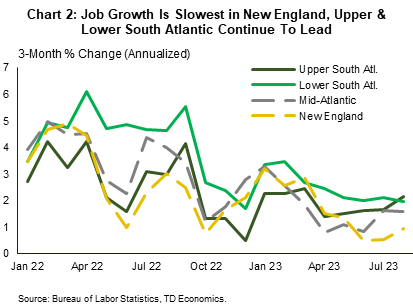
Job growth seems to follow the climate, with the hiring pace slowest in New England, even as this region experienced a bit of an uptick over the summer (Chart 2). Half of the states in New England experienced net job losses over the three-month period ending in August, namely New Hampshire, Rhode Island and Vermont. Recent declines in education sector employment, and milder pullbacks in manufacturing and retail payrolls have been the key contributors to the region’s recent soft showing. However, its jobless rate remains the lowest among the four East Coast regional peers (see Table 1).
With an unemployment rate this low, it is the supply of labor, rather than demand, that has likely been an impediment to stronger job growth over the past year. The tightness in the region’s labor market is the result of a lagging recovery in its labor force participation rate combined with soft population growth. Job openings in the region still outnumber unemployed workers by a wide margin. As of July, there were 2.2 jobs for every unemployed worker in New England – a ratio that is even higher than some of the southern peers in states such as New Hampshire (3.7), Vermont (2.9) and Massachusetts (2.6; see Table 2).
The worker shortage in New England has been ongoing for some time. Businesses have boosted compensation to try and attract workers, with hourly wages in most states having risen more than elsewhere along the East Coast since the start of the pandemic, with Connecticut the only exception to this theme (see Table 1). The strongest wage gains over this period are in New Hampshire and Rhode Island (up by around 25% from February 2020). Above-average wage gains earlier in the pandemic have the potential to lead to an underperformance later in the cycle as businesses hit their upper limit in terms of what they are willing to pay for labor. This appears to already be the case in about half of New England’s states, whose wages gains now lag the U.S. in year-on-year terms.
Table 1: East Coast Job Growth, Wage Growth and Labor Market Tightness
Table 1 presents information on three key indicators set up in column blocks: payrolls, wages, and the unemployment rate. The columns show growth over select periods of time, such as percent changes since the start of the pandemic, year-on-year percent changes, and, in the case of unemployment also the level per the latest available data point (August 2023). Set up in the rows are all the entities that this information pertains too, namely the U.S., the East Coast region, all states on the East Coast shown individually, along with the four subregions that make up the East Coast (i.e., New England, Mid-Atlantic, Upper South Atlantic and Lower South Atlantic). The data is color-coded to help identify trends across the table.
| Payrolls | Wages | Unemployment Rate | ||||||||
| % Chg. Since Feb 2020 | Y/Y % Chg. (3-mma) |
3-Month Ann. % Chg. (Aug vs. May) |
% Chg. Since Feb 2020 | Y/Y % Chg. (3-mma) |
Current | Chg. Since Feb 2020 (Basis Points) |
Y/Y Chg. (Basis Points) |
Rolling Quarterly Difference (3-month avg. ending in Aug. vs. 3-month avg. ending in May; Basis Points) | ||
| US | 2.7 | 2.2 | 1.2 | 18.5 | 4.4 | 3.8 | 30 | 3 | 10 | |
| East Coast | 2.7 | 2.1 | 1.7 | 15.4 | 3.6 | 3.2 | -47 | -25 | -15 | |
| New England | CT | -0.2 | 1.3 | 0.4 | 7.4 | 3.2 | 3.6 | -30 | -33 | -17 |
| MA | 1.2 | 2.5 | 2.3 | 18.7 | 3.7 | 2.6 | -20 | -120 | -57 | |
| ME | 1.1 | 1.0 | 0.5 | 21.3 | 4.0 | 2.5 | -70 | -23 | -3 | |
| NH | 1.3 | 1.7 | -1.9 | 25.2 | 6.0 | 1.8 | -80 | -77 | -37 | |
| RI | -2.7 | -1.0 | -0.9 | 24.8 | 8.1 | 2.7 | -100 | -43 | -23 | |
| VT | -3.0 | 0.4 | -1.8 | 22.7 | 7.9 | 1.8 | -40 | -70 | -57 | |
| Mid-Atlantic | NJ | 2.7 | 1.8 | 0.4 | 14.3 | 3.1 | 4.2 | 10 | 73 | 40 |
| NY | -1.1 | 1.6 | 1.4 | 12.2 | 3.2 | 3.9 | -20 | -10 | -10 | |
| PA | 1.3 | 2.5 | 2.6 | 15.8 | 3.5 | 3.5 | -120 | -70 | -50 | |
| Upper South Atlantic | DC | -3.4 | 1.4 | 0.5 | 5.5 | -0.2 | 5.0 | -70 | 90 | 7 |
| DE | 3.1 | 2.5 | -2.7 | 11.0 | 3.2 | 4.1 | 40 | -27 | -17 | |
| MD | -0.7 | 1.2 | 2.5 | 13.1 | 0.5 | 1.7 | -180 | -143 | -70 | |
| NC | 6.9 | 2.4 | 3.3 | 20.6 | 3.9 | 3.3 | -50 | -43 | -13 | |
| VA | 1.7 | 1.8 | 1.3 | 12.9 | 0.4 | 2.5 | -40 | -7 | -50 | |
| WV | -1.3 | 1.3 | 2.9 | 14.7 | 3.2 | 3.6 | -170 | -57 | 10 | |
| Lower South Atlantic | FL | 7.8 | 3.1 | 2.4 | 19.8 | 6.1 | 2.7 | -30 | -7 | 7 |
| GA | 5.3 | 2.0 | 1.7 | 16.5 | 4.5 | 3.3 | -30 | 20 | 10 | |
| SC | 5.0 | 2.4 | 0.9 | 18.3 | 4.9 | 3.0 | 10 | -17 | -7 | |
| New England | 0.4 | 1.7 | 0.9 | 17.3 | 4.3 | 2.7 | -37 | -79 | -40 | |
| Mid-Atlantic | 0.4 | 1.9 | 1.6 | 13.5 | 3.3 | 3.8 | -43 | -6 | -10 | |
| Upper South Atlantic | 2.6 | 1.9 | 2.1 | 14.3 | 1.7 | 2.8 | -81 | -50 | -35 | |
| Lower South Atlantic | 6.7 | 2.7 | 2.0 | 18.6 | 5.4 | 2.9 | -25 | -1 | 6 | |
Table 2: East Coast Labor Force Recovery and Job Demand
Table 2 presents information on three key indicators set up in column blocks: labor force, the labor force participation rate, Job openings, and the ratio of job openings to unemployed workers. The columns tend to show growth over select periods of time, such as percent changes since the start of the pandemic, year-on-year percent changes, and, along with levels per the latest available data point as in the case of the labor force participation rate and the ratio of job openings to unemployed workers. Set up in the rows are all the entities that this information pertains too, namely the U.S., the East Coast region, all states on the East Coast shown individually, along with the four subregions that make up the East Coast (i.e., New England, Mid-Atlantic, Upper South Atlantic and Lower South Atlantic). The data is color-coded to help identify trends across the table.
Mid-Atlantic Region Has Seen Greatest Labor Market Softening
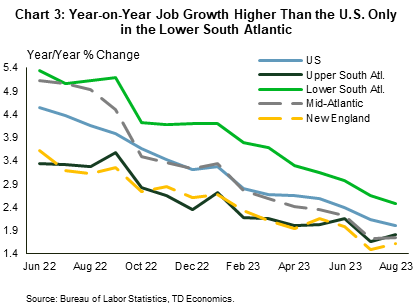
The Mid-Atlantic’s labor market is looking to be the coolest on the East Coast, with hiring well below that of the nation for much of this year (Chart 3). However, job growth improved notably over the summer, creeping above the U.S. rate for a change. This thanks in large part to a better performance in New York, which makes up about half of employment in the region. An acceleration in job growth in Pennsylvania from a pace of just under 2% in May (annualized 3-month moving average) to 2.6% in August has also lent a hand.
The region’s unemployment rate of 3.8% is well below its pre-pandemic level of 4.3%, but this is still the highest among its East Coast regional peers. Similarly, while job openings across the Mid-Atlantic are up 23% from the pre-pandemic period, this is still the softest regional showing on the East Coast. Continuing with this theme, the ratio of job openings-to-unemployed workers is also the lowest along the East Coast, with only a little more than one job opening (1.3) per unemployed worker. This ratio stands at 1.2 in New York – the lowest level on the East Coast – with New Jersey’s and Pennsylvania’s balance only slightly higher at respectively 1.3 and 1.5 jobs per unemployed worker.
Quits rates – an indication of workers leaving for better opportunities – also appear to be more muted across the Mid-Atlantic region. Rates of 1.5% in New York, 1.9% in New Jersey and 2.1% in Pennsylvania are all below the 2.3% national rate. Given the region’s relatively looser labor market conditions, wage growth across the Mid-Atlantic continues to move below the U.S. rate (see Table 1). Slower population growth is nonetheless expected to limit the availability of labor over the medium term. All three states saw their population shrink last year, led by New York. This trend is unlikely to improve much over the medium term (see our State Economic Forecast forecast here). This will limit supply-side pressures in the labor market amidst an expected softening in employment growth ahead.
Upper South Atlantic – A Mixed Bag
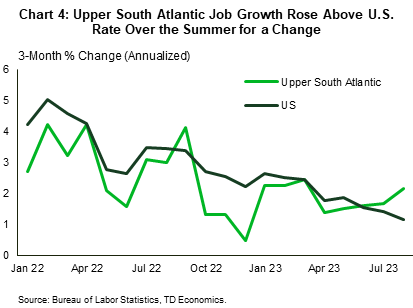
Job growth in the Upper South Atlantic accelerated over the summer, moving past the national rate (Chart 4). This was led by notable improvements in North Carolina, Maryland and West Virginia, which more than offset the softness in D.C. and the weakness in Delaware.
However, an underperformance in the first half of the year meant that the region’s hiring pace remained well below that of the nation in year-over-year terms. This underperformance theme also applies to the pandemic job recovery so far. Payrolls in the region are up 2.6% from February 2020, slightly less than to the 2.7% gain nationally. That said, there are wide differences within the Upper South Atlantic. For instance, D.C., West Virginia, and Maryland have yet to fully recover the jobs lost during the pandemic (see Table 1). Meanwhile, states like North Carolina and Delaware are doing much better, with payrolls up 6.9% and 3.1% respectively since the start of the pandemic.
Contrary to the mixed picture presented by job growth, labor market tightness measures paint a slightly more even picture across the region. Unemployment rates are below their pre-pandemic average in all but Delaware. The unemployment rate in the latter remains well above the pre-pandemic period as a result of a sharp expansion in the labor force. Unemployment rates in the region have also continued to head lower over the last few months, with the mild 30 basis point uptick in West Virginia to 3.6%, the only exception.
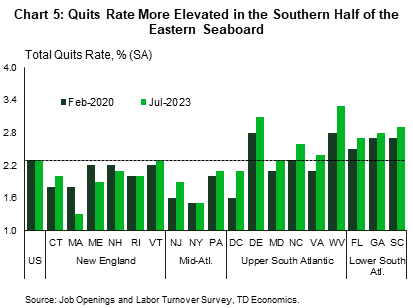
This tighter job market theme is echoed in the job openings data. There are 2.2 jobs available for every unemployed worker in the Upper South Atlantic versus only 1.5 jobs nationwide. Even the states with the lowest ratios – Delaware and North Carolina – are tighter than the national average. Maryland is the tightest, at 2.9 jobs per unemployed worker. The abundance in job openings through mid-summer is consistent with an above-average quits rate across most states in the region (Chart 5).
Ultimately, despite some variability among states, job growth in the Upper South Atlantic continues at a decent clip, while a stronger labor demand signals additional support for hiring in the months ahead.
Lower South Atlantic – Still Fastest
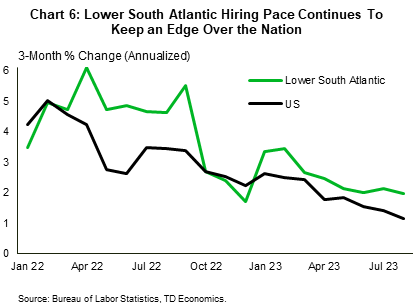
The Lower South Atlantic continues to see the fastest job growth along the East Coast. This theme is evident across several indicators shown in Tables 1 & 2 and in Chart 6. The strength is concentrated in Florida, with payrolls up 7.8% from the pre-pandemic level and job growth more recently continuing to outpace the nation by a considerable degree.
Strong job growth has absorbed slack in the labor market, with the region’s unemployment rate sitting at 2.9% in August – a few ticks below its pre-pandemic average of 3.2%. This is an impressive outturn given that the Lower South Atlantic labor force has expanded at an above-average clip since the start of the pandemic (up 5.7% vs. 2.1% nationally), thanks in part to the inflow of domestic migrants from other parts of the country.
Workers are also jumping ship for better opportunities at an elevated quits pace across all three states (see Chart 5). Meanwhile, labor demand remains strong, with nearly two jobs available per unemployed worker. This suggests that there is plenty of gas in the tank to keep the trend going, with the region likely to continue outperforming on job growth ahead. At the same time, the supply of labor is likely to be a bigger impediment to stronger job growth over the near-term. This may be a particular issue in Florida as a new state law that went into effect earlier this summer may limit the participation of undocumented immigrants in the labor force over the near-term.
Still, looking beyond the very near-term, we expect the Sunshine State’s and the region’s labor market to loosen amidst a combination of a slowing economic cycle and a positive inflow of domestic migrants that continues to bring more workers to the labor force. For more on our medium-term outlook, refer to our latest State Economic Forecast here.
Bottom line
The East Coast region exhibited a more pronounced slowdown in job growth over the spring, but a successful summer improved its position, with the region’s hiring pace moving slightly ahead of the nation’s in recent months. Not surprisingly, there are wide differences within the region, with negative pressures concentrated in the northern half, and labor market performance and prospects generally improving further south.
A higher ratio of job openings to unemployed workers, combined with faster population growth, suggest that the Lower South Atlantic should continue to keep its edge over the nation, even as the hiring pace in the region is anticipated to ease alongside a broader national deceleration in job growth.
On the other hand, we anticipate that the Northeast’s positive outturn this summer is likely to prove temporary, with the hiring pace in the region expected to shift back below the national rate in the quarters ahead. Sluggish population growth, typically an obstacle to boosting headcount, should nonetheless serve to limit labor market supply pressures in the Northeast as the pace of job creation cools further ahead.
Disclaimer
This report is provided by TD Economics. It is for informational and educational purposes only as of the date of writing, and may not be appropriate for other purposes. The views and opinions expressed may change at any time based on market or other conditions and may not come to pass. This material is not intended to be relied upon as investment advice or recommendations, does not constitute a solicitation to buy or sell securities and should not be considered specific legal, investment or tax advice. The report does not provide material information about the business and affairs of TD Bank Group and the members of TD Economics are not spokespersons for TD Bank Group with respect to its business and affairs. The information contained in this report has been drawn from sources believed to be reliable, but is not guaranteed to be accurate or complete. This report contains economic analysis and views, including about future economic and financial markets performance. These are based on certain assumptions and other factors, and are subject to inherent risks and uncertainties. The actual outcome may be materially different. The Toronto-Dominion Bank and its affiliates and related entities that comprise the TD Bank Group are not liable for any errors or omissions in the information, analysis or views contained in this report, or for any loss or damage suffered.
Download
Share: