U.S. Commercial Real Estate:
Debt Maturity Risks Linger, Potential for More Distress Ahead
Admir Kolaj, Economist | 416-944-6318
Date Published: February 14, 2024
- Category:
- US
- Real Estate
Highlights
- An estimated $540 billion in CRE loans are set to mature this year, with another $535 billion slated to mature in 2025. While this is roughly in line with last year’s volume of maturities, the ongoing deterioration in overall market fundamentals points to a potentially bumpier road ahead.
- The office sector, where the fundamental backdrop is weakest, will continue to face the most challenging conditions. But rising vacancy rates in the multifamily and industrial sectors speak to the potential for added signs of stress ahead.
- The expiration of 1-to-2-year loan extensions granted as the economy emerged from the pandemic will add to financing difficulties for some borrowers. On the plus side, prospects for a further downward grind in longer-term yields and a relatively resilient U.S. economy overall are likely to provide offsetting support.
The Fed’s aggressive hiking cycle has not been kind to Commercial Real Estate (CRE), with deal activity drying up and property values, especially those for the office sector, generally trending lower for some time now. Adding to CRE’s woes has been the large volume of loans maturing in this higher interest rate environment – estimated at $540 billion last year.1
The volume of CRE loans coming up for repayment is anticipated to remain elevated over the next few years, with some $2.2 trillion in CRE loans to come up for maturity through 2027.2 Combined with a slowing economic cycle, which will weigh on CRE fundamentals, this could be a recipe for more pain over the medium term. The expiration of 1–2-year loan extensions that were set up some time ago is an added risk factor. On a more positive note, as the Fed monitors the progress on inflation and gears up to cut interest rates, likely starting around mid-year, an expected pullback in yields should help provide some offset. Still, it remains to be seen to what extent this would limit the fallout, or if the pullback in rates will be ‘too little, too late’.
A market with strong fundamentals can more easily handle hurdles in its way, including an interest rate shock. Meanwhile, a market with soft or weak fundamentals is prone to an increased risk regarding non-performing and delinquent loans when also faced with external pressures. In this paper we first provide a brief update on the fundamentals for each of the four main CRE segments (office, multifamily, retail, and industrial), and then shift the discussion around risks surrounding CRE maturities and interest rates.
Office: As Leases Expire, Tenants Opt for Smaller Lease Sizes
The office CRE sector remains on a weak footing. Surveys show that office attendance continues to improve at mid-week and those that work in an office setting may have already noticed bigger crowds at the elevator halls or in cafeterias.3 But, this has had little positive impact on office CRE fundamentals. That’s because, overall, remote and hybrid work arrangements remain popular, and have seen little change over the last several quarters. Indeed, remote workdays have stabilized at around 30% over the last two years – a much higher level compared to the 5-7% rate before the pandemic.4 While relatively high attendance at mid-week presents an incentive to potentially hang on to more space, office tenants have generally tried to make more efficient use of space. In this vein, lease expirations have been used as an opportunity to reduce the overall footprint, with office tenants generally leaning toward smaller spaces in newer buildings with more premium amenities.
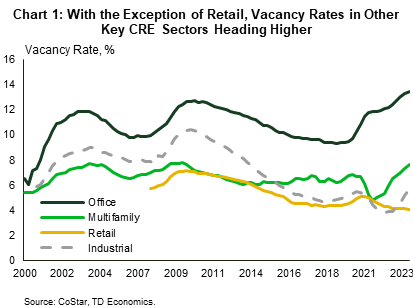
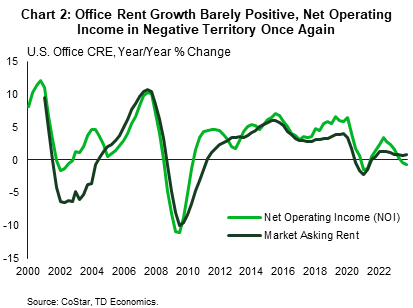
Ultimately, there’s been less demand for office space in the post-pandemic period, with estimates by CoStar showing that office tenants gave back around 65 million square feet of space last year. Leasing volume is down roughly 20% compared to the average during the 2010s, a trend that’s driven by lease sizes being smaller by about a fifth. Sublease inventory, meanwhile, remains elevated at around 205 million square feet – slightly lower than its peak in 2023, but still well above the average for the years leading up to the pandemic. Given the above, it is no wonder that the office vacancy and availability rates have continued to trend higher (Chart 1). Amidst this sluggishness, office rents are barely growing (Chart 2).
Even as overall payroll growth has remained robust, office-using employment has moved mostly sideways since late 2022. This is an added element that has weighed on the office market. While the U.S. is likely to avoid a hard landing, an expected slowdown in economic growth and the potential for a further softening in the hiring pace of office-using employment could further weigh on demand for office space. That said, the fact these trends would likely be accompanied by improved office attendance could help provide some meaningful offset. Employers continue to push with return-to-office (RTO) mandates, with IBM’s notice to managers and UPS’ notice to workers to return to the office five days a week marking two recent examples. With the labor market expected to loosen moderately ahead, a reduction in bargaining power on the side of office workers could lead to less resistance to such RTO plans, thus potentially increasing the intensity of working from the office. A meaningful drop in the private quits rate, which recently fell below its pre-pandemic level, points to reduced worker confidence, suggesting that things may already moving in this direction.
All factors considered, however, it appears that the deck is stacked against office fundamentals for the time being, with the office vacancy rate likely to continue trending higher this year, and rent growth to dip into negative territory once again, something that is sure to weigh on net operating income (NOI).
Multifamily: Delivery of New Inventory to Remain Elevated, Lead to Further Loosening in the Market
The fundamentals of the multifamily segment present a mixed picture. While there has been some clear improvement in demand recently, as highlighted by the uptrend in net absorption of apartment units over the last few quarters, supply has nonetheless continued to outpace demand. What’s more, the type of supply coming to market may not necessarily be catering to the needs of most consumers. Shut out of the ownership market given low housing affordability, and with elevated inflation taking a bite out of paychecks, many consumers have been tilting their sights toward more affordable rental options. But, a large portion of apartment units that have been delivered recently (and a lot of what’s in the pipeline) are higher-end 4–5-star properties, which tend to command higher rents. Overall, these imbalances have been reflected in an increased apartment vacancy rate – which has risen back above its pre-pandemic level – and slower rent growth. The CoStar rent measure shows that multifamily rent growth eased to 0.7% y/y in the final quarter of 2023, while another measure from Apartment List shows that rent growth ended 2023 in shallow negative territory (-1% y/y).
Real estate tends to be local, and this is especially important for the multifamily sector. To this end, Midwest and Northeast markets have fared best over the past year. On the other hand, the tables appear to have turned for many Sunbelt markets. Following increased development activity after the rise in domestic migration inflows during the pandemic, a subsequent cooldown in demand appears to have left many of these markets oversupplied. Apartment rent growth has fallen across most large metro areas in the region, with above-average declines recorded in Austin, Atlanta and Phoenix, as per data from Apartment List.
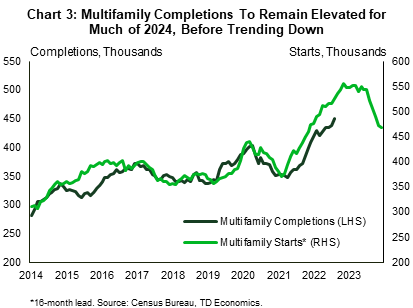
Overall, challenges on the homeownership front, including strained affordability and limited for-sale inventory, are expected to remain a tailwind for the rental market. But, with more than one million multifamily units under construction, deliveries are nonetheless anticipated to remain elevated over the course of this year, with the potential for demand to continue undershooting supply in the quarters ahead, and for rent growth to slow further (Chart 3).
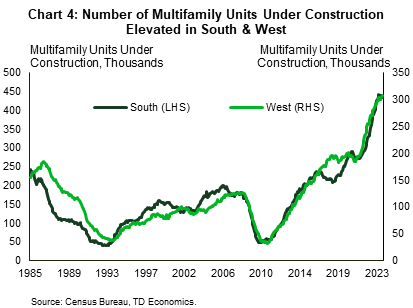
We reiterate that regional variations bear careful consideration here. More than two fifths (43%) of the one million multifamily units under construction are concentrated in the South Census region and close to a third (30%) are in the West – with both regions punching above their population weight (respectively 39% and 24% of the U.S. total). However, population growth in the South remained elevated last year at 1.1%, reflecting an increase in international migration. Combined with slower but still decent domestic in-migration, the region’s population grew by 1.42 million – the equivalent of more than 85% of the nationwide gain last year. A continuation of this trend could limit the downside risks for the South. On the other hand, the population in the West Census region has been barely growing (up 0.2% or 137,000 last year), so the elevated level of construction there could a bigger cause for concern (Chart 4).
Industrial: Strong Pandemic Outperformance is Fading
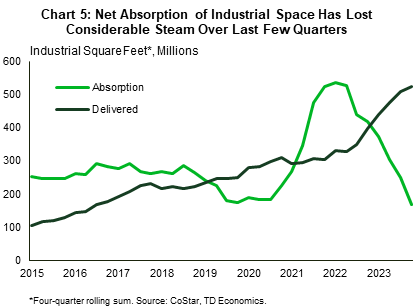
The industrial CRE segment had a solid performance during the pandemic, thanks in large part to the rapid rise in e-commerce sales early on. But, for some time now, activity in this corner of CRE has been shifting into lower gear, with net absorption of industrial space losing considerable steam over the past year (Chart 5). This latest softness is in part related to the weakness in the housing market, which has taken a toll on sales at furniture, building materials and appliances stores, and weighed on related warehousing & distribution activity. At the same time, the manufacturing sector continues to go through a challenging period. The supply of industrial space, however, has trended higher, with roughly 520 million square feet delivered last year. This combination has led to a 200-basis-point increase in the vacancy rate from its lowest point several quarters ago to 5.7% at the end of 2023, bringing it slightly above its pre-pandemic level. Rent growth has also cooled, though at around 6% y/y, it is still by far the strongest performance among the four key CRE sectors examined in this report.
We anticipate the industrial CRE market will continue to loosen over the near-term, with rent growth likely to slow to its softest pace in over a decade this year. But, by the turn of next year, the market should begin to find firmer footing. The amount of industrial space under construction has fallen sharply over the last few quarters. Based on development timelines, we anticipate that the amount of industrial space slated to hit the market should begin to trend lower toward the tail-end of this year. On the other hand, there’s some scope for demand to see some moderate improvement once the economy goes over the latest speedbump and the Fed begins to reduce interest rates. E-commerce sales have slackened to a more measured pace of 7.5% annualized. While this is well below the double-digit gains recorded during the pandemic, it is still ahead of growth in sales at bricks and mortar retailers – an element that should continue to provide some support for distribution space ahead. At the same time, multibillion-dollar investments in EV and battery projects that are expected to come online in the years ahead should be an added tailwind, as suppliers related to these projects are expected to set up manufacturing operations and distribution centers nearby.
Retail: Low Supply Helps Limit Downside Pressures
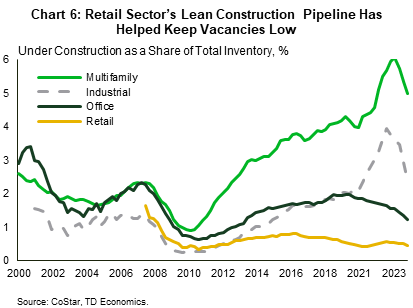
Retail is the only CRE sector out of the four examined in this report where the vacancy rate has continued to trend lower recently. The resilience of the labor market and in turn of the American consumer over the past year has lent plenty of support for retail spending, but the element that has really set this sector apart is its persistently lean construction pipeline (Chart 6). With very little product coming to market, and obsolete retail space being demolished and converted to other uses, the retail market has remained tight. The current 4% retail vacancy rate is some 170 basis points below its long-term pre-pandemic average. Amid this backdrop, rent growth had until recently been chugging along at a pace of around 4% y/y – well above the 2.5% average over 2013-19.
Looking ahead, an expected softening in consumption (see here for more detail) will weigh on demand. But, the high cost of construction and financing over the past year has meant that an already-lean construction pipeline has moderated further. The fact that the supply of retail space will remain relatively low, should help keep the sector in check and mitigate the risks from a moderation in demand.
CRE Debt Maturity Risks Still at Play
Soft or softening fundamentals will weigh on the flow of rental income that can be extracted out of these commercial properties. And with inflation expected to remain above target until 2025, interest rates to stay higher for longer, and insurance costs climbing, rising operating expenses will likely continue to weigh on property owners’ bottom lines. In turn, these elements yield less support for commercial property values. Estimates of how much commercial property values have fallen from their recent peak vary depending on the source and method of measurement, but most sources confirm that the office sector has seen the biggest adjustment, with values there down 25% from their recent peak according to the CoStar Commercial Repeat Sale Index and 35% according to the Green Street Commercial Property Price Index.5 The above-mentioned combination of fundamental headwinds is a potential recipe for more CRE distress ahead, especially given that the amount of commercial loans coming up for maturity is expected to remain elevated.
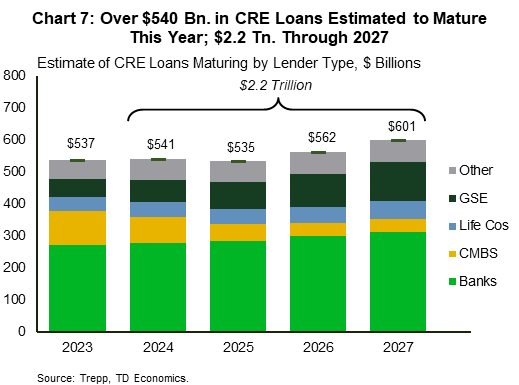
Given the various sources of financing for CRE loans (see breakdown here), the tracking of CRE loan data is more disaggregated and estimates as to what’s set to mature tend to vary. Data from Trepp shows that an estimated $540 billion was up for repayment last year. Despite a struggling office sector, where most of the stress was concentrated, most of these loans were either repaid or extended, with the latter an important element that helped limit the fallout in the CRE market.
The volume of loans set to mature this biennium is expected to remain elevated at $540 billion this year and $535 billion next year (Chart 7; a separate estimate points to some $150 billion in debt tied to office properties coming up for repayment by the end of this year6). By 2027, some $2.2 trillion will need to be rolled over. While the volume of loans maturing in 2024 and 2025 is similar to the 2023 level, the ongoing deterioration in overall market fundamentals points to a potentially bumpier road ahead.

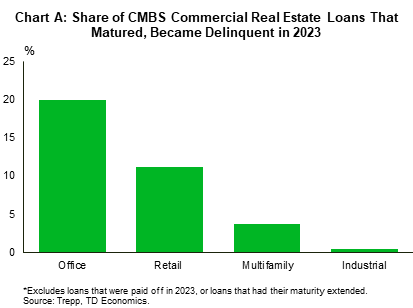
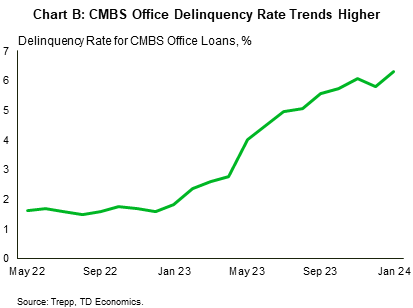
The delinquency rate of all CRE loans issued by banks in the U.S. stands at 1.1%, much lower compared to prior periods of stress such as the GFC, but it still exhibits a noticeable upswing (Chart 8). CMBS loan data, which makes up only a small part of the CRE market but tends to be timelier, helps shed additional light into the matter. According to data from Trepp, close to a fifth of all CMBS office loans that were slated to mature last year became delinquent (see chart A in the appendix). This is with the CMBS office delinquency rate rising progressively through the year, beginning at 1.9% in January 2023 and ending the year at 5.8% (see Chart B in the appendix). The rate kicked off 2024 at an even higher 6.3%. Signs of stress also appeared to be emerging in the multifamily segment, with the delinquency and special servicing rates there trending moderately higher through 2023, before easing at the start of this year. By comparison, the delinquency rate on industrial CMBS loans has been relatively stable at around 0.4% over the past year.
Given that property values have fallen over the last several quarters and that interest rates are higher now, many owners whose CRE loans mature, would likely need to inject additional capital to maintain adequate loan-to-value ratios (LTVs) as set out by the lender. To this end, a recent NBER paper finds that “after recent declines in property values following higher interest rates and adoption of hybrid working patterns, about 14% of all loans and 44% of office loans appear to be in a negative equity, where their current property values are less than the outstanding loan balances”. Finding capital in today’s higher rate environment will be harder and more costly. Failure to inject additional capital would mean having to sell in a soft market or handing the property keys back to the lender.
Lenders typically don’t want to take possession of properties that have fallen in value, and over the last couple of years, while the commercial and macroeconomic environments were still foggy, they were keen to modify loan structures through 1-2 year extensions to help borrowers ride out the uncertainty. However, with many of these extensions now expiring, and the CRE environment still challenging, more “hard” maturities may loom in the quarters ahead.
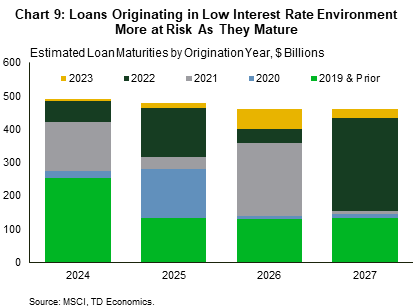
Tracking from MSCI, which shows estimated debt maturities by year of origination, help fill in another piece to the puzzle. Loans originating during the early phases of the pandemic when interest rates were at very low levels (and property values were at or near their peak), would be at an increased risk of delinquency or default when renewing in a higher rate environment. As chart 9 shows, a notable volume of loans coming up for maturity in the years ahead originated during this period.
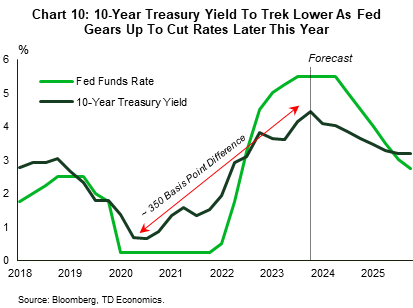
The 10-year treasury yield – often used as a benchmark rate for commercial real estate loans – has shot up some 350 basis points since its trough in mid-2020, so any loans originating three years earlier and set to mature in the current environment would experience a substantial interest rate shock (Chart 10). However, this is an extreme example. Thankfully, commercial real estate loans tend to be longer in duration, with one source assuming loans originating from banks have a median term of about seven years and those from life insurance companies at about nine years.7 Given this, and the fact that interest rates are expected to ease ahead, the interest rate shock for most loans should be much lower.
Fed’s Rate Cutting Cycle Can Help Limit the Fallout
With the Fed signaling that it is done raising rates this cycle, and rate cuts slated for later this year, a drop in long-term interest rates could help provide some meaningful offset. Our forecast, which calls for the Fed to begin gradually lowering rates around mid-year, assumes that the 10-year Treasury yield will fall to around 3.5% on average in the final quarter of this year and 3.2% in Q4-2025 (Chart 10). The rate has averaged a little over 4% over the last few weeks. Negotiating a commercial loan with a 50-to-80 basis point discount from the current level would certainly help limit distress at maturity. Market pricing, which anticipates the Fed to cut rates sooner and by a more aggressive 125 basis points this year, points to even lower long-term interest rates. Depending on which scenario unfolds, the lower the interest rate faced at maturity, the less distress there will be.
One final point is that the Fed’s anticipated cutting cycle is not only significant in determining financing costs at maturity, but also how quickly asset prices may recover. An aggressive cutting cycle would be beneficial to real property values, which in term could help rebalance loan-to-value ratios in favor of borrowers – a potentially important second-order benefit.
Bottom Line
A persistently lean construction pipeline is helping keep vacancies low in the retail CRE segment. But vacancy rates elsewhere are trending higher, with the fundamentals either weak (as is the case for the office segment) or softening (as is the case for the multifamily and industrial segments). Together with property values that have retreated from their pandemic highs, and a large amount of loans coming up for maturity in a higher interest rates environment, these elements suggests that we should brace for more distress in the CRE space ahead, especially as related to the weakness in the office sector. On the plus side, prospects for a further downward grind in longer-term yields and a relatively resilient U.S. economy overall are likely to provide offsetting support.
Appendix
End Notes
- See Trepp report here.
- Ibid.
- Kastle Systems tracking here.
- See WFH Research here.
- CoStar value-weighted index, see here. Green Street report see here.
- See estimate here. Focusing only on the CMBS space, data from another source (CREDiQ) points to around $31 billion in office loans coming due this year and $16 billion coming due next year, see here.
- See Trepp assumptions here.
Disclaimer
This report is provided by TD Economics. It is for informational and educational purposes only as of the date of writing, and may not be appropriate for other purposes. The views and opinions expressed may change at any time based on market or other conditions and may not come to pass. This material is not intended to be relied upon as investment advice or recommendations, does not constitute a solicitation to buy or sell securities and should not be considered specific legal, investment or tax advice. The report does not provide material information about the business and affairs of TD Bank Group and the members of TD Economics are not spokespersons for TD Bank Group with respect to its business and affairs. The information contained in this report has been drawn from sources believed to be reliable, but is not guaranteed to be accurate or complete. This report contains economic analysis and views, including about future economic and financial markets performance. These are based on certain assumptions and other factors, and are subject to inherent risks and uncertainties. The actual outcome may be materially different. The Toronto-Dominion Bank and its affiliates and related entities that comprise the TD Bank Group are not liable for any errors or omissions in the information, analysis or views contained in this report, or for any loss or damage suffered.
Download
Share: