High Debt Loads Are Common but U.S. Unique in Size of Ongoing Deficits
Vikram Rai, Senior Economist | 416-923-1692
Andrew Hencic, Senior Economist | 416-944-5307
Date Published: July 17, 2024
- Category:
- U.S.
- Financial Markets
Highlights
- The United States, like other major economies, has seen a large increase in its debt and deficits in recent years.
- Most major economies have a need to reduce their deficits to prevent their debt from becoming unsustainable.
- The difference between the US and its peers is in the trajectory of debt and deficits. Smaller deficits are expected to reduce the debt to GDP ratio in most other advanced economies, but not in the U.S.
One of the more common questions we get asked is, ‘How sustainable is U.S. government debt?’ Our report on the topic last month highlighted that, in addition to a high debt load, the U.S. is currently running large deficits that are expected to remain in place for the next several years. Deficits of this size cannot continue indefinitely as the interest charged on the debt will eventually eat up all tax revenues, leaving nothing left to pay for other government initiatives.
Another popular query is how other countries compare to the U.S. It’s a fair question – current U.S. deficits are, to some extent, a function of events impacting other countries as well – the global pandemic, heightened inflation, climate change, and rising geopolitical threats. Ageing demographics (and the resulting pressure on public pensions and healthcare systems) is another common challenge across advanced economies.
In terms of the level of government debt relative to the size of its economy, the U.S. is near the top, but it is not far off its rich country peers. The U.S. is also ahead in terms of the size of its current budget deficit, though it is certainly not alone. France, Italy and the United Kingdom are in similar positions. Where the U.S. stands out most is in the relative lack of improvement in its deficit over the next several years. Where most other countries have a plan to bring down deficits, there appears little on the horizon to the change the size of the gap between spending and revenues in the United States.
The U.S. is not alone in carrying a high debt burden
The starting point of this comparison is how much debt economies have, and whether it is on an increasing or decreasing trajectory. To put countries of different sizes on the same playing field, a common measure of the relative level of debt is the debt-to-GDP ratio – the ratio of outstanding government debt to annual economic output.
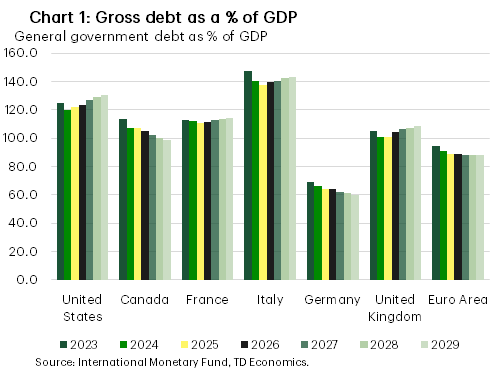
Here, we rely on official data and the latest forecasts from the IMF, which apply a consistent methodology for projecting government fiscal policies and their impact on borrowing1. Chart 1 shows that the U.S. debt-to-GDP ratio is comparable to its peers. While only Italy has a noticeably higher ratio, the U.S. is not much higher than Canada, France, or the United Kingdom. The debt-to-GDP ratio is forecast to increase in the U.S. the UK, and in France. It is flat or decreasing in other major economies.
U.S. deficits are more exceptional
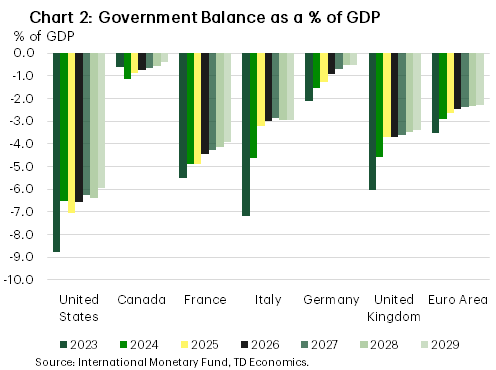
On the deficit front, the picture is similar. The U.S. deficit in 2024 is the highest, but it is not too far off deficits in France, Italy and the United Kingdom.
The U.S. stands out in the expected evolution of deficits. In other countries deficits are expected to continue to improve after 2024 (Chart 2).
The comparison to the euro area is helpful here as it encompasses an economic block similar in size to the U.S. and smooths out the idiosyncrasies of particular countries. Euro area shortfalls are smaller to begin with and are expected to shrink steadily from their current levels. Canada does even better, with much smaller deficits in 2024 and continued, albeit modest, improvement over the next several years.
Combining debt and deficit for an overall view
Clearly, a country’s debt level, its current deficit, and its future deficits are all necessary for assessing whether its fiscal policy is sustainable. If debt and deficits are both elevated, then there is a definite need to reduce the deficit in the future.
Chart 3 combines these metrics over time to place economies relative to each other. Generally speaking, the closer you are to the bottom right quadrant of this ranking, the greater the need to reduce the deficit from current levels. Many of the economies closest to the bottom-right quadrant may still have time and space to stabilize their fiscal policy; Japan, for example, is not pictured but is further out in that direction. Still, it is clear that from a comparative point of view, the U.S. is in an unenviable position of having both high debt and deficits. As the issuer of the world’s reserve currency, the U.S. is able to maintain relatively lower borrowing costs than other countries, but the longer it remains in this position, the more untenable this reality will become.
Enforceable Fiscal Rules Helpful in Keeping Policy on Sustainable Track
While deficits can arise due to unforeseeable events, countries have tried to increase investor confidence by putting in place fiscal rules for righting the ship after the storm. The European Union leads on this front. The EU treaty sets out fiscal rules for total debt and deficit spending. The historical reason for this rule is to prevent free-riding, as the European Union has mechanisms for fiscal transfers between countries, and some members are also on a common currency. This degree of economic and financial integration would be compromised if EU members’ shared fates were jeopardized by the deficits of a single member.
Targets for EU countries, updated in 2024, are to maintain general government debt below 60% of GDP and a deficit of less than 3% of GDP.2 These rules were temporarily suspended during the pandemic and in the aftermath of the energy crisis brought on by the Russian invasion of Ukraine. Beginning in 2024, countries will once again need to begin adhering to the common rules regarding debt and deficits.
In 2024, seven member states, including France and Italy, have been identified as being in breach of these conditions and will have new Excessive Deficit Procedures put in place.3 They have until September to provide plans to the European Commission outlining how deficits will be reduced in the coming years.4 In general, the new rules will require that the structural deficit shrinks by 0.5 percent of GDP per year.5
The United Kingdom also has a set of self-imposed but more easily alterable fiscal rules. In its current form, U.K. fiscal rules require the ratio of government debt-to-GDP (measured in net terms) to be falling five years out. The recently elected Labour party proposes to modify these rules, requiring the current budget – used to fund day-to-day operations – to be brought back into balance at some point in the future, but would allow deficit spending if it is used for investment.
In Canada, the federal government budgetary targets form one set of fiscal rules, while the provinces have jurisdiction over their own finances. Canada’s federal fiscal anchors mirror those of the UK in setting a target for the deficit and debt relative to the economy.6 Not all provinces have explicit fiscal targets, however the country’s largest, Ontario, employs a three-pronged approach, targeting the ratios of net debt-to-GDP and revenues, and the interest on debt to revenues.7
Bottom Line
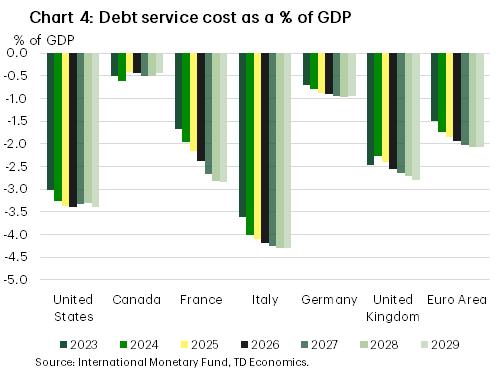
Concerns about budget deficits, government debt, and debt sustainability are not merely academic. Interest is charged on government debt, and these interest payments are expenditures funded by tax revenue that do not go to paying for government initiatives. Chart 4 shows that for several major economies, these costs are already significant budget expenditures. The U.S., Italy, the UK, and France all must devote considerable portions of annual output to the cost of the debt they carry. With the exception of the U.S., all are expected to see debt service costs rise considerably over the next several years. The U.S. has an advantage over its peers in this area, as it is able to borrow at favourable rates despite high debt and deficits. The average deficit in the euro area at the end of this forecast period is mostly interest expense on its debt. This is why European authorities may ultimately feel more urgency to address their public debt.
A second matter is that deficits affect economic growth. Barring rare circumstances, reducing the deficit will typically also reduce growth. The forecasts for most major advanced economies currently build in some deficit reduction, as this is planned in most economies. This is not the case in the U.S. – the projected deficit in 2024 is similar to the projections for the following five years.
Compared to the rest of the world, the U.S. is exceptional: it is the only high-debt country not expected to make an adjustment to deficit reduction in the coming years. Fortunately, it is not expected to pay significantly for this in terms of higher debt service costs, but this may not last forever.
End Notes
- These forecasts tend to be fairly similar to others recognized as authoritative for the country at hand, such as the Congressional Budget Office for the U.S., or the European Commission for Europe. Using the IMF’s figures means we can be more confident this is an apples-to-apples comparison.
- European Council, (April 29, 2024) “Economic Governance Review: Council Adopts Reform of Fiscal Rules” https://www.consilium.europa.eu/en/press/press-releases/2024/04/29/economic-governance-review-council-adopts-reform-of-fiscal-rules/
- European Commission. “Excessive Deficit Procedures – Overview” : https://economy-finance.ec.europa.eu/economic-and-fiscal-governance/stability-and-growth-pact/corrective-arm-excessive-deficit-procedure/excessive-deficit-procedures-overview_en
- EUR-Lex “Excessive Deficit Procedure (EDP): https://eur-lex.europa.eu/EN/legal-content/glossary/excessive-deficit-procedure-edp.html#:~:text=The%20aim%20of%20the%20excessive,of%20EU%20countries’%20fiscal%20policies
- European Council, (April 29, 2024) “Economic Governance Review: Council Adopts Reform of Fiscal Rules” https://www.consilium.europa.eu/en/press/press-releases/2024/04/29/economic-governance-review-council-adopts-reform-of-fiscal-rules/
- The objective is for the federal net debt-to-GDP ratio to be falling and a budget deficit no greater than 1% of GDP in the future.
-
“Building a Better Ontario: 2024 Ontario Budget” Page 13, https://budget.ontario.ca/2024/pdf/2024-ontario-budget-en.pdf
Disclaimer
This report is provided by TD Economics. It is for informational and educational purposes only as of the date of writing, and may not be appropriate for other purposes. The views and opinions expressed may change at any time based on market or other conditions and may not come to pass. This material is not intended to be relied upon as investment advice or recommendations, does not constitute a solicitation to buy or sell securities and should not be considered specific legal, investment or tax advice. The report does not provide material information about the business and affairs of TD Bank Group and the members of TD Economics are not spokespersons for TD Bank Group with respect to its business and affairs. The information contained in this report has been drawn from sources believed to be reliable, but is not guaranteed to be accurate or complete. This report contains economic analysis and views, including about future economic and financial markets performance. These are based on certain assumptions and other factors, and are subject to inherent risks and uncertainties. The actual outcome may be materially different. The Toronto-Dominion Bank and its affiliates and related entities that comprise the TD Bank Group are not liable for any errors or omissions in the information, analysis or views contained in this report, or for any loss or damage suffered.
Download
Share: