Highlights
- The likely trajectory of fiscal policy in the United States is to maintain significant federal budget deficits for the foreseeable future. If this comes to pass, the share of U.S. output consumed by interest payments on federal government debt will also rise indefinitely.
- To avoid such an unsustainable outcome, a large fiscal adjustment is required. The sooner it occurs, the smaller the adjustment will need to be.
- Barring a major renaissance of economic growth or a productivity boom, the fiscal adjustment must include at least one of the following elements: higher taxes, cuts to major entitlement programs (such as Social Security and Medicare), or deep cuts to discretionary spending.
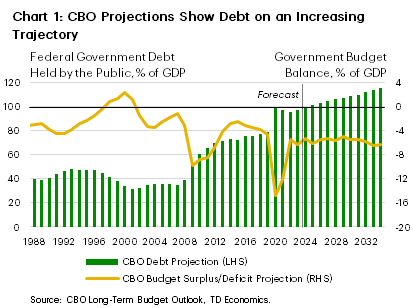
The U.S. federal government has run a deficit virtually every year for the past forty years. In 2024, the deficit will be around 4% of nominal gross domestic product (GDP). Under current policy, the Congressional Budget Office (CBO) projects that it will remain around this level for the next decade. This will lead to an increase in federal government debt held by the public, from 99% of GDP in 2024 to 116% of GDP in 2034 (Chart 1).1
These facts are not in themselves cause for alarm. The federal government, after all, has run a deficit for most of its history. This has yet to pose a serious problem for the bond market or the economy. Still, there is valid reason to be concerned that U.S. fiscal policy is not on a sustainable track and presents real downside risk to future economic prosperity.
What Sustainable Debt Means
A common refrain to endless U.S. budget deficits is that they are not sustainable. Still, deficits have been sustained for most of the modern history of the U.S., which naturally raises the question, what is meant by sustainable. The most obvious way in which the fiscal trajectory could be deemed unsustainable is if the interest burden on debt were ever increasing, threatening to swallow all tax revenues and eventually even all economic output.
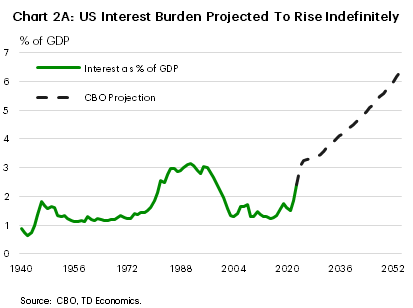
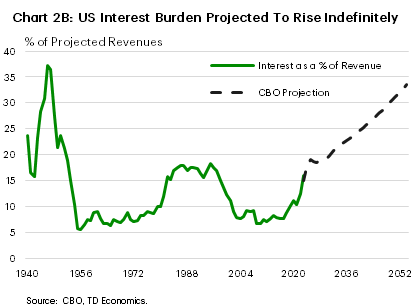
Unfortunately, this is the trajectory that U.S. fiscal policy is on. Chart 2 shows the projected path of interest payments on federal debt as a share of GDP. In modern history, interest paid by the Treasury on debt issued by the federal government has rarely exceeded 3%. In the CBO’s latest long-term outlook, U.S. interest payments are set to rise from around 2.5% of GDP at present to over 6% of U.S. GDP by 2050 and remain on an upward trajectory thereafter. They are expected to reach 3.25% in 2025, exceeding anything seen historically. The picture is starker considering net interest payments as a share of government revenue. If current policy is maintained, by 2050, over one-third of government revenue would go to interest payments.
It is worth pointing out that these long-term projections are highly dependent on the assumptions underlying it. The CBO takes a simple approach to how U.S. fiscal policy will evolve in the future: assuming that taxes will be collected as currently legislated, that spending programs currently in place will be renewed and that GDP growth remains steadily positive at rate consistent with productivity and demographic trends. This is a reasonable starting point for assessing the challenges of the U.S. fiscal situation since any adjustment would be a deviation from the current policy path.
Determining A Sustainable Debt Path
A simple alternative to interest expense ballooning as a share of GDP is for interest payments as a share of GDP to remain constant – neither increasing nor decreasing. This could be sustained forever.
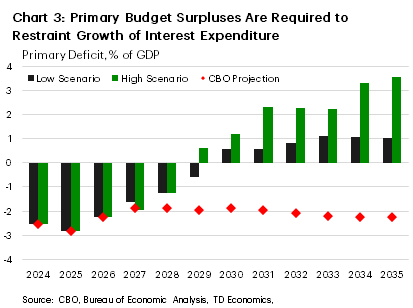
To arrive on what it would take for this to be achieved, we calculate the path of the primary deficit – that is, the deficit excluding interest payments, that would be required to maintain the share of interest on the debt at a record high of 3.25% of GDP. We do this in two ways: (1) a “Low” scenario, in which the average interest rate paid on publicly held federal debt does not increase, and (2) a “High” scenario, in which the average interest expense on the debt remains as projected by the CBO, despite deficit reduction. Scenarios are constructed as follows:
- We start with the CBO’s long-term projections of the shares of revenue, spending, deficits, and debt from 2024 to 2034.
- We link these projections to the latest annual data through 2023.
- We adopt the CBO’s assumption of around 4% annual growth of nominal GDP. This allows us to convert each variable of interest in the budget projections into nominal levels for each year of the CBO’s projections. This is a critical assumption, as significantly higher growth would reduce the needed deficit reduction.2
- From here, we reduce the level of the primary deficit in each period from the baseline projection such that the share of GDP taken up by interest never exceeds the 3.25% projected for 2025.3
- A range of outcomes is possible, as there are many variables that can change beyond just the deficit. We focus on the most directly relevant – the average interest charged on publicly held debt and the deficit.
- In the High scenario, we follow the CBO projections which imply that the average annual interest rate on publicly held debt rises to 3.4% over this period. This requires greater deficit reduction.
- In the “Low” scenario, borrowing rates average 3.25% from 2025 through 2034.
- In both projections, we estimate that $1 of deficit reduction reduces nominal GDP by $0.50 in the next year. The timing and magnitude of this effect is uncertain, but a multiplier of 0.5 is within the range of empirical estimates generally found in the literature.
The result of our thought experiment is illustrated in Chart 3: for net interest to remain at or below 3.25% of U.S. GDP for the next ten years, a primary surplus would be required by around 2030 (in either scenario). If the U.S. treasury benefits from lower interest rates because of lower treasury issuance, the size of primary surplus needed is smaller – but even in the Low scenario, a significant primary surplus is required for much of the next ten years.
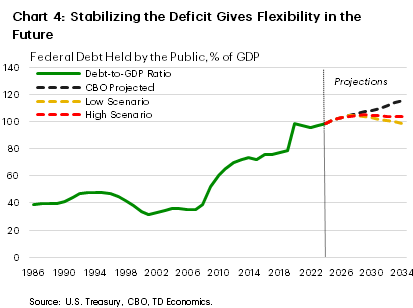
If this is not done, the debt-to-GDP ratio will continue expand along with the burden of interest payments. This poses a challenge in the medium-term as unexpected shocks and recessions become more likely over longer time horizons. Recessions have generally resulted in an unexpected increases in the deficit and debt. Both 2008 and 2020 saw sharp increases in the level of debt held by the public (Chart 4). If debt were to continue to expand and another crisis was to strike, the required adjustment will be even larger than it is today.
This is why economists generally recommended countercyclical fiscal policy – expanding deficits in recessions to support economic growth and ease the loss of welfare for households and businesses, but not during expansionary cycles, when debt should be held stable or decline in order to preserve fiscal space.
How to Get on a Sustainable Path
Averaging between the two scenarios, the federal government would require a primary surplus of 2% of GDP to stabilize the net interest share of GDP. The CBO projections have a primary deficit of about -2% of GDP over the next 10 years, meaning a swing of around 4% of GDP.
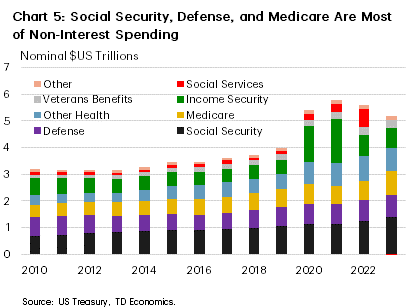
Achieving this entirely through spending cuts would be a challenge. CBO projections show the continued increase in the primary deficit is primarily due to expected growth in spending on Social Security and Medicare (Chart 5). This growth in non-interest spending is due mainly to a combination of population aging and the rising cost of healthcare, factors that are unlikely to be altered by changes in fiscal policy.
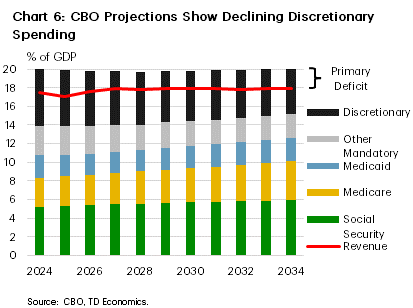
Historically, U.S. officials have been reluctant to enact cuts to Social Security, Medicare, or defense, but together, these three programs amount to about $3 trillion of the $5 trillion in non-interest outlays from the U.S. Treasury (Chart 6). If these programs are left untouched and taxes unchanged, what is left (discretionary spending) would have to be cut in half to put the deficit on sustainable track.
In other words, if cuts to Social Security, Medicare, and Medicaid are not politically feasible, some revenue increases must be a part of any effort to reduce the deficit. Exploring all revenue options and their impact on economic growth is beyond the scope of this report, but it does appear possible to achieve some or all the deficit reduction via higher taxes. The federal tax base (the sum of corporate profits, wages, and salaries) is expected to be around 53% of GDP for the next 10 years, while federal tax revenues remain below 18% of GDP, giving some scope to raise taxes as part of the deficit reduction.
Conclusions
U.S. government debt is likely to grow unsustainably over the next decades if current policies are not changed. With the recent rise in interest rates alongside continued deficits, the share of GDP devoted to debt payments is likely to breach anything seen historically within the next couple of years. With high debt levels and ongoing budget deficits, interest expense is being pushed into ever-expanding and unsustainable territory. To avoid this outcome, a politically challenging consolidation of the U.S. federal budget deficit will be needed in the next decade..
End Notes
- References to the Congressional Budget Office in this report generally refer to their Long-Term Budget Outlook: 2024 to 2054, published in March 2024. In their baseline budget and economic projections, the CBO assumes that current laws governing taxes and spending will generally remain unchanged. In practice, the CBO’s baseline assumes that spending programs for years where spending has yet to be authorized will match current years adjusted for inflation and subject to the legislated maximum on spending. In the next several years, the level of discretionary spending in the CBO baseline is constrained by those legislated maximums; in practice, the future U.S. Congress may set appropriations further below the legislated caps or may raise them. On the revenue side, changes to revenue which are legislated in the future are assumed to occur as legislated. This means, for example, that the portions of the 2017 personal income tax cuts which are currently legislated to expire at the end of 2025 are assumed to expire in the CBO’s projections. The impact of these and other assumptions is discussed in their recent report, Budgetary Outcomes Under Alternatives Assumptions About Spending Revenue.
- For example, in the Low scenario, nominal GDP growth of 4.5%, all else equal, would allow small budget deficits to persist over most of the next decade. While both stronger growth and smaller deficits than the CBO baseline is unlikely, we recognize that future economic developments that are favourable for growth would make managing U.S. fiscal challenges easier.
- There are many possible combinations of the annual deficit over the 10-year period that would produce this outcome. In selecting these paths, we calibrate so both the deviation from the baseline and the year-to-year changes are small so that the annual budget balance in the scenarios is relatively plausible. Alternative paths that have larger adjustments earlier would allow more flexibility for smaller surpluses or deficits later in the projection horizon.
Disclaimer
This report is provided by TD Economics. It is for informational and educational purposes only as of the date of writing, and may not be appropriate for other purposes. The views and opinions expressed may change at any time based on market or other conditions and may not come to pass. This material is not intended to be relied upon as investment advice or recommendations, does not constitute a solicitation to buy or sell securities and should not be considered specific legal, investment or tax advice. The report does not provide material information about the business and affairs of TD Bank Group and the members of TD Economics are not spokespersons for TD Bank Group with respect to its business and affairs. The information contained in this report has been drawn from sources believed to be reliable, but is not guaranteed to be accurate or complete. This report contains economic analysis and views, including about future economic and financial markets performance. These are based on certain assumptions and other factors, and are subject to inherent risks and uncertainties. The actual outcome may be materially different. The Toronto-Dominion Bank and its affiliates and related entities that comprise the TD Bank Group are not liable for any errors or omissions in the information, analysis or views contained in this report, or for any loss or damage suffered.
Download
Share: