Tariff Policy and Whiplash Weaken U.S. Growth Outlook
Beata Caranci, SVP & Chief Economist | 416-982-8067
Thomas Feltmate, Director & Senior Economist | 416-944-5730
Date Published: April 16, 2025
- Category:
- US
- Latest Research
- Forecasts
- Trade
Highlights
- The U.S. administration imposed a 90-day pause on reciprocal tariffs, dropping all countries (excluding China) to a flat 10% tariff. This comes in addition to the sectoral tariffs, including steel & aluminum and finished autos & parts.
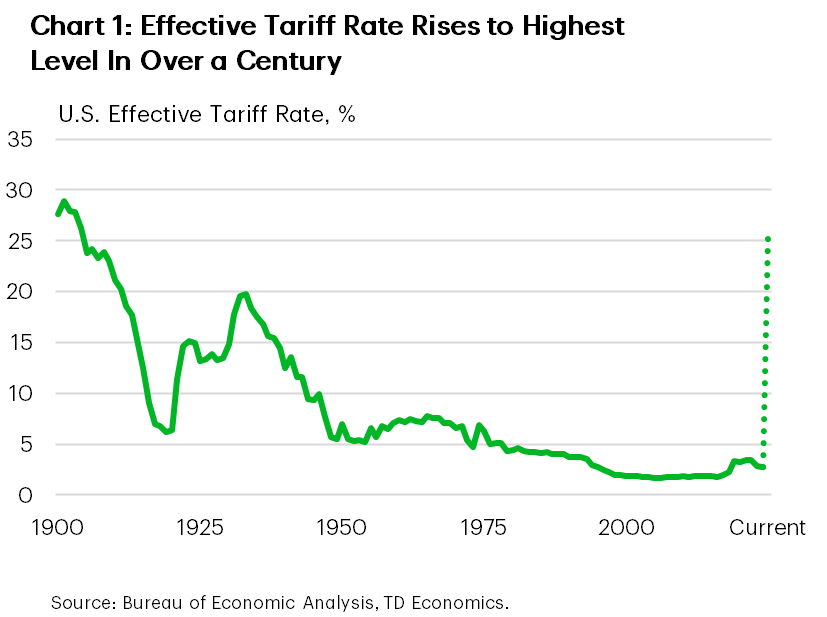
- We estimate the effective tariff rate in the U.S. to be 26%, the highest level in over a century. However, this is skewed by the outsized 145% tariff on China.
- Tariff announcements have been almost a daily occurrence, making it difficult to pin down assumptions let alone a forecast. In the current state, we estimate the U.S. will expand just 1.2% this year but the bands around the forecast are larger than normal.
- High and persistent uncertainty breeds recessions. While we still feel the U.S. economy can skirt a recession, risks to the outlook are increasingly tilted to the downside the longer it takes for the administration to provide a clear operating policy framework for businesses and households.
On April 9th, President Trump imposed a 90-day pause on the reciprocal tariffs announced on April 2nd. For the 85+ countries who were supposed to face punitive reciprocal tariffs effective at midnight on April 9th, the administration instead imposed a much smaller 10% universal tariff. This would come in addition to the sectoral tariffs (including the 25% steel & aluminum and 25% on finished foreign vehicles and parts) as well as the International Emergency Economic Powers Act (IEEPA) tariffs imposed on China, Mexico, and Canada. The one exception to the tariff reprieve was China, whose effective tariff rate was raised to 145% after a tit-for-tat spat with China’s retaliation response. In another U-turn, the administration announced some electronics imported from China, including smartphones, computers, and semiconductors, would be exempt from the 145% tariff, and instead face only the 20% IEEPA tariff. But the exemption is likely to prove only temporary, as a broader review under Section 232 for semiconductor tariffs is finalized in the coming months.
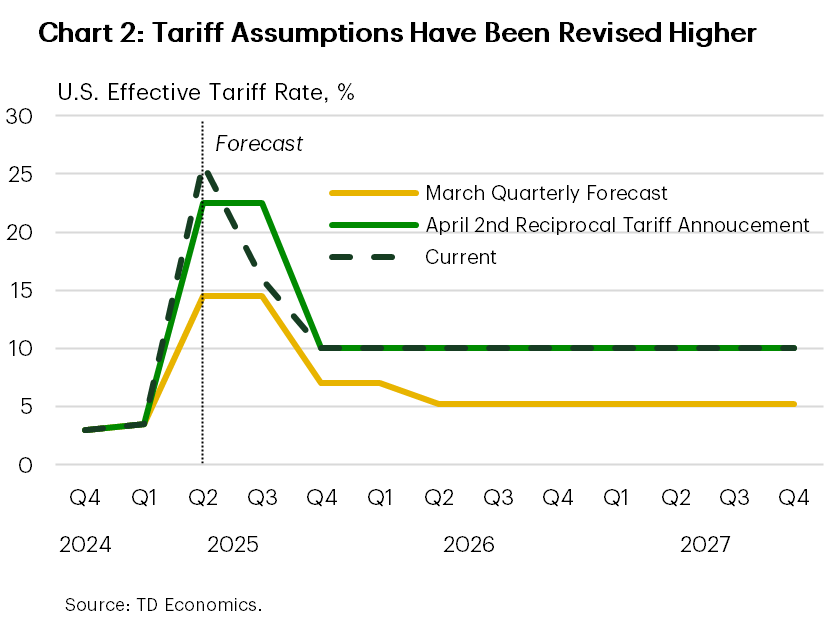
Based on 2024 trade flows, the announced tariffs to date imply an effective U.S. tariff rate of about 26%, or the highest level since 1903 (Chart 1). This is considerably above what was assumed in our March forecast, and even higher than the implied effective tariff rate following the April 2nd reciprocal tariff announcement (Chart 2). However, China’s outsized tariff is overwhelmingly skewing the effective rate higher, as it alone accounts for two-thirds of the weighted average, despite only accounting for roughly 13% of U.S. imports.
The escalation in trade tensions and the rising likelihood of an all-out U.S.-China trade war places the U.S. economy on a more precarious footing that would track about 1.2% real GDP growth this year, down from our prior forecast of 1.9%. However, point estimates in the current environment need to be taken with a massive grain of salt. The tariff landscape is shifting under our feet on an almost daily basis, with meaningful implications for both the growth and inflation outlook. While we still feel the U.S. economy can skirt a recession, the cushion of ‘white space’ between expansionary and contractionary territory is thinning.
Our revised forecast assumes some reprieve in today’s tariffs through the second half of this year. For China, some easing in tariffs could come even sooner should officials move quickly to de-escalate the situation. But even in the event that the administration ‘cuts deals’ with individual countries over the coming days/months, there needs to be convincing creditability behind the agreements. If tariffs continue to be the primary tool used to address all matters unfavorable to the U.S., it creates a challenging landscape for businesses to make long-term investment decisions – casting a much larger shadow over the outlook.
Tariff effects on the economy
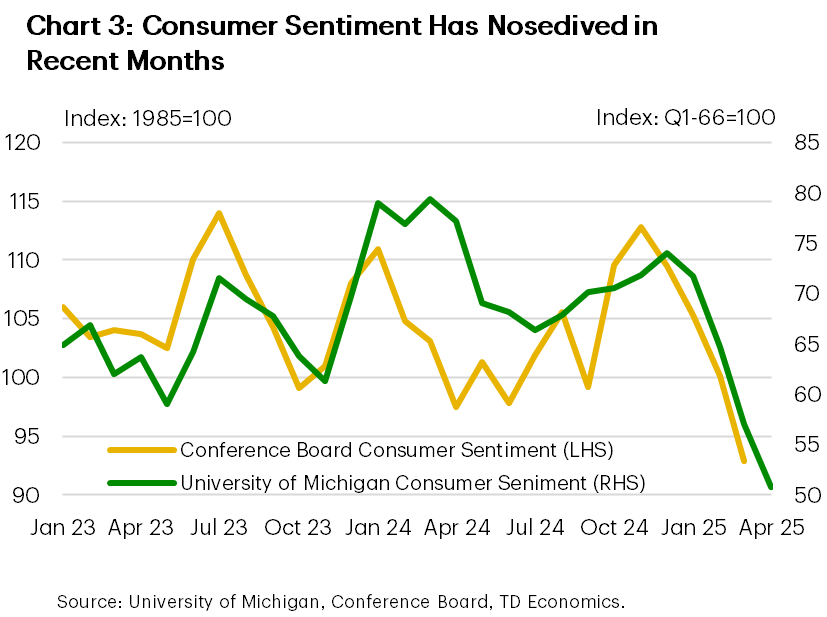
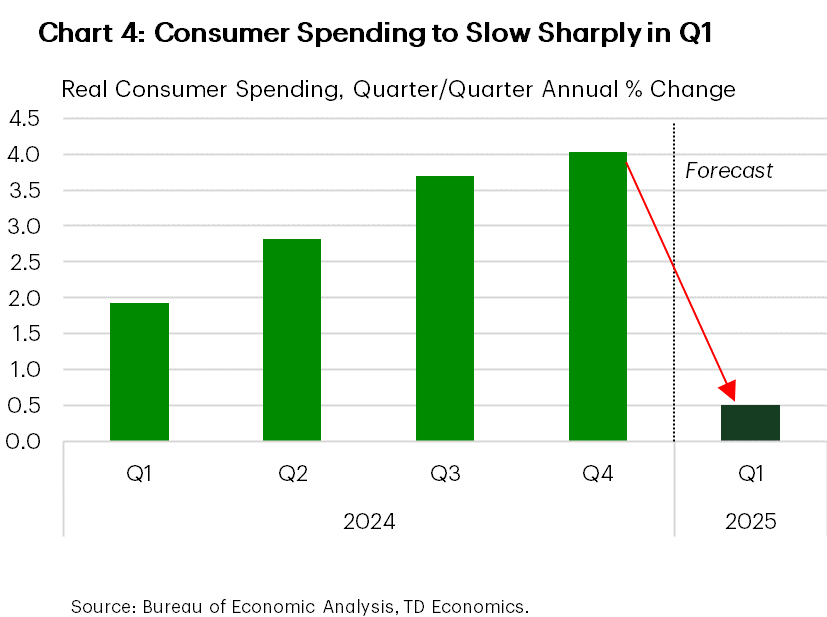
Tariffs will weigh on the economy through a few channels. The first is related to elevated uncertainty. Since the tariff talk heated-up in mid-February, U.S. equity indices are down 10-15%, the VIX briefly reached levels not seen since the pandemic, while corporate spreads have widened to multiyear highs. At the same time, measures of consumer sentiment have nosedived (Chart 3), with households becoming increasingly pessimistic on the future state of the economy as well as employment prospects. Expectations for future inflation have also shot higher. Heightened uncertainty tends to go hand-in-hand with belt tightening. Early reads of the hard economic data have shown that the uncertainty and recent losses in household net worth have already resulted in consumers tapping the breaks. Through the three months ending in February, inflation adjusted consumer spending has flatlined, after expanding by a robust 3.6% through H2-2024 – suggesting Q1 spending will slow sharply (Chart 4).
Beyond the uncertainty channel, the implementation of the tariffs will also result in a significant erosion in household purchasing power. Based on the rates announced to date, we estimate that the average household could see their cost-of-living increase by approximately $3,600 . This is meaningful, particularly coming atop already elevated price levels. And unlike the post-pandemic bout of inflation, we suspect that the labor market will be on a much softer footing this time around – with modest job losses expected in Q2/Q3. This means that wage gains are likely to be far more subdued, limiting households’ ability to absorb the price shock.
Further tax cuts – beyond extending the 2017 Tax Cuts & Jobs Act – could help to cushion the blow. But even if we were to see a full implementation of President Trump’s promised tax cuts (including exempting social security payments, overtime pay, and tips from taxation), we estimate that it would lift household’s income by around $2,700. This is $900 short of offsetting the tax hike from tariffs, leaving the average household worse off.
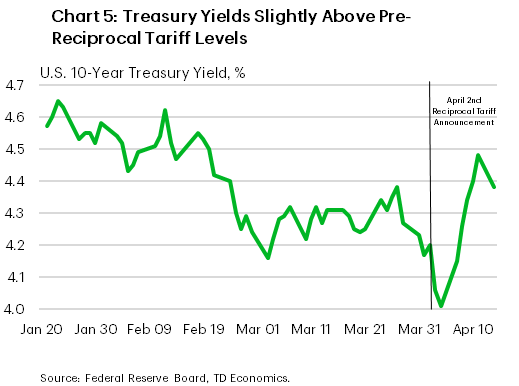
Lastly, there’s the impact from tighter financial conditions. Treasury yields have been on wild ride since the April 2nd reciprocal tariff announcement. After having briefly dipped below 4% intraday on April 4th, the 10-year Treasury has since recoiled to 4.3%, or roughly 10 bps above its April 2nd level (Chart 5). More importantly is what’s happening with corporate spreads – the premium corporations pay to borrow. Both investment and non-investment grade spreads have widened to levels not seen since the regional banking crisis in 2023. Higher borrowing costs plus the heightened uncertainty mean that many investment projects are likely to be sidelined over the near-term. And even with mortgage spreads at their lowest level since mid-2022, the level of 30-year fixed mortgage rates is at an elevated 7.0%. With the labor market expected to weaken, lumber tariffs likely to pressure new home prices higher and elevated rates to keep a lid on listings, hope for a rebound in the housing sector this year is dimming.
Tariffs are already muddying the water…
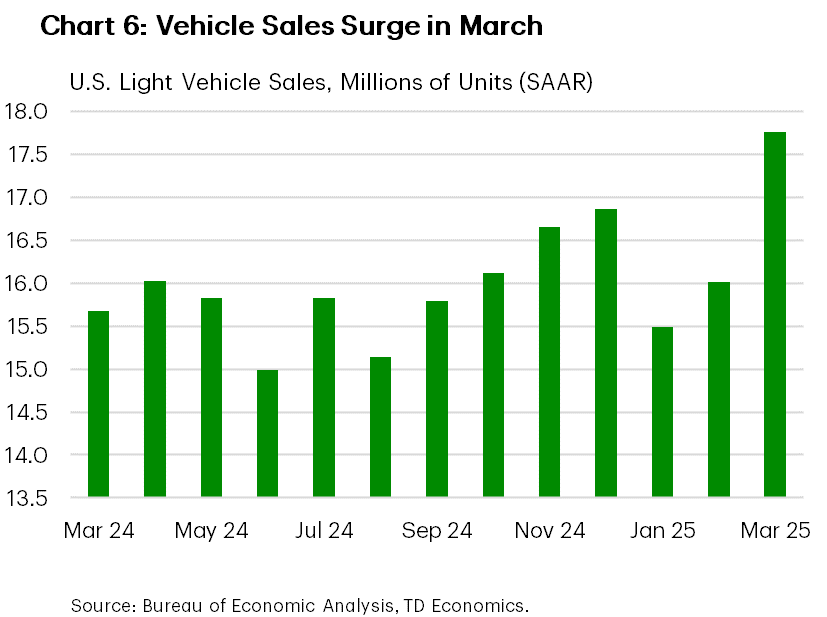
As it currently stands, first quarter GDP (released on April 30th) is likely to come with plenty of tariff distortions. Trade data released through February has already shown that companies have been front running the tariffs, leading to a surge in imports. Exports have also picked up, but not to same degree, suggesting net trade could shave nearly 3 percentage points from Q1 GDP. Some of those imports will show up in inventories, providing some offset. At the same time, consumers and businesses pulled forward vehicle purchases into March to get ahead of the auto levies (Chart 6). President Trump first started talking about tariffing foreign autos in mid-March but didn’t sign the executive order until March 27th (effective April 3rd, 2025). Anecdotally, dealerships appear to be pricing existing inventory at “pre-tariff” prices – suggesting March’s pull through in sales could persist for as long as the remaining inventory lasts. But given the slim margins that manufacturers are facing, it’s likely that most of the tariff costs on new inventory will be quickly passed onto the consumer – potentially adding anywhere from $5,000-$10,000 to the purchase price, depending on the make and model. Should foreign manufacturers shift more production to the U.S. over the medium term, it’s likely that they’ll prioritize only the more profitable models, ultimately narrowing consumer selection.
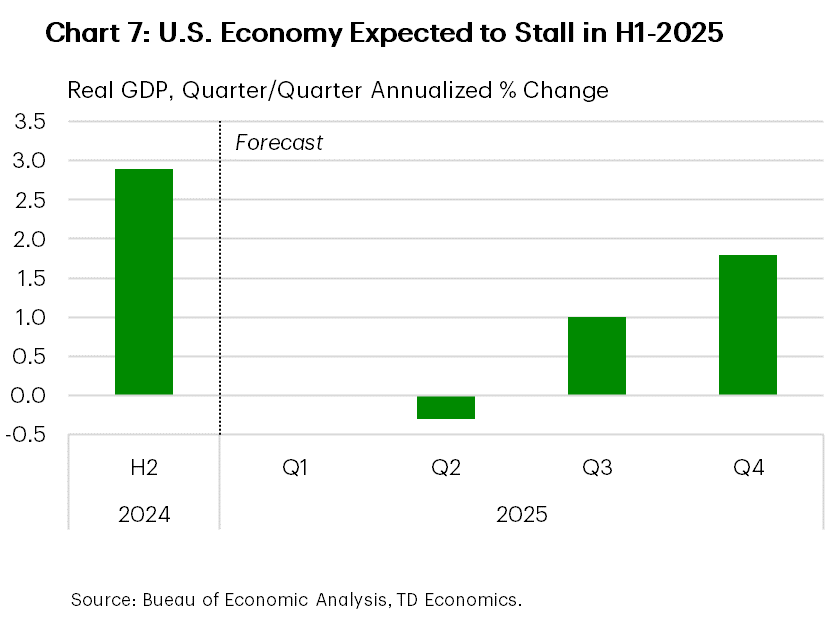
All told, we expect GDP to stall through the first half this year before turning modestly higher in H2-2025, but still averaging a below trend pace of just 1.0% annualized (Chart 7). While our forecast assumes the U.S. economy skirts a recession, we acknowledge that the risks are becoming increasingly skewed to the downside. But even if the economy does slip into a recession, we remain of the view that it’s likely to be shallow. Even with the recent dive in stock valuations, household balance sheets remain in a decent position as does the debt-to-income ratio. Moreover, because of increased labor scarcity, employers are likely to retain a higher percentage of its workforce relative to prior downturns – helping to limit job losses and allowing households to weather the storm.
… and will lead to higher inflation
Under our updated forecast, the twelve-month change on core PCE inflation is expected to rise from its current pace of 2.8% to somewhere in the 3-4% range by as early as the Q2. If inflation were to hit the upper end of that range, it would imply a quarterly increase of 7.5% (annualized!) in Q2. The single largest quarterly gain post-pandemic was in Q1-2022, when core PCE inflation increased 6.1%. In order to get there, we’d likely need to see all the announced tariff policies to date remain in effect through the remainder of this quarter and a swift passthrough of the tariffs to the end consumer. Should we see further exemptions, or countries move more quickly to negotiate trades deals, there’s potential for a more subdued inflation shock towards the lower end of the estimated range.
But the one thing macroeconomic models can’t reliably capture is the impact of supply chain disruptions and the associated passthrough they can have on inflation. Both China and Europe have been kicking the tires on alternative retaliatory measures beyond imposing tariffs on U.S. imports. One such proposal from China has been to impose export controls on vital raw inputs used by U.S. firms. While these types of retaliatory measures are not currently captured in the baseline forecast, they offer an additional source of risk to the inflation outlook.
Fed stuck between a rock and a hard place
No matter which way you slice it, the global scope and magnitude of tariffs lead to a marking up of inflation forecasts, but it’s the persistence of the shock that ultimately matters for the Fed’s reaction function. Recent communication from Fed officials suggests that the sharp increase in inflation expectations and larger-than-expected tariffs have the FOMC more concerned about lasting impacts to inflation. In March, Chair Powell characterized the inflation shock as a one-time price increase and he largely discounted the uptick in inflation expectations. But since then, Powell’s tone has become more hawkish, noting the continued increase in inflation expectations as “becoming a concern”. We surmise that the Fed may be willing to tolerate some softening in the economy to ensure the current policy rate remains sufficiently restrictive to combat the expected increase in inflation.
Should some of the announced tariffs start to come off in the third quarter under bilateral deals between countries, the quarterly profile on inflation should slow sharply. This will likely be met by a modest increase in the unemployment rate, which supports a September rate cut. But with Fed officials characterizing today’s policy rate as only “somewhat” restrictive, and with considerable uncertainty on the neutral rate, there won’t be any rush to quickly normalize the policy rate in the absence of a collapse in inflationary pressures. Policymakers are likely to follow a more gradual approach into year-end.
Disclaimer
This report is provided by TD Economics. It is for informational and educational purposes only as of the date of writing, and may not be appropriate for other purposes. The views and opinions expressed may change at any time based on market or other conditions and may not come to pass. This material is not intended to be relied upon as investment advice or recommendations, does not constitute a solicitation to buy or sell securities and should not be considered specific legal, investment or tax advice. The report does not provide material information about the business and affairs of TD Bank Group and the members of TD Economics are not spokespersons for TD Bank Group with respect to its business and affairs. The information contained in this report has been drawn from sources believed to be reliable, but is not guaranteed to be accurate or complete. This report contains economic analysis and views, including about future economic and financial markets performance. These are based on certain assumptions and other factors, and are subject to inherent risks and uncertainties. The actual outcome may be materially different. The Toronto-Dominion Bank and its affiliates and related entities that comprise the TD Bank Group are not liable for any errors or omissions in the information, analysis or views contained in this report, or for any loss or damage suffered.
Download
Share: