‘Supercore’ Inflation
Connecting the Dots to the Labor Market
Thomas Feltmate, Director & Senior Economist | 416-944-5730
Date Published: April 27, 2023
- Category:
- US
- Financial Markets
Highlights
- Non-housing service inflation (aka ‘supercore’) has become an area of particular focus for policymakers in recent months. At just over 50%, supercore accounts for a sizeable chunk of core PCE inflation – the Fed’s preferred inflation measure.
- Because most categories included in supercore are labor-intensive sectors, this component of inflation is very closely tied to underlying labor market dynamics. With wage growth still hovering roughly 2 percentage points above what is consistent with 2% inflation, supercore continues to run north of 5% (annualized) – roughly double the pace observed in the two-year period preceding the pandemic.
- While cracks in the labor market are starting to emerge, it will take some time for cooling wage pressures to pass through to slower price growth. As a result, we don’t expect core PCE to return to 2% until the end of next year.
Inflation has been a hot topic for two years now. Many have become acquainted with the difference between headline and core inflation, with the latter stripping out the volatile food and energy components. However, over the past six months, an even narrower measure, dubbed ‘supercore’ inflation has become an area of particular focus for policymakers. Economists have long cut inflation different ways, but what’s so heroic about this measure and why have Fed officials honed in on it in recent months?
The 3 Key Inflation Threads
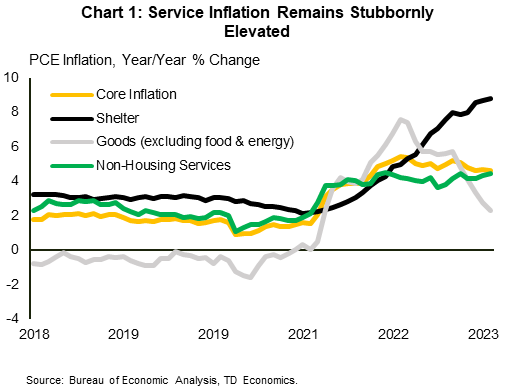
The three main cross-sections of inflation getting the most attention of late are core goods, shelter, and non-housing related services. These three sub-baskets have experienced diverging patterns through much of last year (Chart 1).
Core goods – which includes all consumer goods except food and energy – were the initial catalyst sending inflation higher back in early-2021, as strong consumer demand coupled with snarled-up supply-chains led to a rapid acceleration in goods prices. At its peak, core goods had accelerated by roughly 8% (annualized) and was contributing over 2 percentage points – or nearly 40% of the annualized increase – to core PCE inflation. However, since early-2022, gains in goods prices have slowed, and for a brief period late last year, had become a source of deflation. The reasons for the improvement are two-fold. With COVID restrictions long in the rear-view mirror, consumer spending patterns have started to normalize, with increasingly more of household’s purchases shifting back towards service-related consumption. This has happened at a time when global supply-chains have improved, creating a dual downward force on goods prices.
The same can’t be said for the shelter component of inflation. According to the most recent reading on PCE inflation, housing related costs were up 8.8% year-over-year (y/y) and continue to show near-term strength as its pace over the last three months (annualized) nearly matches the twelve-month change. Fortunately, we have already started to see both market-based rent measures cool and home prices ease from their pandemic highs. The bad news is changes in today’s rental and home prices take time to actually show up in the inflation data, as it’s the change in the overall stock of rental agreements or in the case of homeownership, owners’ equivalent rent, that is captured by the inflation measurement. This suggests that we’re unlikely to see a disinflationary impulse from housing until the second half of this year. This is meaningful, as housing costs account for anywhere from 19% to 43% of core inflation – depending on the inflation metric – so policymakers will look through its near-term contributions as they try to fine-tune the tightening cycle.
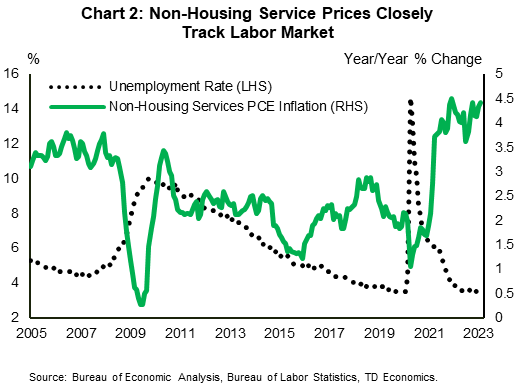
Enter non-housing services or the more recently touted ‘supercore’ inflation. This is the component of inflation that includes mainly labor-intensive service sectors such as haircuts, cleaning services, childcare, and gym memberships (Chart 2). To be more exact, in the Fed’s preferred PCE measure of inflation, the Bureau of Economic Analysis breaks down non-housing service consumption into six major components: healthcare, transportation, recreation, food & accommodation, financial, and other services. Using the PCE inflation data, non-housing services account for roughly 50% of core PCE inflation. However, this likely overstates its true weighting, as costs associated with medical services – less tied to the business cycle – account for roughly a third of that weighting. If that were excluded, the true “cyclical” component of inflation falls to a still significant one-third of core PCE inflation. For the purposes of this paper, and to be consistent with Fed’s recent messaging, medical is assumed to be included in our definition of ‘supercore’.
Price growth across non-housing services has remained exceptionally strong in recent months, with the three-month annualized change accelerating to 5.0% in February. Digging deeper into the data shows that gains have been led by transportation, recreation, and food & accommodation – all of which are running north of 8% (annualized) over the last three months – though price growth across financial and other services has also remained hot (Table 1).
Table 1: Non-Housing Services By Category (3-Month % Annualized Change)
Table 1 shows price growth (measured as the three-month annualized change) across the six major components of supercore inflation. As of February 2023, price growth across all categories with the exception of health care remain well above their respective 2018/19 averages. In February, the largest gains came from transportation (+14.9%), through recreation and food & accommodation are also growing well above 8%.
| 2018/19 Average | Sep-22 | Oct-22 | Nov-22 | Dec-22 | Jan-23 | Feb-23 | |
| Health Care | 1.9 | 1.9 | 2.4 | 2.1 | 2.0 | 0.6 | 1.3 |
| Transportation | 2.2 | 6.3 | 18.5 | 5.5 | 7.0 | 6.8 | 14.9 |
| Recreation | 2.2 | 1.5 | 1.7 | 7.2 | 9.4 | 9.8 | 8.9 |
| Food & Accommodation | 2.4 | 5.2 | 9.6 | 8.3 | 8.6 | 6.3 | 8.0 |
| Financial Services & Insurance | 3.7 | 1.7 | 5.0 | 4.1 | 3.8 | 8.4 | 5.8 |
| Other Services | 1.9 | 3.0 | 3.1 | 4.9 | 3.3 | 4.3 | 3.4 |
Strong Labor Market = Strong Supercore
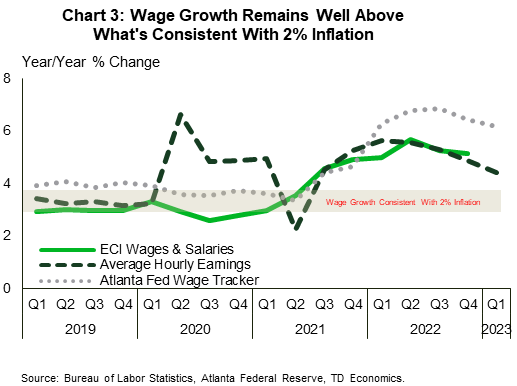
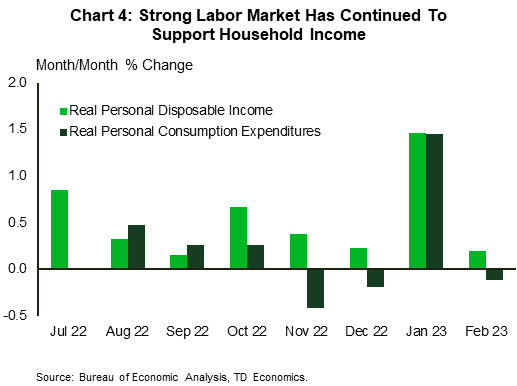
The Fed is focused on the supercore inflation measure because these categories are most heavily influenced by demand in the domestic economy, are generally more labor-intensive sectors, and are less affected by global supply chain issues (as seen in Chart 2). Because the labor market remains incredibly tight, wage pressures remain elevated. This is evident across a spectrum of wage measures, including the Employment Cost Index, average hourly earnings, and the Atlanta Fed’s wage tracker, all of which continue to show wage growth running anywhere from 1-2 percentage points above what is consistent with 2% inflation. (Chart 3). From the Fed’s perspective, this has complicated their fight against inflation. In more recent months, persistently higher wage growth has more than offset the loss of purchasing power that households have faced from multidecade high inflation. This has resulted in real disposable income showing positive gains in each of the last eight consecutive months and helped sustain an above trend pace of consumer spending – in turn fueling more inflationary pressures (Chart 4). It is clear that all roads to easing inflation necessitate some rebalancing in the labor market.
Cracks Starting to Show
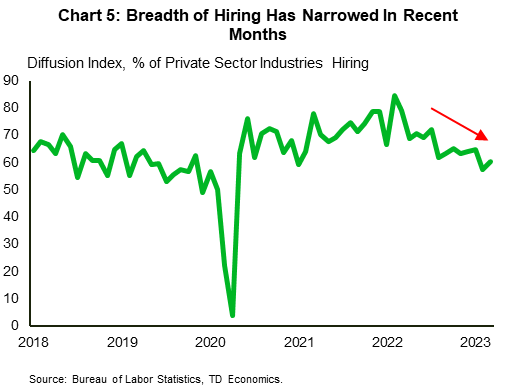
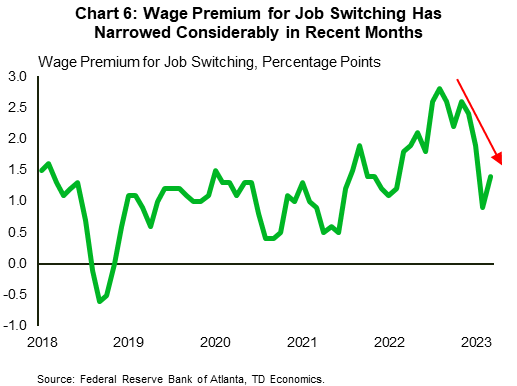
In an absolute sense, the labor market still appears incredibly strong. However, some cracks are starting to emerge. Weekly jobless claims have edged higher through this year, while multiple business surveys are showing hiring intentions drifting lower. And this decline in sentiment has started to creep into recent employment readings. The breadth of hiring has narrowed considerably over the last few months, with just 60% of private sector industries hiring in March – well below March 2022’s share of 79% (Chart 5). Moreover, nearly two-thirds of the private sector job gains last month were concentrated in just two industries: leisure & hospitality and healthcare. We’re also starting to see worker confidence recede. The quit rate has been gradually edging lower over the past year – though it still remains above pre-pandemic levels – leading to a narrowing in the wage differential between job switchers and job seekers (Chart 6). At the same time, job openings have broken below 10 million in February, falling to 9.9 million, which is the lowest reading in 22 months.
This is not to say the bottom will suddenly fall out from underneath the labor market. In fact, history has shown that the labor market is very slow to react to rising interest rates. Looking over past tightening cycles dating back to the early-1970s suggests it takes around 12 months from when the Fed begins raising rates to when the unemployment rate even reaches its cyclical low. If January’s 3.4% reading stands at this cycle’s low, that would suggest things are staying relatively true to the historical timeline. From there, it takes another 10-12 months for the unemployment rate to rise by even 0.5%-pts, which in today’s environment, would only get it back around its long-run average of 4% by the end of this year.
Arguably, this is not enough of a reduction in hiring to restore balance in the labor market. Historical estimates of the Beveridge Curve – the relationship between unemployment and job openings – would suggest a larger increase in the unemployment rate, likely somewhere in the 1-2%-pts range would be required to better realign labor demand to current supply. However, these estimates don’t account for the fact that there’s been significant innovation over the last few decades in how job postings are advertised. Today, there’s little cost or effort required to post a job. And because labor supply has been constrained this cycle, there are likely many instances where employers have kept postings up, despite no longer actively recruiting for that position. From that perspective, it would argue an increase on the lower end of the suggested range could be all that’s required to restore better balance.
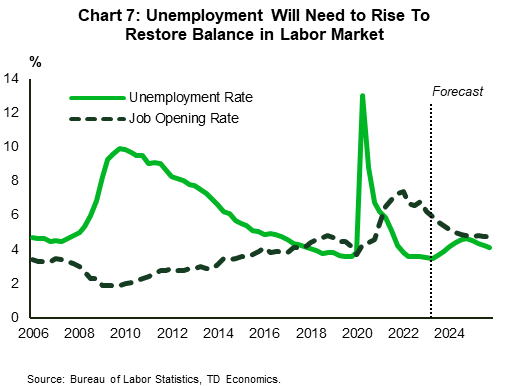
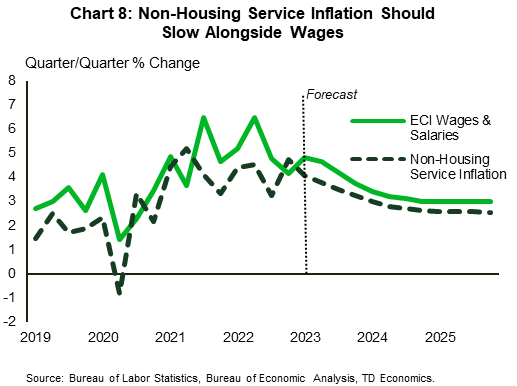
Our forecast assumes the unemployment rate will rise by 1.2%-pts by the end of next year. This would drive the job opening rate back down to something closer to its pre-pandemic level and put downward pressure on wage growth, albeit with a lag (Chart 7). Our analysis shows it can take anywhere from 9-12 months for easing labor demand to manifest in any noticeable downward pressure on wages. With job openings having crested in early-2022 and drifted lower ever since, we are only now starting to see some downward pull to wage growth. This has been most notable in average hourly earnings, where the 12-month change has fallen to a 21-month low of just 4.2% in March. This cooling in wage growth should intensify through the latter half of the year helping to moderate consumer demand and drag non-housing service inflation lower. Under this framework, supercore inflation would fall from its current three-month annualized rate of change of 5% to just 3% by year-end and return to 2.5% by mid-2025 (Chart 8). This is a pace of growth in non-housing service inflation that is more consistent with a balanced labor market.
Under this scenario, it is also assumed that core goods prices show further deflationary pressures through the latter half of this year into 2024, while shelter prices start to decelerate in the second half of this year. This combination of forces leads to a noticeable deceleration in core PCE – reaching 2.7% q/q (annualized) by year-end and returning to 2% by Q4-2024.
What if the Labor Market Proves More Resilient?
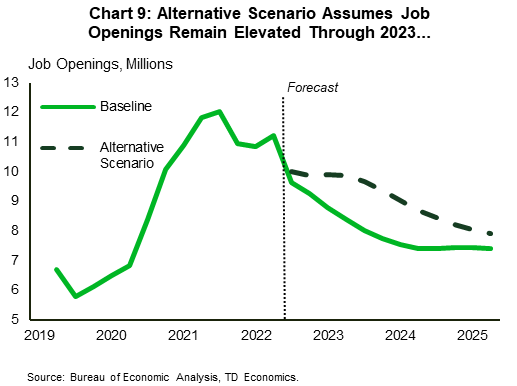
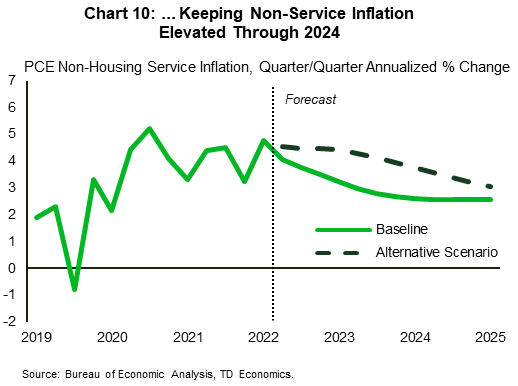
By all accounts, the labor market is already showing signs of cooling. However, we’ve already been thrown multiple head-fakes through this tightening cycle, so it’s a fair question to ask. Under an alternative scenario, let’s assume that job openings remain elevated at today’s level of 9.9 million through the remainder of this year, with a more meaningful cooling in labor demand not taking hold until early-2024 (Chart 9). For simplicity, let’s also assume that the Fed doesn’t react to the labor market resilience by tightening any more than what’s assumed in our baseline – a terminal rate of 5.25% is reached by Q2-2023 and remains there through 2023. Under this scenario, wage growth doesn’t start to cool until Q2-2024, keeping non-service housing inflation elevated through this year, with only some modest deceleration through 2024 and still remaining above its pre-pandemic average through 2025 (Chart 10). Even under a more optimistic scenario where we maintain the same baseline contours for shelter and goods prices, core PCE doesn’t return to 2% until sometime in 2026.
Indeed, the above example is an overly simplified and highly unlikely scenario. Given the FOMC’s unwavering commitment to return price stability, the odds that policymakers sit idle in an environment where labor demand remains historically elevated are slim to none. A more probable outcome is that the FOMC is forced to take a more aggressive stance on the policy rate – pushing it to at least 6% over the near-term – which significantly increases the risk of overtightening and tipping the economy into a recession.
Time is of the Essence
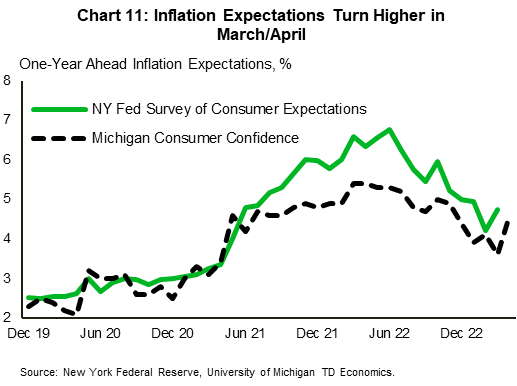
From that perspective, time is of the essence. The longer inflation remains elevated, the greater the risk that inflation expectations become entrenched at a higher level – leading to the dreaded wage-inflation spiral. Overall, inflation expectations have remained relatively well anchored. However, recent readings from both the Survey of Consumer Expectations and the University of Michigan have shown a notable uptick in one-year ahead inflation expectations in March and April, respectively (Chart 11). While one data point does not make a trend, it bears close watching given the still elevated level of inflation and the inherent lags between a cooling labor market and subsequent easing in inflationary pressures. For that reason, we believe the FOMC will remain in tightening mode over the near-term and raise the policy rate by 25 basis points one more time before pausing to assess the cumulative effect of its year-long tightening cycle.
Disclaimer
This report is provided by TD Economics. It is for informational and educational purposes only as of the date of writing, and may not be appropriate for other purposes. The views and opinions expressed may change at any time based on market or other conditions and may not come to pass. This material is not intended to be relied upon as investment advice or recommendations, does not constitute a solicitation to buy or sell securities and should not be considered specific legal, investment or tax advice. The report does not provide material information about the business and affairs of TD Bank Group and the members of TD Economics are not spokespersons for TD Bank Group with respect to its business and affairs. The information contained in this report has been drawn from sources believed to be reliable, but is not guaranteed to be accurate or complete. This report contains economic analysis and views, including about future economic and financial markets performance. These are based on certain assumptions and other factors, and are subject to inherent risks and uncertainties. The actual outcome may be materially different. The Toronto-Dominion Bank and its affiliates and related entities that comprise the TD Bank Group are not liable for any errors or omissions in the information, analysis or views contained in this report, or for any loss or damage suffered.
Download
Share: