Highlights
- The U.S. trade deficit has remained broadly unchanged over the past year, but only because temporary commodity export tailwinds have offset a stronger increase in AI-related imports.
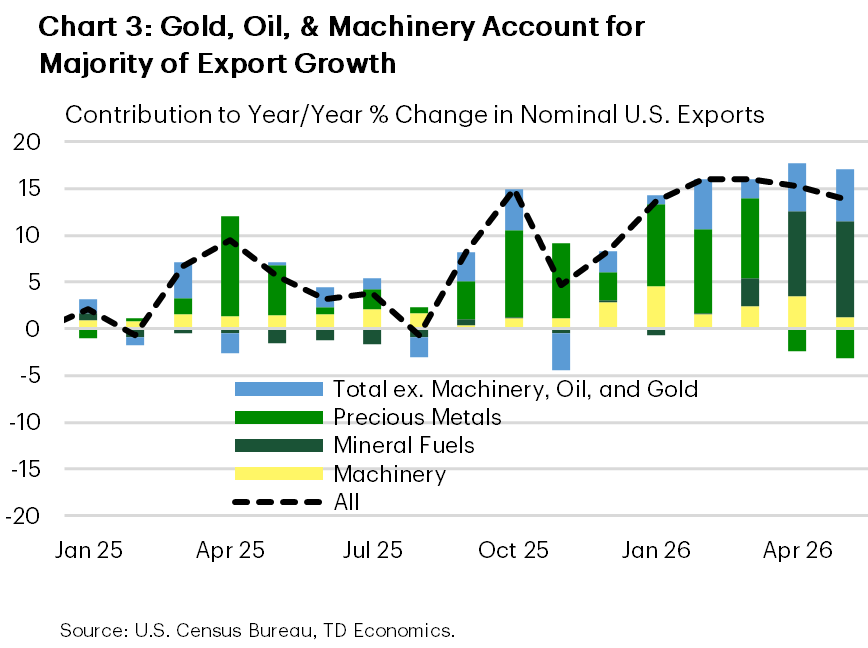
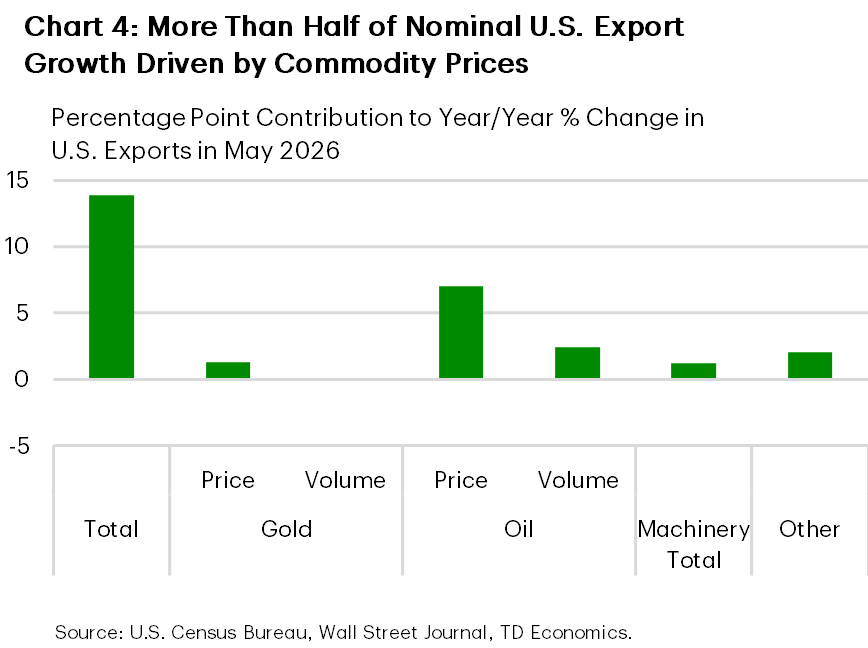
- Gold and oil have accounted for roughly two-thirds of export growth over the past year, though support from higher commodity prices appears likely to continue to fade.
- The AI infrastructure buildout is driving a surge in imports of advanced computing equipment and could place renewed upward pressure on the trade deficit over time.
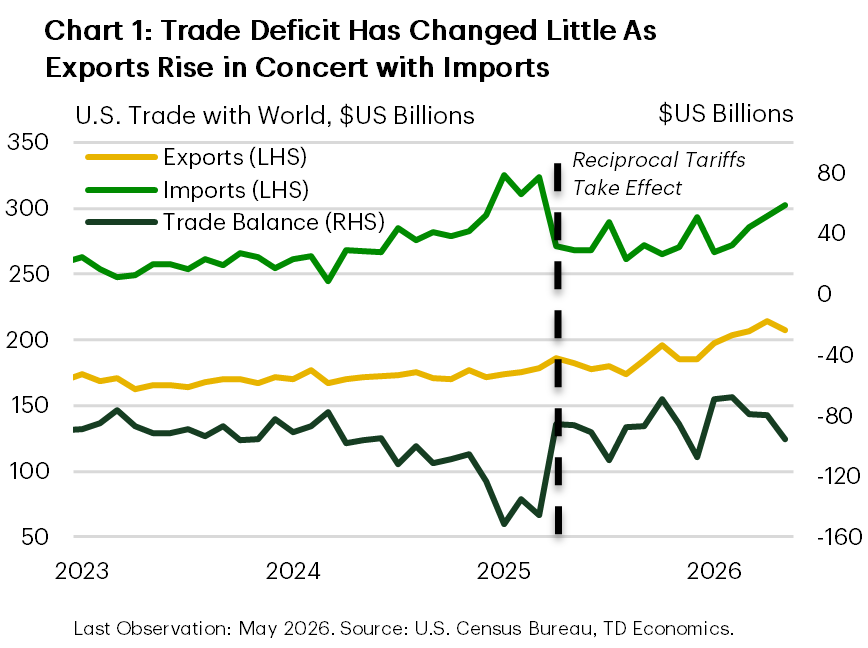
U.S. trade has seen notable growth over the past year, with exports and imports both up 13-14% year-on-year in May (Chart 1). This may sound counterintuitive given the protectionist stance of trade policy under the current administration, but the sectors driving these trends have been subject to specific demand shocks. In the case of exports, higher global demand for commodities, like gold and oil, and rising prices for these goods has benefitted the U.S. However, this has not led to a lower trade deficit for the U.S. because imports are being driven higher by domestic demand for AI-related goods.
Cumulatively, the trade deficit remains largely unchanged relative to the end of 2024, but this is the byproduct of notable offsetting trends in different goods categories. Moving forward, emerging trends suggest existing support for exports is waning, while support for imports via AI-related demand appears more durable. This suggests that the trade deficit may widen if offsetting trends do not emerge.
Liquid & Physical Gold Bolstering Exports
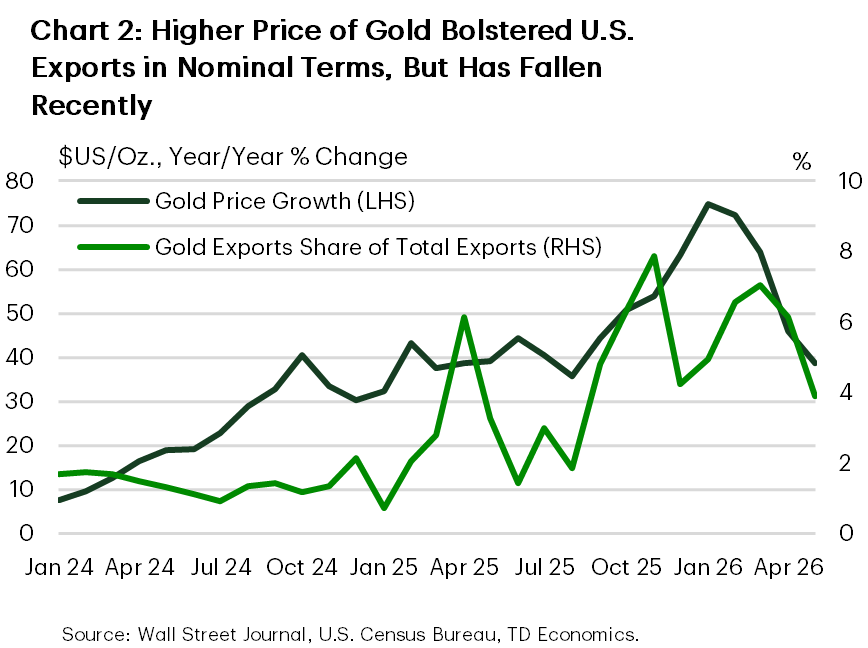
Throughout 2025, global demand for gold rose materially, but also sporadically, as heightened trade uncertainty, falling real interest rates, central bank reserve diversification, and market euphoria cumulatively pushed prices to an all-time high. Although U.S. exports of gold typically account for a small share of total exports (~2%), higher export volumes combined with the roughly 70% increase in gold prices last year pushed the metal’s share of total exports to 6-8% (Chart 2). These exports were primarily routed to global financial capitals in the U.K. and Switzerland. While gold prices have retreated over the past few months, they are still roughly 20% higher year-on-year and continue to influence U.S. export data, but to a lesser extent than last year.
For total exports, growth remains strong in 2026, but the driving influence has shifted towards gold of the liquid variety – metaphorically speaking that is (Chart 3). Crude oil exports in May were 105% higher year-on-year. Higher prices accounted for roughly three-quarters of the year-on-year increase in oil exports, but volumes have also increased. The increase was likely supported by releases from the U.S. Strategic Petroleum Reserve (SPR), alongside stronger export demand. Given that the release is expected to be completed by mid-July, and oil prices have since returned close to their pre-conflict level – removing the price influence on exports and reducing the incentive for higher domestic production – support for U.S. oil exports is likely to wane relative to current levels through the rest of the year.
Cumulatively, higher gold and oil prices have contributed 60% of the year-on-year growth in U.S. exports (Chart 4). When higher export volumes in each of these products are included the share rises to two-thirds. Of the remaining contributors to the year-on-year increase in exports, technology is the largest category.
On the surface, this seems like a positive development, as it would likely have stronger foundations tied to the boom in AI as opposed to the fluctuations in global commodity prices. However, looking under the hood, the trend of higher tech exports has been solely driven by higher re-exports to Mexico (Chart 5). Re-exports, sometimes referred to as foreign exports, are goods that are imported to one country and exported to another without being materially changed. This means that there is little economic value created by these exports, as the U.S. is primarily serving as a distribution hub for these products.
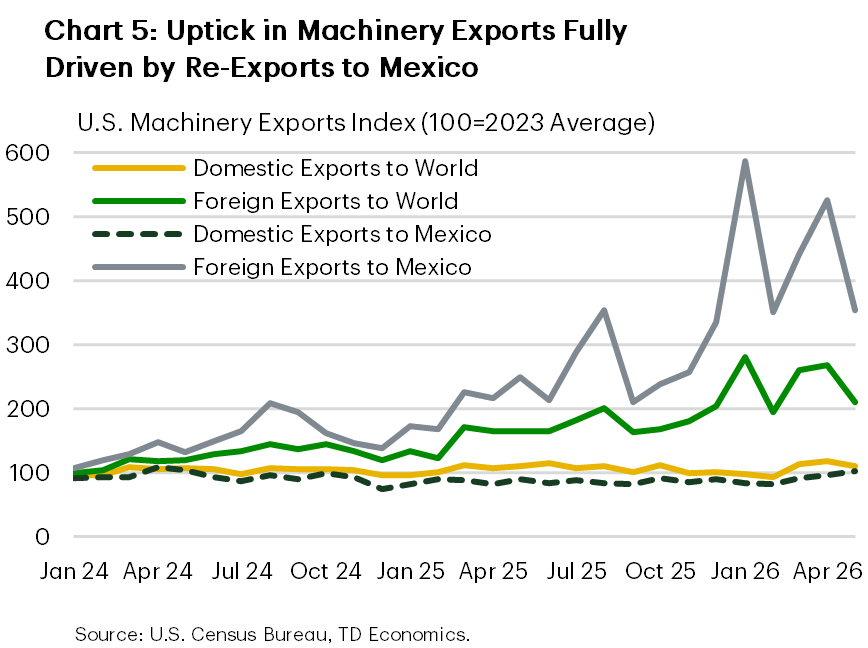
This development is largely a function of the voracious demand for computational hardware currently occurring in the U.S. related to the buildout of AI infrastructure. While this led to a partial impact on export activity via re-exports, it is tied to the significant uptick in imports of these products.
AI Boom Reshaping U.S. Import Profile
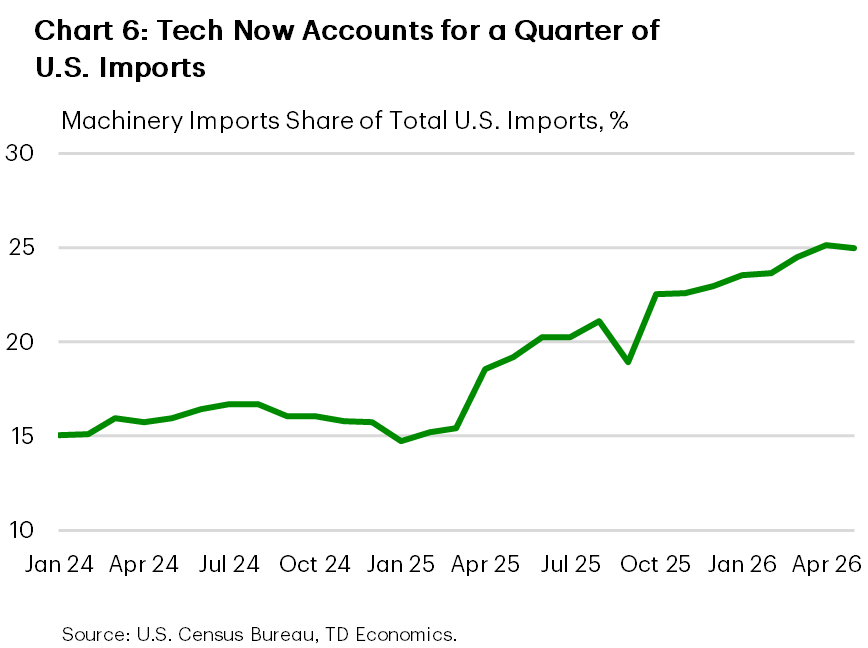
To say that the boom in demand for AI hardware is the driving force behind recent developments in U.S. imports would be a significant understatement. Over the past year, the share of U.S. imports accounted for by machinery, the category which includes AI hardware, rose from roughly 15% to 25% (Chart 6). Most other import categories saw declining inflows over the past year under the implementation of global tariffs, but strong demand for AI hardware provided a material offset.
The products driving this increase are concentrated in advanced computing and data-processing equipment categories associated with the ongoing buildout of AI infrastructure. These goods include servers, storage systems, networking equipment, and other automatic data-processing equipment used in AI data centers and high-performance computing applications. As hyperscalers and other firms have accelerated investments in AI-related computing capacity, imports of these products have risen sharply.
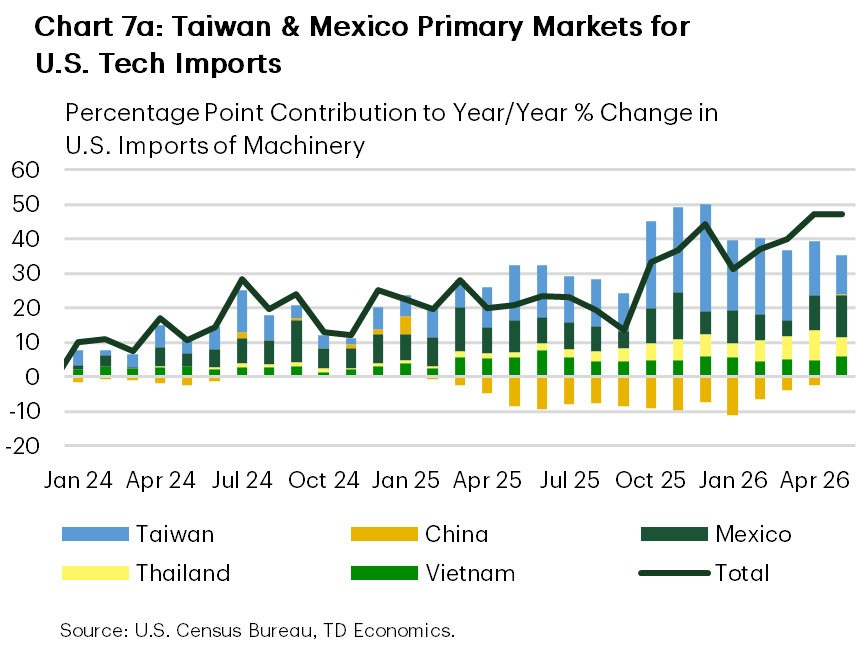
Geographically, U.S. imports of these products have primarily flowed from Taiwan and Mexico (Chart 7a), with smaller allocations coming from Vietnam and Thailand. Taiwan remains the dominant supplier of advanced computing hardware, while Mexico’s growing role reflects its increasing importance within North American technology supply chains. Some of this shift was likely driven by supply chain diversification away from China amid elevated trade tensions last year, as reflected by the decline in imports from China. However, growth in technology imports from Taiwan and Mexico has far exceeded the decline from China, suggesting that these developments reflect substantial net new demand rather than a simple reallocation of existing trade flows.
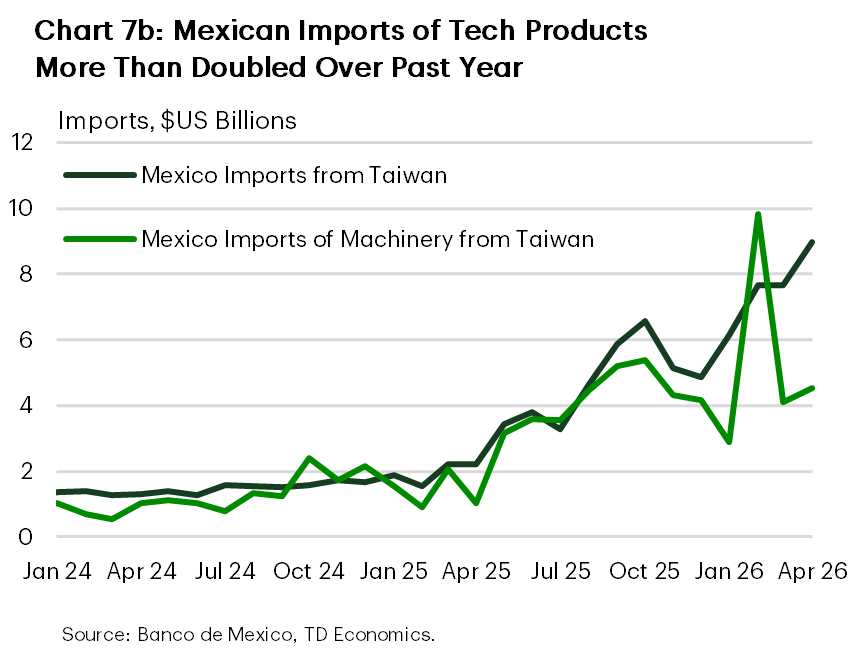
The case of rising imports from Mexico is interesting for several reasons. First, it appears to be occurring alongside an uptick in re-exports from the U.S. to Mexico, reflecting the integration of the regional market and Mexico’s growing role in technology manufacturing. This near-shoring trend began nearly a decade ago amid rising trade tensions with China, as businesses sought to insulate their supply chains. Second, Taiwanese technology exports to Mexico accelerated materially in 2025 (Chart 7b). Although this acceleration coincided with the rollout of reciprocal tariffs in April 2025, the relevant product categories were exempted shortly afterward, making tariff avoidance an unlikely explanation. Rather than creating a new trade corridor, heightened trade uncertainty appears to have reinforced an existing near-shoring trend, as businesses increasingly sought the predictability afforded by North American production networks and the USMCA framework.
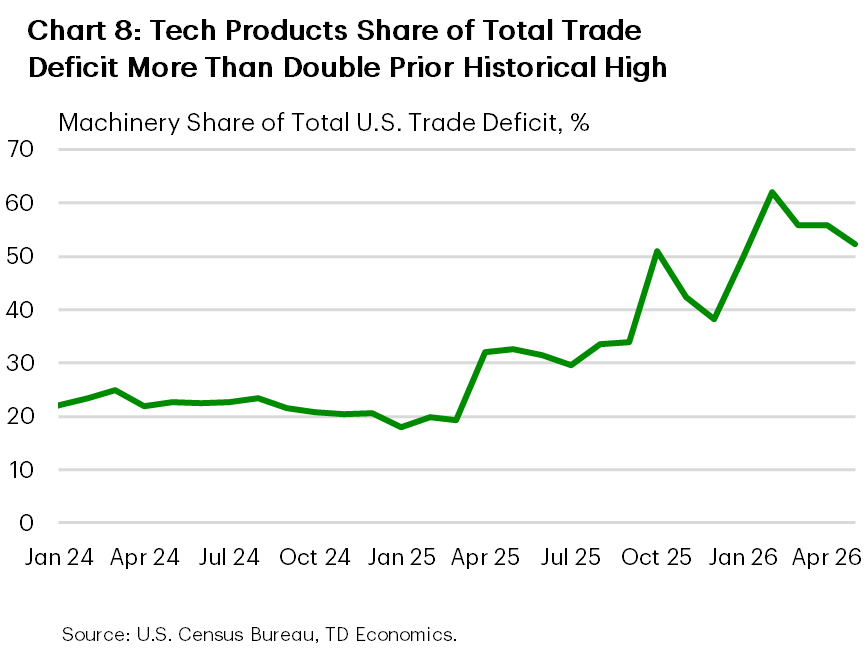
The magnitude of demand for AI is also likely to have implications for the U.S. trade deficit. In May 2026, the monthly U.S. trade deficit in machinery hit $51.6 billion – a roughly three-fold increase relative to 2023. This is equal to more than 50% of the aggregate U.S. trade deficit (Chart 8), reflecting the significance of these trends for the future of the U.S. trade balance. Currently, the increase in commodity prices and volumes is largely offsetting this trend, but if these trends subside as the demand for AI persists, then U.S. trade imbalances are likely to only worsen moving forward.
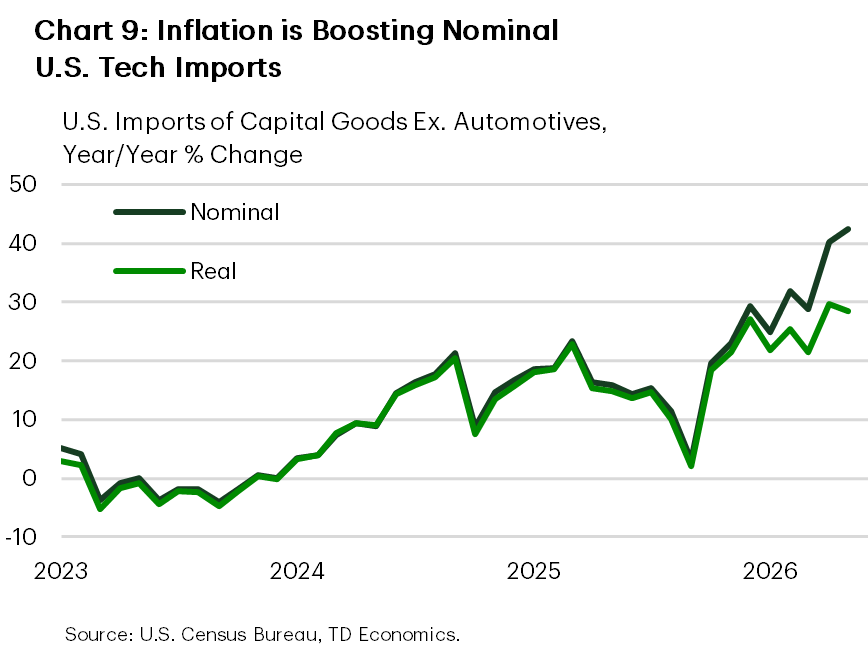
One caveat needs to be added here. Similar to the inflation of U.S. exports being driven by strong commodity price growth, the AI boom has also had an inflationary impact on U.S. imports. Looking at the Census Bureau data for U.S. imports of capital goods excluding automotives, which is roughly 70% technology products, we can see the material difference between year-on-year growth in nominal and real U.S. imports of these categories (Chart 9). If these trends recede as the AI boom matures, then the impact on the U.S. trade deficit may be less, but this would likely only be a modest offset to the broader shift in the composition of U.S. import demand.
Bottom Line
The U.S. trade deficit has remained broadly stationary, but the stability is masking a meaningful shift in its underlying drivers. Commodity-linked exports have provided an important near-term offset to the import impulse from AI-related hardware demand, though that support is likely to diminish as gold and oil tailwinds fade. By contrast, the buildout of AI infrastructure appears more durable, increasingly routed through Taiwan and Mexico, and likely to keep upward pressure on machinery imports. Unless new export drivers emerge, or the AI import cycle moderates more meaningfully than expected, the balance of risks points to a wider U.S. trade deficit over the medium term.
Disclaimer
This report is provided by TD Economics. It is for informational and educational purposes only as of the date of writing, and may not be appropriate for other purposes. The views and opinions expressed may change at any time based on market or other conditions and may not come to pass. This material is not intended to be relied upon as investment advice or recommendations, does not constitute a solicitation to buy or sell securities and should not be considered specific legal, investment or tax advice. The report does not provide material information about the business and affairs of TD Bank Group and the members of TD Economics are not spokespersons for TD Bank Group with respect to its business and affairs. The information contained in this report has been drawn from sources believed to be reliable, but is not guaranteed to be accurate or complete. This report contains economic analysis and views, including about future economic and financial markets performance. These are based on certain assumptions and other factors, and are subject to inherent risks and uncertainties. The actual outcome may be materially different. The Toronto-Dominion Bank and its affiliates and related entities that comprise the TD Bank Group are not liable for any errors or omissions in the information, analysis or views contained in this report, or for any loss or damage suffered.
Download
Share: