Highlights
- Job gains in January were a huge surprise to forecasters and financial markets, casting doubt on the long-held belief that the U.S. labor market is cooling and slowly coming back into greater balance.
- Zooming out to assess a wider range of labor market metrics suggests that it might be premature to discard that narrative, as the larger pool of data still points to a labor market that is continuing to rebalance.
- The U.S. economy’s impressive resilience was certainly on display in the recent hiring tallies. That said, we still expect growth to slow over the coming quarters, taking labor demand down along with it. That should push the unemployment rate higher this year, albeit to a lesser extent that we expected a few months ago.
January’s blockbuster job numbers and revisions seemingly upset the apple cart on the pattern of gradual slowing in the U.S. labor market (see commentary). However, if you pull back the lens to take in a broader selection of labor market indicators, evidence of cooler conditions remain. For now, the labor market remains tight, as shown by the simple unemployment rate still near multi-decade lows. But we expect that as economic growth slows through the year, demand for workers will continue to cool, balancing conditions in the labor market further and enabling wage growth to normalize further. This report walks through the various metrics economists look at to gauge labor market strength. Key labor market indicators are summarized in Table 1, showing where they stand relative to the recent, and longer-term trends.
JOLTs Data Suggests Labor Demand Has Cooled
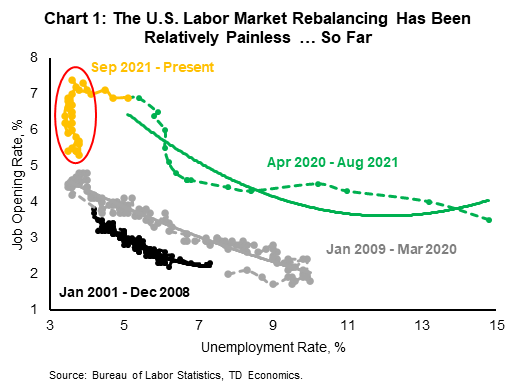
Job openings as measured by the Job Openings and Labor Turnover Survey (JOLTS) and employment postings on Indeed are both on the decline – a development that is consistent with softening labor demand. While the number of unfilled jobs is still above its pre-pandemic level, it has fallen notably from the peak in early 2022 (Table 1). Additionally, measures of labor market tightness such as the job openings to unemployed ratio have been trending down. With a smaller number of jobs available, unemployed workers find it more difficult to gain employment, while currently employed workers may be less inclined to leave their current roles in search of new ones. On the upside, what has been interesting in the current cycle is that job openings have come down with relatively little pain for workers, as unemployment has barely budged from its multi-decade lows (Chart 1).
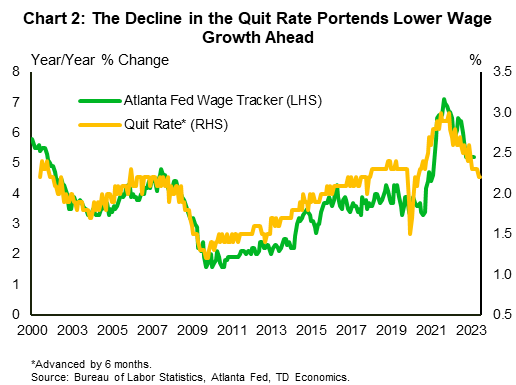
Given softer labor demand, it is not surprising that fewer workers quit their jobs than earlier in the pandemic recovery when a tight labor market sent resignations soaring. All told, the quit rate has fallen back to its pre-pandemic level, when the labor market was also relatively tight (Table 1). A reduction in the quit rate will limit how fast wages grow, as companies face less competition in attracting and keeping workers (Chart 2).
Companies have also ratcheted back on hiring. The hiring rate has fallen below pre-pandemic levels in recent months, possibly signaling that labor demand is weakening (Table 1). Additionally, there has been a spate of high-profile layoffs that have made headlines. However, looking at the broader picture, the announced cuts are a relatively small share of the over 157 million people on U.S. payrolls. In fact, the layoff rate has remained low, relatively consistent and in line with its pre-pandemic level of around 1.1% since late 2020. Weekly filings for unemployment benefits, which are a timelier indicator of layoffs, have ticked up in recent weeks, but also remain low by historical standards.
Table 1: U.S. Labor Market Indicators
Table 1 presents information on some key U.S. labor market indicators set up in rows. These are employment growth, wage growth, the unemployment rate, job opening rate, job hire rate, job quit rate, the ratio of job openings to unemployed workers and temporary help employment growth. The columns show growth or the level of the variable over selected time periods, such as the most recent year-over-year percent change, the long-term average, the 12-month average to December 2019 and the pandemic peak or trough. The data is color-coded to help identify trends across the table. Overall, most variables have come-off the peaks witnessed during the pandemic but are still showing strength relative to their longer-term histories.
| Last Obs. | Current | Pandemic Recovery Peak | Pre-Pandemic (2019 Avg.) | Long-Term Average* | |
| Jan. 2024 | Payrolls Employment Growth (Y/Y % Chg.) | 1.9 | 10.9 | 1.3 | 0.7 |
| Wage Growth (Y/Y % Chg.) | 4.8 | 7.8 | 3.6 | 2.8 | |
| Unemployment Rate (%) | 3.7 | 3.4 | 3.7 | 6.0 | |
| Temporary Help Employment Growth (Y/Y % Chg.) | -7.0 | 42.8 | -1.2 | 1.0 | |
| Dec. 2023 | Job Opening Rate (%) | 5.4 | 7.4 | 4.5 | 3.1 |
| Job Hire Rate (%) | 3.6 | 6.1 | 3.9 | 3.6 | |
| Job Quit Rate (%) | 2.2 | 3.0 | 2.3 | 1.9 | |
| Job Opening to Unemployed Workers (Ratio) | 1.4 | 2.0 | 1.2 | 0.6 |
The combination of a declining hiring rate and low layoffs suggests that companies may be in a wait-and-see mode. Not wanting to hire new employees in case demand pulls back, but not wanting to let go of current ones in case it does not. A declining hiring rate, however, does pose some risk to the employment outlook, as it means that layoffs would not have to increase by much for job growth to stall.
Various Indicators Point to Slowing Momentum
There are also several other less widely reported measures which are currently pointing to a more subdued labor market. One bellwether for the U.S. labor market is the trend in temporary help services employment. Temporary help services (or temp) employment is a cyclical indicator that is usually rising when the economic outlook is good and employers anticipate an uptick in demand, and falling when the reverse is true. Currently, temp employment has been on a downtrend. The monthly change has been negative for 21 out of the past 22 months, with January 2024 being the only month posting positive growth. January aside, the overall trend has been one of slowing demand for additional temp workers (Table 1).
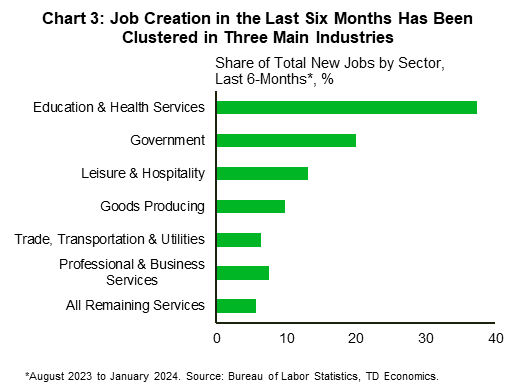
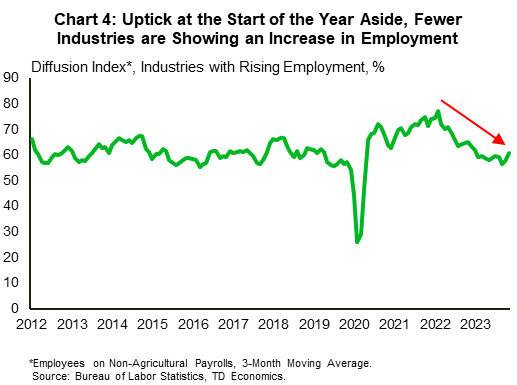
Hiring breadth is another indicator that shows how widespread labor demand is. While job growth was robust in 2023, beneath the surface, growth was largely driven by a relatively narrow subset of industries. Over 70% of the new jobs created in the past six months were concentrated in just three sectors – private education and healthcare, government and leisure and hospitality (Chart 3). These sectors account for just over 40% of total employment. Apart from leisure and hospitality, the other two sectors are largely non-cyclical, suggesting that employment growth has been buoyed by sectors that are generally unresponsive to the economic cycle. The theme of fewer industries driving growth is also evident in the diffusion index which charts the net number of industries reporting a rise in employment. This has been on a general downtrend since early 2022 (Chart 4). The concentration of new jobs within a small set of largely non-cyclical sectors is a sign of slowing labor market momentum.
Slowing labor market momentum is the second sign of a more subdued labor market. The labor market conditions index published by the Kansas City Fed which tracks activity across 24 labor market variables, is also pointing to slowing momentum. The momentum indicator has been very close to its historical average for much of last year (that is, a reading close to 0) after declining from a pandemic peak of 2.47. The labor market activity indicator has also been trending down since February 2022. Both are pointing to a cooling in labor market conditions.
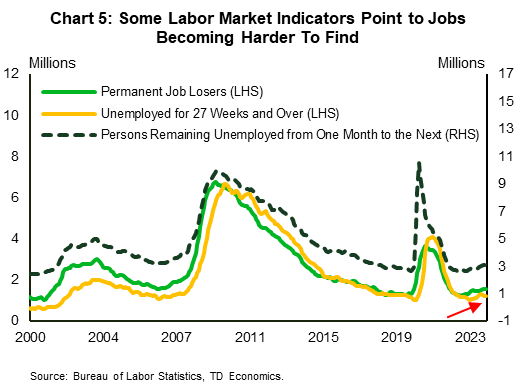
Another set of variables pointing to a more balanced labor market are those showing that it is taking workers a longer time to find employment. Specifically, the number of persons among the unemployed who have lost a permanent job (vs being on temporary layoff or having completed a contract position) is starting to rise and it is doing so in tandem with the number of those who have been unemployed for over 6 months. This figure has risen by over 21% since troughing in March of last year. The number of people who remain unemployed from one month to the next has also been rising since its low point in late 2022 (Chart 5). Taken together, these three factors show that it is becoming more difficult for workers to find new employment once they become unemployed – a significant shift from the immediate post-pandemic months when the job finding and job switching rates were historically high.
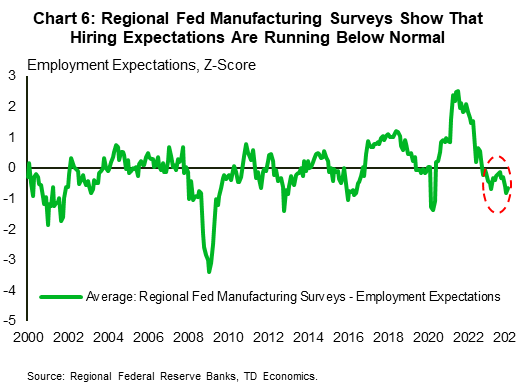
This observation dovetails with other indicators which show that much of the balance in the labor market has shifted back in favor of employers. Firstly, fewer businesses seem to be as concerned about labor issues. As reflected in the Federal Reserve’s most recent summary of economic condition (i.e. the Fed’s Beige Book) “ nearly all Districts cited one or more signs of a cooling labor market, such as larger applicant pools, lower turnover rates, more selective hiring by firms, and easing wage pressures.” Reports from the small business sector as well as the CFO survey support this view, with executives noting that replacing and retaining staff has become easier in recent months. Regional Fed surveys of manufacturing hiring expectations in the future also point to lower labor needs from firms (Chart 6).
On the Plus-Side?
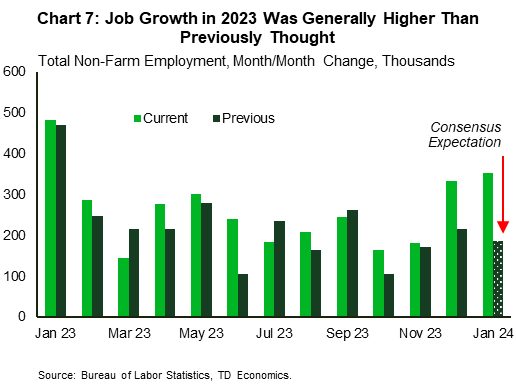
Despite the general trend of a cooling labor market, there are a few indicators pointing in the opposite direction. The foremost among these is the recent revisions to the nonfarm payrolls data, which showed that job growth in 2023 was better than previously thought and January’s employment numbers blew past expectations (Chart 7). While January’s data may have been exaggerated by seasonality, the number was still fairly strong and the revisions to the two previous months suggest job creation picked up heading into 2024. It’s quite possible that the strong Q4 growth performance of the economy contributed to the uptick in employment reported for November 2023 through January 2024. Wage growth also remains strong at 4.5% year-on-year, indicative of previous comments made by Fed Chair Powell that the expected deceleration in wage growth may take a few years to play out.
Prior to the release, policymakers were encouraged by signs that the labor market was cooling but are now more concerned that a re-acceleration in labor market pressures could pose a risk to hitting the 2% inflation target. The concern is not unwarranted given the recent reading on CPI, with price pressures in the services sector once again gaining traction. A tight labor market in service industries such as leisure and hospitality and education and health services could lead to wage pressures, posing a risk of inflation picking up again.
Another recent development has been a rebound in consumer sentiment, with consumers’ assessment of labor market conditions jumping to the highest level since the pandemic. According to the Conference Board’s consumer confidence index for January, the share of consumers saying jobs were “hard to get” fell to 9.8%, the second lowest in records dating back to 1978. So, despite empirical measures showing that it is becoming more difficult to find a job, consumers having puzzling flipped their perception.
Bottom Line
January’s job report and the revisions to non-farm payrolls seems to have thrown a wrench in the narrative of a cooling labor market. But pulling back the lens to take in a broader selection of labor market indicators, the general softening trend remains intact. The U.S. labor market remains strong, but has come into greater balance. More specifically, indicators such as the hire rate, the quit rate and wage growth (from the employment cost index and Atlanta Fed wage tracker) are still pointing to a more subdued labor market. Policymakers however will have to assess the totality of labor market indicators over the coming months to get a more accurate reading of where the U.S. labor market currently stands. Will these indicators corroborate the strength witnessed in non-farm payrolls, suggesting that there may still be some ways to go to restore balance to the market, or will they continue to point to continued cooling.
We expect the labor market to continue cooling in the months ahead. GDP growth is expected to come down from the above trend pace witnessed last year, and that should contribute to softer labor demand in 2024. As illustrated by the January jobs data however, this cycle is unique, characterized by greater resilience of both the economy and the labor market. As such, we anticipate that a soft landing will involve only a moderate increase in the unemployment rate from its current 3.7% to just above 4%. Less severe than our previous forecast, but still indicative of a more balanced labor market.
Disclaimer
This report is provided by TD Economics. It is for informational and educational purposes only as of the date of writing, and may not be appropriate for other purposes. The views and opinions expressed may change at any time based on market or other conditions and may not come to pass. This material is not intended to be relied upon as investment advice or recommendations, does not constitute a solicitation to buy or sell securities and should not be considered specific legal, investment or tax advice. The report does not provide material information about the business and affairs of TD Bank Group and the members of TD Economics are not spokespersons for TD Bank Group with respect to its business and affairs. The information contained in this report has been drawn from sources believed to be reliable, but is not guaranteed to be accurate or complete. This report contains economic analysis and views, including about future economic and financial markets performance. These are based on certain assumptions and other factors, and are subject to inherent risks and uncertainties. The actual outcome may be materially different. The Toronto-Dominion Bank and its affiliates and related entities that comprise the TD Bank Group are not liable for any errors or omissions in the information, analysis or views contained in this report, or for any loss or damage suffered.
Download
Share: